
Market Overview
| Study Period | 2020 - 2031 |
|---|---|
| Forecast Data Period | 2026 - 2031 |
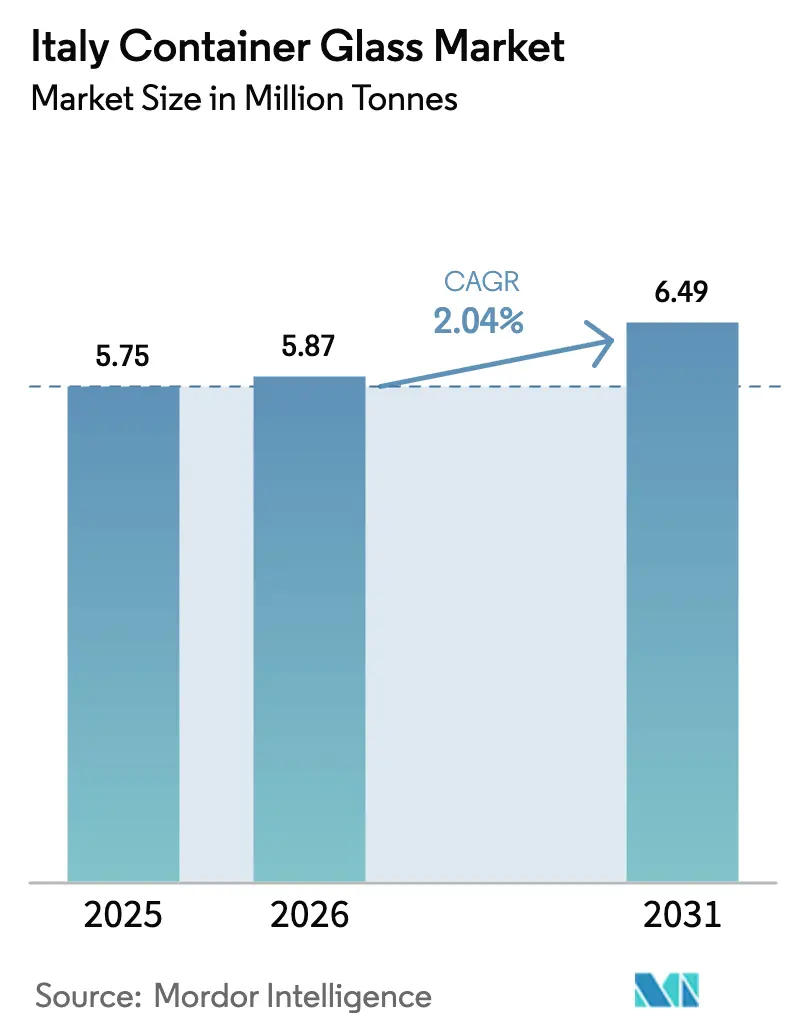
| Base Year Market Size (2025) | 5.75 Million tonnes |
| Market Volume (2026) | 5.87 Million tonnes |
| Market Volume (2031) | 6.49 Million tonnes |
| Growth Rate (2026 - 2031) | 2.04% CAGR |
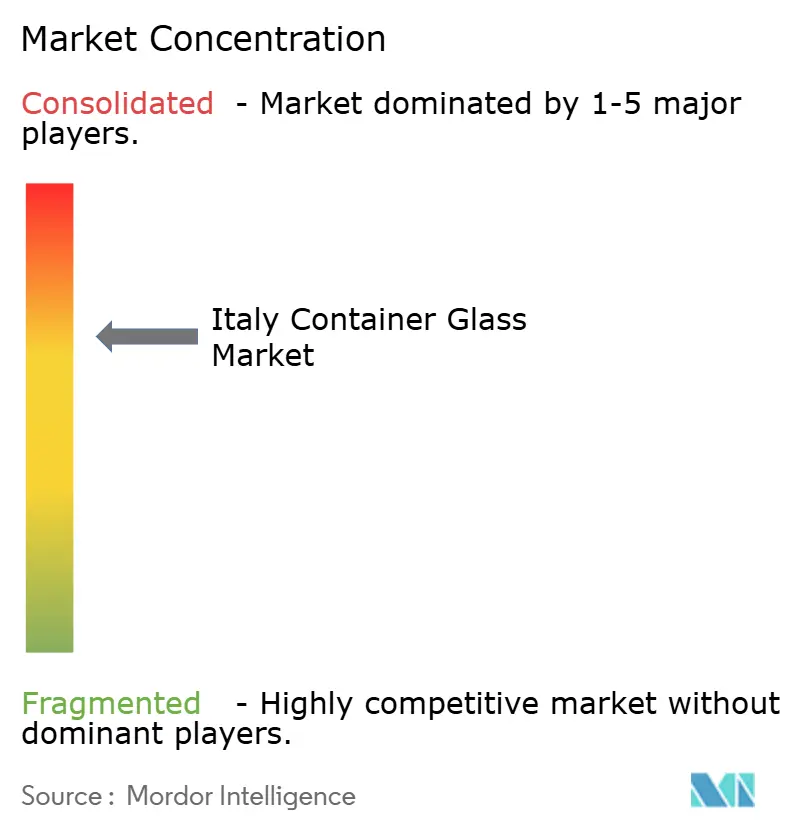
| Market Concentration | Medium |
Major Players *Disclaimer: Major Players sorted in no particular order Image © Mordor Intelligence. Reuse requires attribution under CC BY 4.0. | |
Italy Container Glass Market Analysis by Mordor Intelligence
The Italy Container Glass Market size is expected to grow from 5.75 million tonnes in 2025 to 5.87 million tonnes in 2026 and is forecast to reach 6.49 million tonnes by 2031 at 2.04% CAGR over 2026-2031. This steady trajectory shows how the Italy container glass market benefits from a mature recycling ecosystem, strong premium beverage demand, and supportive circular-economy legislation. The Italy container glass market continues to enjoy favorable consumer sentiment toward recyclable packaging, even as lightweight alternatives compete aggressively on logistics costs. Regulatory incentives for recycled content reinforce the Italy container glass market’s resilience, while glass’s premium image sustains pricing power in wine, spirits, and cosmetics applications. Technology investments in electric and hybrid furnaces, coupled with expanding cullet supplies, further anchor the Italy container glass market on a balanced path of incremental volume gains and rising value per ton.
Key Report Takeaways
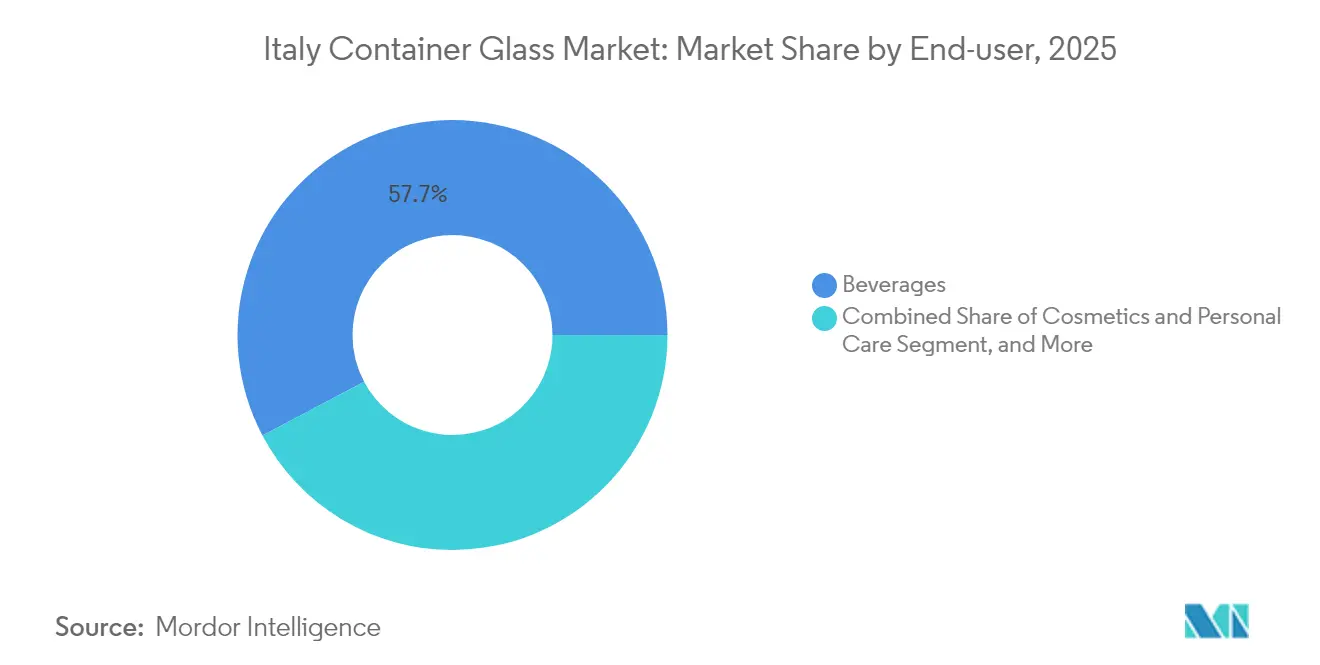
- By end-user, beverages captured 57.74% of the Italy container glass market share in 2025.
- By color, the Italy container glass market size for the amber glass segment is forecast to advance at a 3.62% CAGR through 2031.
Note: Market size and forecast figures in this report are generated using Mordor Intelligence’s proprietary estimation framework, updated with the latest available data and insights as of 2026.
Italy Container Glass Market Trends and Insights
Drivers Impact Analysis*
| Driver | (~)% Impact on CAGR Forecast | Geographic Relevance | Impact Timeline |
|---|---|---|---|
| Rising Demand for Eco-Friendly and Sustainable Packaging Solutions | +0.8% | Italy, with spillover to EU markets | Medium term (2-4 years) |
| Government Policies and EU Regulations Supporting Circular Economy | +0.6% | Italy and broader EU region | Long term (≥ 4 years) |
| Booming Beverage Industry, Especially Wine, Spirits, and Craft Beer | +0.4% | Northern Italy wine regions, national spirits market | Short term (≤ 2 years) |
| Health and Safety Awareness Among Consumers | +0.3% | Italy, particularly urban centers and premium market segments | Medium term (2-4 years) |
| Technological Innovations in Glass Manufacturing | +0.3% | Italy manufacturing hubs in Veneto and Lombardy | Medium term (2-4 years) |
| Premium Branding and Shelf Appeal of Glass Packaging | +0.2% | Italy, with focus on luxury goods and export markets | Long term (≥ 4 years) |
| Source: Mordor Intelligence | |||
Rising Demand for Eco-Friendly and Sustainable Packaging Solutions
Italian shoppers view endlessly recyclable glass as a tangible response to packaging waste concerns. Supermarkets now prioritize shelf space for products in returnable or high-recycled-content bottles, pushing brand owners toward glass. The PPWR target of 90% collection by 2030 accelerates this shift, and the Italy container glass market gains structural support as CONAI’s reverse-logistics network achieves consistent cullet flows. Brands willing to pay a green premium amplify demand, ensuring that the Italy container glass market remains the default for high-image goods while plastic alternatives face levies and reputational risks.[1]European Commission, “Packaging and Packaging Waste,” ec.europa.eu
Government Policies and EU Regulations Supporting Circular Economy
Italy’s plastic tax of EUR 0.45 (USD 0.48) per kg, introduced in 2024, immediately narrowed the cost gap between PET and glass. Extended producer-responsibility fees now scale with recyclability scores, effectively subsidizing glass because of its high recovery rate. National glass-recycling plants operating under CoReVe process more than 2 million tons of cullet annually, guaranteeing supply stability for producers. These policy levers collectively raise the baseline for the Italy container glass market and discourage substitution in premium segments.[2]Conai, “Nel 2022 Riciclato il 71.5% dei Rifiuti di Imballaggio,” conai.org
Booming Beverage Industry, Especially Wine, Spirits, and Craft Beer
Wine production of 44.5 million hectoliters in 2024 underpins a deep pipeline of bottle demand, and premium labels continue to specify heavier glass for brand distinctiveness. Over 900 craft breweries amplify call-offs for bespoke bottles that symbolize authenticity. Export-oriented spirit makers, enjoying double-digit U.S. sales growth, rely on glass for shelf impact and regulatory acceptance abroad. This cocktail of volume and value protects the Italy container glass market from near-term volume erosion and sustains furnace utilization rates.
Technological Innovations in Glass Manufacturing
Electric and hybrid furnaces installed in northern Italy demonstrate 15% lower energy intensity and quicker color changeovers. Real-time furnace modeling extends campaign life and curbs downtime, while advanced optical sorters elevate cullet purity, allowing recycled content to exceed 50% in some production runs. These technical gains nurture margins and lower carbon footprints, reinforcing competitiveness of the Italy container glass market even as fuel prices fluctuate.
Restraints Impact Analysis*
| Restraint | (~) % Impact on CAGR Forecast | Geographic Relevance | Impact Timeline |
|---|---|---|---|
| Intense Competition from Lightweight and Cost-Effective Alternatives | -0.4% | Italy and broader European markets | Short term (≤ 2 years) |
| Fragility and Risk of Breakage During Handling and Transport | -0.3% | Italy, particularly affecting export and logistics operations | Medium term (2-4 years) |
| Higher Transportation and Storage Costs Due to Weight | -0.3% | Italy, particularly affecting export markets | Medium term (2-4 years) |
| Limited Design Flexibility Compared to Malleable Materials | -0.2% | Italy, with focus on consumer goods and beverage sectors | Long term (≥ 4 years) |
| Source: Mordor Intelligence | |||
Intense Competition from Lightweight and Cost-Effective Alternatives
Aluminum cans weigh roughly 60% less than equal-volume glass, trimming freight outlays by as much as 25% for long hauls. PET bottles add design freedom and shatter resistance that appeal to on-the-go consumers. Beverage giants seeking quick cost wins can pivot formats rapidly, siphoning shared volume from the Italy container glass market in entry-price segments. Glass producers respond by targeting premium lines where packaging is central to brand heritage rather than a commodity cost.
Higher Transportation and Storage Costs Due to Weight
Each glass bottle’s heft raises per-unit transport spend by EUR 0.15-0.25 (USD 0.16-0.26) on long routes, and warehouse operators allocate 40% more space for safe stacking. As diesel surcharges and impending carbon fees widen logistics expense, exporters face shrinking margins. The Italy container glass market therefore concentrates on domestic and near-field EU flows, accepting a geography-bound opportunity set until greener logistics options scale.[3]Ardagh Group, “Climate Action,” ardaghgroup.com
*Our forecasts treat driver/restraint impacts as directional, not additive. The impact forecasts reflect baseline growth, mix effects, and variable interactions.
Segment Analysis
By End-User: Beverages Anchor Premium Positioning
The beverage segment commanded 57.74% of the Italy container glass market in 2025, generating the bulk of furnace throughput and sustaining multi-shift operations. Alcoholic drinks especially wine account for 35% of total volume and remain closely tied to rural viticulture clusters. Craft beer, posting 4.2% annual growth, energizes demand for distinctive bottle molds that smaller glassmakers can supply at attractive margins. Non-alcoholic premium juices and botanical sodas join this momentum, reinforcing the Italy container glass market size uplift.
Cosmetics and personal care exhibits the fastest expansion at a 3.9% CAGR, reflecting consumers’ appetite for refillable glass jars and prestige fragrances. Luxury brands leverage glass’s tactile and visual cues to justify higher price points, lifting revenue density per ton. Food applications form a stable, low-volatility base, while pharmaceutical vials and ampoules gain from Italy’s export-oriented drug sector. Together, these trends keep furnace utilization above 90% and encourage lines dedicated to smaller-batch, higher-margin runs.


By Color: Flint Retains Scale, Amber Accelerates
Flint glass delivered 36.85% of the Italy container glass market size in 2025, leveraging broad applicability across wine, spirits, and upscale waters. Transparent packaging showcases liquid color and clarity, attributes that premium producers exploit for shelf differentiation. Scale economies in flint production keep per-unit costs competitive despite rising energy prices, preserving its backbone role in the Italy container glass market.
Amber glass is advancing at 3.62% CAGR, fueled by pharmaceuticals that require UV shielding and by craft brewers favoring the classic amber look. Higher recycled-content thresholds are easier to achieve in amber, adding a sustainability edge. Green bottles continue to support traditional wine exports, while specialty hues serve niche promotional runs. Color diversity increasingly operates as a brand accessory rather than a technical constraint, widening the design palette available to Italy container glass market participants.
Geography Analysis
Northern Italy houses roughly 65% of container glass capacity, with Veneto and Lombardy offering dense clusters of skilled labor, cullet suppliers, and proximate beverage clients. The regional colocation of glassworks and wineries compresses delivery lead times, a decisive advantage for just-in-time bottling operations. Electric furnace pilots in Verona illustrate how the Italy container glass market can decarbonize while staying anchored in its historical heartland.
Central territories such as Tuscany and Lazio provide growing pockets of demand, propelled by luxury wine estates and Rome’s cosmetics distribution hub. Glassmakers expanding here accept longer cullet supply lines but gain access to premium customers who value bespoke bottle shapes. Recent brownfield expansions in Florence target export-ready wine brands, broadening the Italy container glass market’s mid-peninsula footprint.
Southern Italy contends with higher outbound freight costs to northern buyers yet offers comparative labor savings. Incremental investments in Sicily exploit closeness to Mediterranean shipping lanes, enabling the Italy container glass market to service North African and Middle Eastern beverage fillers. EU infrastructure funding continues to upgrade southern road and port networks, progressively narrowing the logistics gap with the north.
Regulatory Landscape
Italy’s container glass market operates within EU packaging rules and Italy’s Environmental Code (Legislative Decree 152/2006), implemented through the national EPR system coordinated by CONAI (Consorzio Nazionale Imballaggi). The EU Packaging and Packaging Waste Regulation, Regulation (EU) 2025/40 (PPWR), becomes applicable on August 12, 2026, formalizing mandatory recycling and reuse targets that raise compliance focus across packaging value chains.
To align national rules with PPWR, Law 36/2026 delegates the Council of Ministers to adopt legislative decrees by December 9, 2026. With Italy’s use of modulated EPR fees that reflect recyclability characteristics, glass retains an advantage versus less recyclable formats, keeping recycled-content and collection performance central to supplier and brand-owner decisions.
Value Chain Analysis
The Italy container glass value chain starts with raw materials (silica sand, soda ash, limestone and additives) and high-temperature melting in gas- and electricity-intensive furnaces. It then moves through forming, annealing, inspection, decoration and distribution to fillers and brand owners. Assovetro (the Italian Association of Glass Industrialists) anchors industry coordination, representing 17 companies and 40 production facilities, and the wider industry remains centered on large-scale, continuous operations tied to stable energy and cullet supply.
Demand concentrates in beverage bottling and premium food, where logistics favor proximity between glassworks and filling lines due to weight and breakage risk. On the circular side, post-consumer glass returns through Italy’s EPR and collection ecosystem under CONAI, with glass-specific recycling coordinated by CoReVe to support a steady cullet stream for higher recycled-content runs. Major producers such as Verallia Italia (seven production sites and over 1,600 employees) and Vetri Speciali S.p.A. (five plants across Gardolo, Ormelle and San Vito al Tagliamento) highlight the scale and regional clustering that influence supplier selection, lead times and customization capability.
Competitive Landscape
The competitive arena shows moderate concentration, with Verallia Italia, O-I Glass Italy, and Zignago Vetro controlling a material share yet leaving room for mid-tier firms specializing in artisanal runs. Corporate strategies focus on capital efficiency, furnace modernization, and vertically integrated cullet procurement. Verallia’s EUR 1.2 billion (USD 1.29 billion) Allied Glass acquisition widens specialty know-how, bolstering its claim on high-value spirits packaging. Zignago Vetro’s planned EUR 45 million pharmaceutical line demonstrates the pivot to margin-rich segments where certification and traceability act as entry barriers.
Technology differentiation is now central. O-I’s optical-sorting upgrade feeds cleaner cullet, allowing 50% recycled content without compromising bottle clarity. Ardagh’s biofuel trials point to long-range carbon reductions that could insulate the Italy container glass market from escalating ETS charges. Smaller players mitigate scale disadvantages through flexible molding equipment and rapid color-change capability, serving craft beverage labels that require limited production lots.
Customer intimacy remains pivotal. Wineries and cosmetics brands demand collaborative design and just-in-time drops, favoring suppliers located within a day’s drive. This logistics reality preserves a multi-player landscape despite global consolidation trends. Because the top five producers hold around 70% of national volume, the market receives a concentration score of 7, reflecting significant yet not overwhelming dominance.
Italy Container Glass Industry Leaders
Verallia Group
Vetropack Holding Ltd
Vetri Speciali SpA
Vetrobalsamo S.p.A.
O-I Glass Italy S.r.l. (Owens-Illinois)
- *Disclaimer: Major Players sorted in no particular order

Market Opportunities and Future Outlook
PPWR implementation milestones create a near-term opportunity for producers and brand owners to accelerate packaging redesign around recyclability and recycled content, drawing on Italy’s established CONAI-CoReVe system for cullet quality improvements. Upgrades that improve furnace efficiency and decarbonization compatibility also create room for longer-term supply agreements with beverage, food and cosmetics customers tightening packaging sustainability requirements.
Italy’s recent capacity and capability upgrades show where procurement decisions may concentrate. Verallia Italia inaugurated a EUR 110 million oxy-combustion furnace in Pescia in June 2026, and it also tested a hydrogen-electric hybrid truck as part of sustainable logistics initiatives. In parallel, optical sorting upgrades (including initiatives referenced for O-I Glass Italy) expand technical headroom for higher recycled-content production without compromising bottle clarity, which supports premium flint and specialty formats where performance and aesthetics drive purchasing decisions.
Recent Industry Developments
- June 2026: Verallia Italia inaugurates a new oxy-combustion furnace for glass food packaging in Pescia. The upgrade improves energy efficiency and increases recycled-content potential, aligning with circular-economy trends. The capacity addition strengthens Verallia's premium packaging position in Italy, supporting higher-value wine and spirits applications.
- April 2026: Verallia Italia develops Aperol restyling for Campari Group. The collaboration is tied to premium beverage packaging demand and creates co design opportunities for limited edition lines. The engagement points to growing demand for customized packaging solutions with major beverage brands.
- January 2026: Verallia Italian Competition Authority AGCM closes the 2023 investigation regarding price increases in the wine bottle sector without finding infringements. The regulatory outcome clarifies the competitive environment and may influence pricing strategy for premium wine packaging.


Research Methodology Framework and Report Scope
Market Definition and Coverage
For this methodology, the Italy container glass market covers the volume of glass bottles, jars, and similar rigid glass containers supplied to Italian end users, across food, beverages, and other packaging needs, measured in tonnes.
Scope exclusions: It excludes flat glass, fiberglass, tableware, and most non-container items such as ampoules and laboratory glassware.
Segmentation Overview
- By End-user
- Beverages
- Alcoholic
- Beer
- Wine
- Spirits
- Other Alcoholic Beverages (Cider and Other Fermented Drinks)
- Non-Alcoholic
- Juices
- Carbonated Drinks (CSDs)
- Dairy Product Based Drinks
- Other Non-Alcoholic Beverages
- Alcoholic
- Food (Jam, Jelly, Marmalades, Honey, Sausages and Condiments, Oil, Pickles)
- Cosmetics and Personal Care
- Pharmaceuticals (excluding Vials and Ampoules)
- Perfumery
- Beverages
- By Color
- Green
- Amber
- Flint
- Other Colors
Data Sources, Market Sizing, and Validation
Desk Research
Desk research was used to set the market boundary, build a starting demand and supply picture, and align the model with observable national indicators. We reviewed public statistics and sector publications that help explain glass output, packaging use, and circular economy flows, such as releases from ISTAT, Eurostat PRODCOM, UN Comtrade, and relevant EU packaging and waste directives.
We also used industry sources such as Assovetro publications and COREVE materials on glass collection and recycling, plus peer-reviewed journals covering Italian glass production, energy intensity, and cullet use. Company annual reports, sustainability reports, and press coverage were also checked to confirm capacity changes, furnace rebuild cycles, and pricing commentary. Selected paid subscriptions were used only for company financials and intelligence, plus patent lookups where process upgrades were referenced. This list is indicative, and many other sources were reviewed for data collection, validation, and clarification.
Primary Interviews and Surveys
Primary work was used to confirm how demand is split across key container uses and to pressure-test desk assumptions that are not visible in public datasets. We spoke with executives, plant and commercial leaders, and downstream packaging buyers to validate tonnage movements, cullet availability, and typical product mix shifts through the year.
Since this is a single-country study, respondents were selected across Italy, with extra attention on the main manufacturing and consumption corridors, so capacity signals and end-user pull stayed aligned in the final model.
Distribution of primary research fieldwork respondents
| Company type | Respondent position | Region |
|---|---|---|
| Top tier: 29% | CXOs: 12% | |
| Mid tier: 56% | Functional/Unit leaders: 41% | |
| Smaller Players: 15% | Managers: 47% |
Market-Sizing & Forecasting
Sizing starts from a top-down reconstruction of Italy container glass demand in tonnes. Production, trade, and apparent consumption logic are used to build the national demand pool, then reconciled with end-use signals.
We then applied selective bottom-up checks, such as sampled producer output roll-ups, channel discussions on shipment patterns, and typical conversion between container mix and tonnage, to adjust totals when the top-line picture appeared stretched.
Key inputs used in the model include glass container production volumes, import and export tonnage movements, cullet collection and recycling rates (as a proxy for recycled-content feasibility), furnace rebuild timing, and visible shifts in beverage and food packaging demand. Price and value are not the core sizing unit here, so the focus stayed on physical volume, and whether utilization and trade flows logically match consumption.
For forecasting, scenario analysis was applied because near-term volume is sensitive to energy cost cycles, packaging substitution, and the pace of recycled-content pull through. Assumptions for each scenario were reviewed with primary respondents. Where data gaps existed in smaller niches, we used conservative interpolation anchored to total container output and validated by interview feedback.
Data Validation & Update Cycle
Outputs were checked through multiple passes so the final time series stays consistent with real-world signals. We compared apparent consumption against production and trade trends, then tested whether implied growth rates aligned with what manufacturers and major end users described, before moving to sign-off.
Variance checks were run on year-to-year jumps, unusual trade spikes, and any mismatch between recycling availability and the implied cullet requirement. When an anomaly appeared, we revisited the assumption behind it and, if needed, re-contacted respondents for clarification. Reports are refreshed annually, with interim updates triggered by material events such as major furnace shutdowns, capacity starts, or sudden shifts in import pressure. Before delivery, an analyst completes a fresh review so clients receive the most current view.
Mordor Intelligence's Italy Container Glass Market Size Measured Against Other Published Estimates
Published market numbers for Italy container glass do not always line up because they often measure different things, even when the titles look similar. Differences usually come from whether the estimate is reported in tonnes or in USD, how imports and exports are treated, and whether adjacent glass products are quietly included.
The benchmark table shows a wide spread because some sources convert the market into revenue using assumed average selling prices, while others remain focused on traded glass container tonnage. That captures cross-border flows and misses most domestic shipments. In Mordor Intelligence's model, the market is sized in volume (tonnes) for container glass supplied to Italian end users, and it avoids mixing in flat glass, fiberglass, and tableware, which can inflate totals when the definition is broad.
Benchmark comparison
| Source | Market Size | Gaps in Research Methodology |
|---|---|---|
| Mordor Intelligence | USD 5.75 M (2025) | |
| Trade Data Publisher A | USD 0.93 M (2024) | Uses import and export tonnage for glass containers as the main proxy for market size, which understates domestic production shipped within Italy and may also apply HS code boundaries that do not fully match container glass used in packaging. |
| Independent Research Group B | USD 1.67 B (2025) | Reports the market in revenue and likely applies blended ASP assumptions and a broader packaging scope, so value inflation can occur if premium bottles, decorative containers, or services are included beyond pure container glass volume. |
Taken together, the differences are mostly explained by unit choice and boundary setting, rather than a real disagreement on industry direction. Our approach keeps the total traceable to production, trade, and recycling related signals, and the checks from interviews help keep the volume trend realistic year by year.


Key Questions Answered in the Report
How large is the Italy container glass market in 2026?
The market totals 5.87 million tonnes in 2026 and is on track for 2.04% compound growth through 2031 (2026-2031).
Which end-user segment dominates demand?
Beverages account for 57.74% of total volume, driven by wine, spirits, and expanding craft beer lines.
Why is amber glass growing faster than other colors?
Amber’s UV-blocking properties meet pharmaceutical and craft-beer needs, pushing a 3.62% CAGR to 2031.
How do EU regulations influence glass packaging in Italy?
Plastic taxes, higher recycling targets, and extended producer-responsibility fees encourage brand owners to choose glass and raise recycled content mandates.
What technology trends shape competitiveness among Italian glassmakers?
Investments in electric or hybrid furnaces, optical cullet sorting, and rapid color-change lines cut emissions and improve production flexibility.
Page last updated on:






