
Market Overview
| Study Period | 2020 - 2031 |
|---|---|
| Market Size (2026) | USD 1.65 Trillion |
| Market Size (2031) | USD 2.51 Trillion |
| Growth Rate (2026 - 2031) | 8.78% CAGR |
| Fastest Growing Market | Asia Pacific |
| Largest Market | North America |
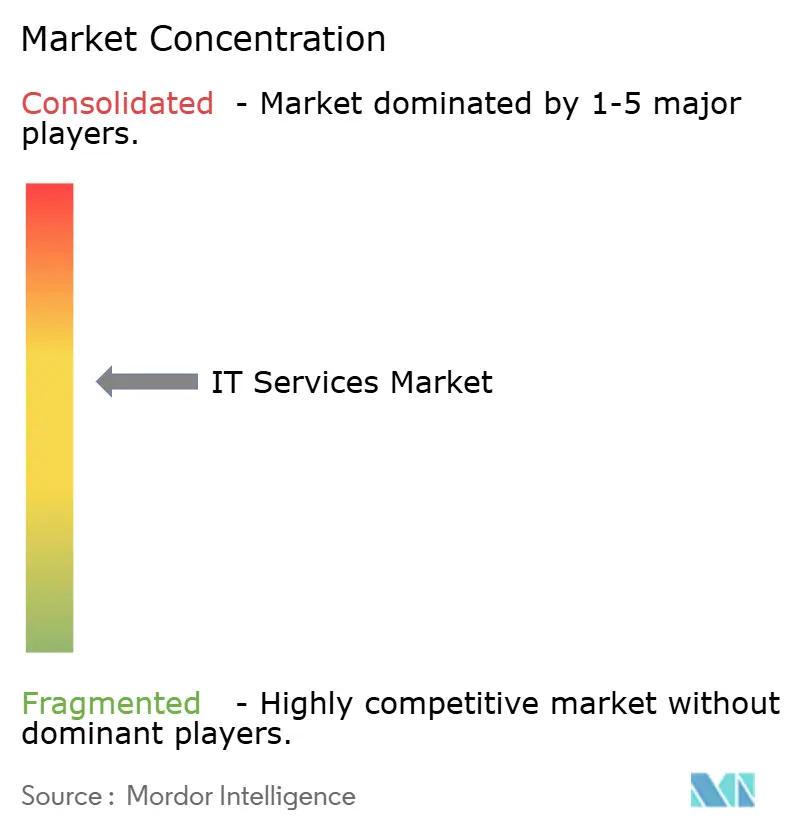
| Market Concentration | Medium |
Major Players *Disclaimer: Major Players sorted in no particular order Image © Mordor Intelligence. Reuse requires attribution under CC BY 4.0. | |
IT Services Market Analysis by Mordor Intelligence
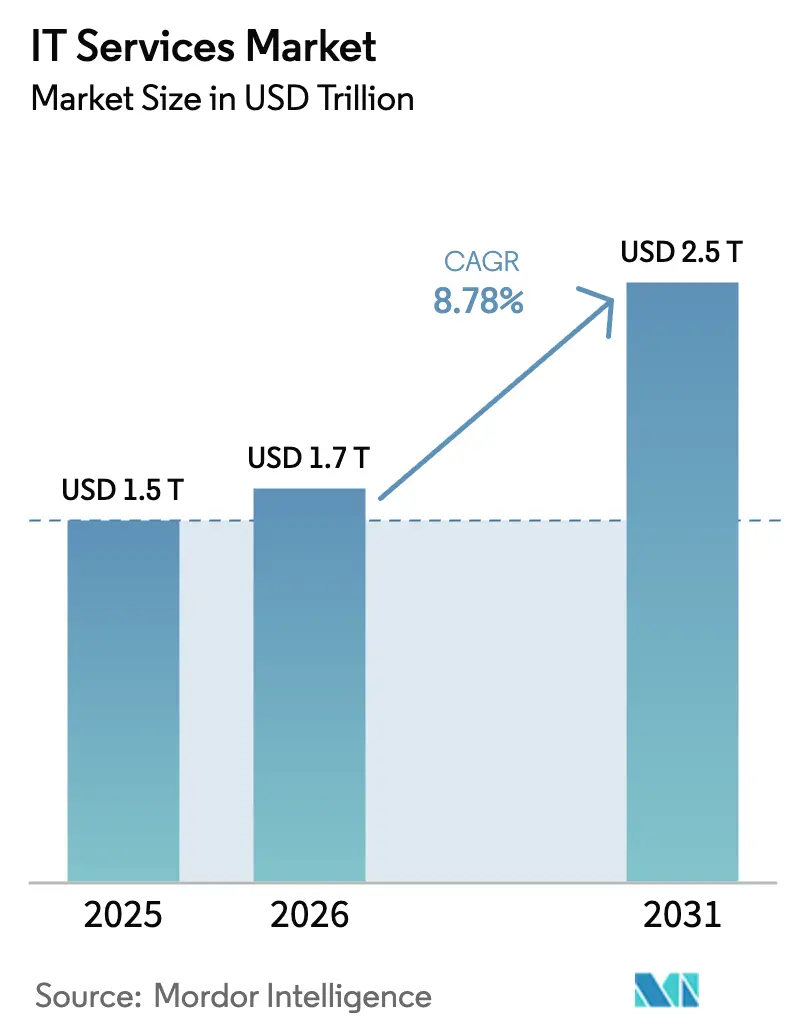
The IT Services Market size is estimated at USD 1.65 trillion in 2026, and is expected to reach USD 2.51 trillion by 2031, at a CAGR of 8.78% during the forecast period (2026-2031).
Robust digital-transformation agendas, an upswing in enterprise artificial-intelligence adoption, and rising cloud-native migrations are expanding addressable demand. Spending momentum is strongest in banking and healthcare, where 2024 outlays jumped 8.7% and 15% respectively as institutions modernized legacy cores. Providers able to bundle consulting, implementation, and managed services around hybrid-cloud and AI workloads capture premium contracts, while price-sensitive outsourcing engagements continue to anchor large-scale delivery pipelines. Heightened consolidation—including multibillion-dollar acquisitions—shows that scale, vertical depth, and intellectual-property differentiation are now decisive in winning enterprise renewals.
Key Report Takeaways
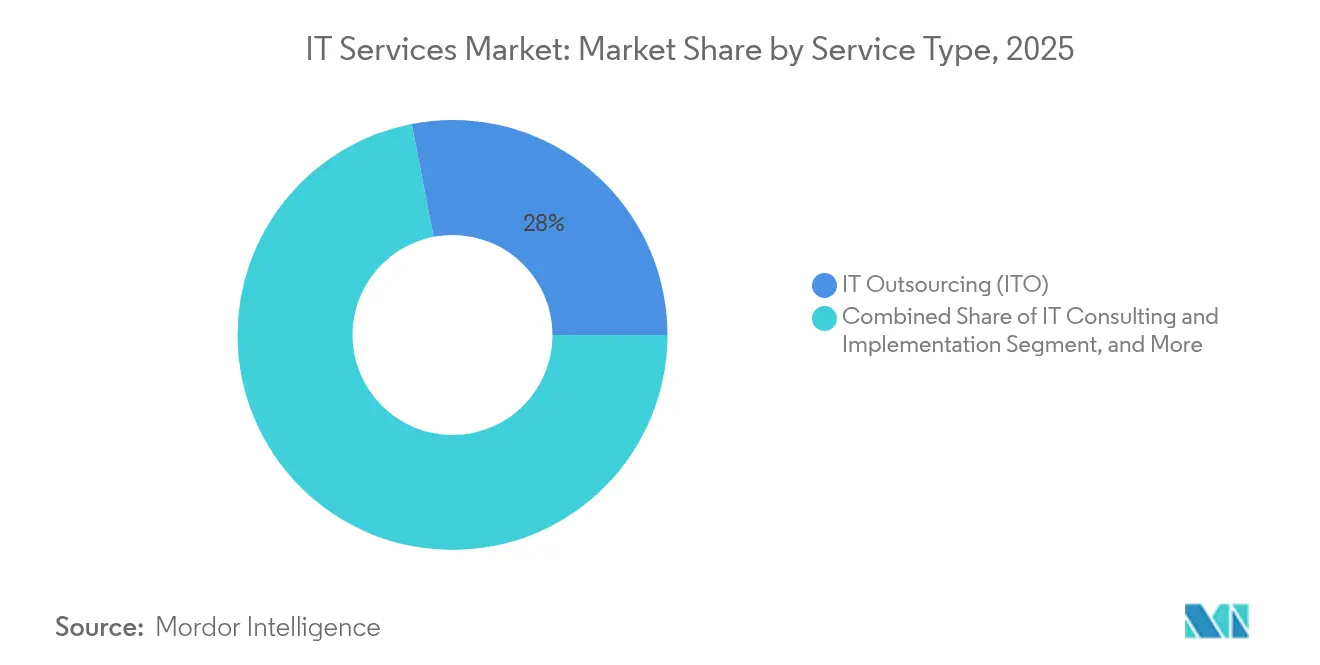
- By service type, IT Outsourcing led with a 28.04% revenue share in 2025; Managed Security Services is advancing at a 12.18% CAGR through 2031.
- By end-user enterprise size, Large Enterprises held 69.42% of the IT services market share in 2025, while Small and Medium Enterprises are expanding at an 10.92% CAGR to 2031.
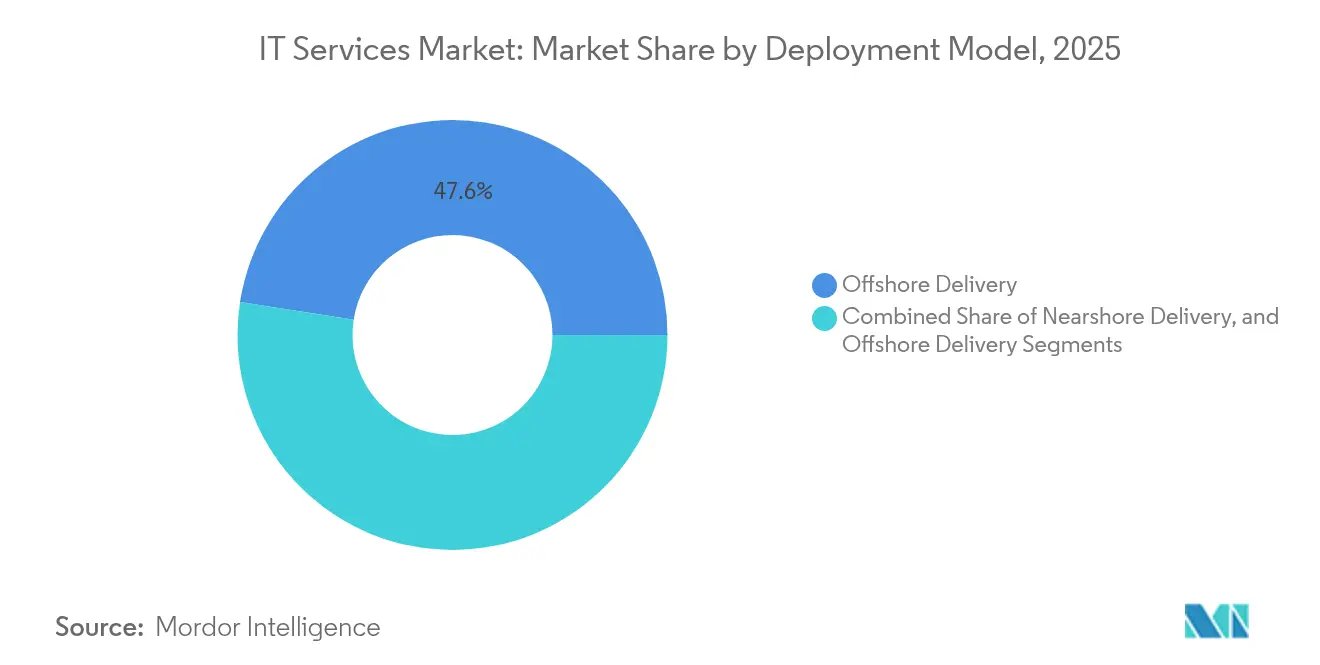
- By deployment model, Offshore Delivery accounted for 47.55% share of the IT services market size in 2025; Nearshore Delivery records the fastest 10.18% CAGR through 2031.
- By end-user vertical, Banking, Financial Services, and Insurance captured 24.38% share of the IT services market size in 2025; Healthcare and Life-Sciences is growing at an 11.02% CAGR to 2031.
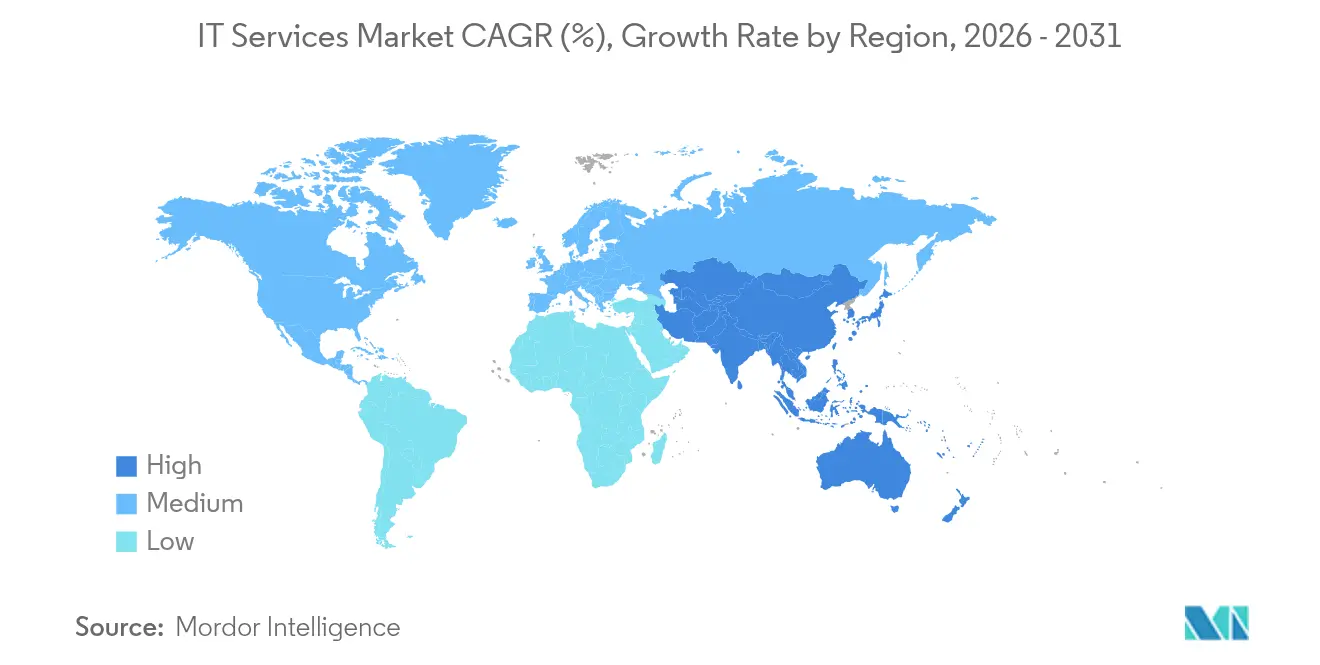
- By geography, North America commanded 37.05% revenue in 2025; Asia-Pacific is set to post the highest 11.12% CAGR through 2031.
Note: Market size and forecast figures in this report are generated using Mordor Intelligence’s proprietary estimation framework, updated with the latest available data and insights as of 2026.
Market Trends and Insights
Drivers Impact Analysis of IT Services Market*
| Driver | (~) % Impact on CAGR Forecast | Geographic Relevance | Impact Timeline |
|---|---|---|---|
| Digital-transformation acceleration | +2.1% | Global, especially North America and Europe | Medium term (2–4 years) |
| Hybrid-cloud migration boom | +1.8% | North America, Europe core; Asia-Pacific expansion | Long term (≥ 4 years) |
| Escalating cyber-threat landscape | +1.4% | Global, acute in BFSI and healthcare | Short term (≤ 2 years) |
| Enterprise AI and analytics spend surge | +1.9% | North America, Europe primary; Asia-Pacific emerging | Medium term (2–4 years) |
| Vertical-specific cloud platforms adoption | +1.2% | Global, sector-specific regional patterns | Long term (≥ 4 years) |
| Sustainability-driven Green-IT audits | +0.8% | EU and North America, global spillover | Long term (≥ 4 years) |
| Source: Mordor Intelligence | |||
Digital-transformation acceleration post-COVID-19
Multi-cloud adoption has crossed 87% of enterprises, while 51% are funding cloud-native modernization tracks that bundle application refactoring, AI services and data platforms. The Global IT services market now rewards providers that master container orchestration, micro-services and DevOps over simple lift-and-shift migration. DXC Technology’s “Cloud Right” approach enabled Ocean Network Express to achieve zero-downtime migration, showcasing how vendors move from infrastructure caretakers to strategic business partners. Revenue pools are shifting toward advisory and managed cloud operations layers that demand both deep technical credentials and sector insight. These engagements, typically structured around shared service-level outcomes, lift provider stickiness and unit economics. Skills scarcity in Kubernetes, site reliability engineering and FinOps is further buoying service rates, underscoring why cloud-first programmes add the highest positive delta to long-run growth.
Hybrid-cloud migration boom
Global cloud-ERP outlays are on track to nearly double between 2022 and 2027 as enterprises pursue workload portability and regulatory compliance.[1]IBM Institute for Business Value, “The Enterprise Guide to AI Governance,” ibm.com European firms directed EUR 489.8 billion (USD 553.5 billion) to IT services in 2025, with 45% tagged for cloud initiatives. Multi-cloud strategies help organizations avert vendor lock-in, yet they impose governance complexity that drives demand for advisory and optimization services. Data sovereignty mandates heighten the need for region-specific hosting footprints, bolstering nearshore and onshore engagements. Providers offering certified cloud architects and managed FinOps talent are capturing high-margin contracts across the IT services market.
Escalating cyber-threat landscape
Average breach costs are projected to hit USD 4.45 million in 2025, and cybercrime losses are set to reach USD 10.5 trillion annually.[2]Patrick Castillo, “Cybersecurity Compliance in 2025: Preparing for New Regulations,” ntiva.com Regulatory frameworks like the EU’s DORA require auditable cyber-resilience, pushing enterprises toward third-party managed security. Zero-Trust architectures and AI-enabled threat-hunting have moved from best practices to mandatory controls. Providers specializing in security operations, incident response, and compliance management report record pipelines, with double-digit growth consistently outpacing the broader IT services market.
Enterprise AI and analytics spend surge
Global AI expenditure is heading toward USD 826.7 billion by 2030 as executive teams weaponize data for competitive gain. In banking, 77% of leaders deem generative AI deployment-ready. Over half of large enterprises have instituted AI governance boards, signaling that ethical, legal, and operational oversight is now a board-level agenda item. Consulting firms that fuse data-science talent with risk and compliance know-how are uniquely positioned to shepherd complex enterprise rollouts.
Restraints Impact Analysis of IT Services Market*
| Restraint | (~) % Impact on CAGR Forecast | Geographic Relevance | Impact Timeline |
|---|---|---|---|
| Service-price commoditization pressure | -1.3% | Global, especially offshore hubs | Short term (≤ 2 years) |
| Global talent shortage and attrition | -1.8% | North America, Europe primary; Asia-Pacific secondary | Medium term (2–4 years) |
| Data-sovereignty geopolitical barriers | -0.9% | EU and Asia-Pacific compliance-driven | Long term (≥ 4 years) |
| Scope-3 carbon-reporting compliance costs | -0.6% | EU and North America | Long term (≥ 4 years) |
| Source: Mordor Intelligence | |||
Service-price commoditization pressure
Automation and offshore scale have erased entry barriers for common help-desk and infrastructure tasks, compressing margins in traditional outsourcing. Clients increasingly demand outcome-based billing, compelling vendors to prove tangible business impact. Smaller rivals undercut pricing, which accelerates consolidation among incumbents able to cross-sell premium consulting and security offerings. The resulting shake-out is likely to realign the competitive order within the IT services market over the next two years.
Global talent shortage and attrition
Demand for AI engineers, cloud architects, and security analysts outstrips supply across major economies. Attrition spiked in 2024, forcing leading players to announce workforce realignments while chasing niche experts at premium salaries. Elevated wage inflation threatens profitability and slows project kickoff times, curbing near-term revenue realization. Vendors are ramping up reskilling programs and opening satellite delivery centers in tier-2 cities to tap untapped talent pools, yet structural shortages persist.
*Our forecasts treat driver/restraint impacts as directional, not additive. The impact forecasts reflect baseline growth, mix effects, and variable interactions.
IT Services Market Segment Analysis
By Service Type:
Security Services Drive Premium GrowthManaged Security Services is growing at a 12.18% CAGR, the steepest rate across the IT services market. Enterprises accept that specialized providers outperform internal teams in threat detection and incident response, prompting long-term outsourcing contracts that include continuous compliance monitoring. IT Outsourcing retains the largest 28.04% revenue position due to entrenched cost-optimization mandates. However, margin compression in commoditized workstreams is pushing vendors to package outsourcing with consulting to protect pricing. Cloud and Platform Services benefit from surging hybrid-cloud adoption; projects frequently bundle ERP modernization with data-integration layers, supporting cross-selling momentum.
Demand dynamics also favor Business Process Outsourcing, especially in finance, HR, and industry-specific back-office workflows where robotic process automation amplifies efficiency gains. IT Consulting revenues rise on complexity: organizations need guidance to harmonize AI, edge computing, and vertical clouds. Vendors that deliver reference architectures, accelerated migration toolkits, and domain-centric solutions increase wallet share across the IT services market.


By End-User Enterprise Size:
SMEs Accelerate Digital AdoptionSmall and Medium Enterprises register an 10.92% CAGR through 2031, reflecting democratized access to cloud-delivered ERP, CRM, and cybersecurity bundles. Consumption-based pricing allows SMEs to deploy capabilities historically reserved for large corporations, compressing deployment timelines from months to weeks. Compliance burdens in healthcare and financial services incentivize SMEs to engage external specialists rather than build in-house controls, expanding addressable revenue for managed-service partners.
Large Enterprises still command 69.42% revenue, underpinned by sprawling legacy estates that demand long-duration transformation roadmaps. Hybrid models blending internal centers of excellence with targeted external expertise prevail, securing high-value contracts for niche providers. Enterprise buyers increasingly list sustainability credentials and carbon-reporting readiness in RFPs, offering differentiation avenues for providers that track Scope-3 emissions across the IT services market.
By Deployment Model:
Nearshore Gains Strategic AdvantageOffshore Delivery leads with 47.55% revenue thanks to mature delivery ecosystems in India and the Philippines that enable labor arbitrage without compromising quality. Yet Nearshore Delivery posts a faster 10.18% CAGR as enterprises weigh geopolitical risk, time-zone overlap, and data-sovereignty constraints. Latin America and Eastern Europe see expanding captive centers and vendor investments aimed at de-risking concentrated supply chains.
Onshore Delivery, while costlier, retains relevance for projects demanding strict regulatory adherence or classified data handling. Government agencies and highly regulated industries favor domestically located personnel cleared under local regulations. Vendors that maintain balanced global-nearshore-onshore footprints offer flexible resourcing models, strengthening competitiveness across the IT services market.
By End-User Vertical:
Healthcare Leads Digital TransformationHealthcare and Life-Sciences accelerate at an 11.02% CAGR, fastest among verticals, as providers digitize electronic health records, tele-health, and diagnostics analytics. Regulatory mandates on data interoperability and patient privacy generate continuous demand for integration and security consulting. BFSI holds a 24.38% share of the IT services market size owing to vast modernization budgets and stringent cyber-resilience rules.
Manufacturing invests in Industry 4.0 platforms connecting factory floors to analytics hubs, requiring specialized OT-IT convergence expertise. Retail focuses on real-time inventory visibility and personalized commerce journeys, while Telecom and Media seek 5G deployment support and content-delivery optimization. Energy and Utilities prioritize grid automation and sustainability reporting, creating a wide spectrum of opportunities for multi-disciplinary service vendors.
Geography Analysis
North America IT Services Market
North America represents 37.05% of 2025 revenue, steered by USD 2.7 trillion in enterprise tech spending and early-adopter behavior toward AI and cloud platforms. Federal mandates requiring AI governance boards have institutionalized demand for strategic advisory and implementation services. Canada advances digital-government programs and natural-resource automation, whereas Mexico’s nearshore proposition attracts U.S. firms seeking cultural affinity and IP protection.
APAC IT Services Market
Asia-Pacific records the highest 11.12% CAGR through 2031. China scales smart-city pilots and green-manufacturing upgrades, India leverages its delivery-hub heritage while expanding domestic demand, and ASEAN economies close infrastructure gaps to support cross-border e-commerce and fintech growth. Japan and South Korea funnel investments into advanced manufacturing and telecom, spurring niche consulting around 5G and edge computing. Australia and New Zealand, despite mature IT spend, continue prioritizing cybersecurity and cloud compliance in banking and government.
Europe IT Services Market
Europe allocates EUR 489.8 billion (USD 553.5 billion) to IT services in 2025, 45% of which funds cloud programs. Regulatory frameworks—GDPR, DORA, and NIS2—propel security and compliance spend, ensuring consistent engagement pipelines for qualified providers. Germany spearheads manufacturing digitization, the United Kingdom leads in financial services transformation, and France, Italy, and Spain scale cloud-ERP rollouts. Eastern Europe develops as both a nearshore delivery basin and a consumer of modernization services, strengthening ecosystem depth across the IT services market.

Regulatory Landscape
Regulation for IT services increasingly centers on auditable security, procurement transparency, and AI governance, which shapes vendor qualification and delivery obligations in public sector and regulated verticals. In the United States, OMB Memorandum M-26-10 (March 2026) reinforced transparency, accountability, and oversight for federal technology by elevating CIO review of IT and IT services contracting, while federal cloud procurement continues to rely on FedRAMP requirements that standardize authorization artifacts and limit agency-specific add-ons without documented need.
In Europe, GDPR, DORA, and NIS2 continue to support security and resilience-oriented engagements, and the EU AI Act entered into force on 1 August 2024 with a major tranche of obligations applying from 2 August 2026 for categories including transparency and high-risk AI controls. Country-level governance is also tightening around large IT investments. For example, Portugal established the State Simplification and Technology Network through Decree-Law 85/2026 (April 2026), introducing a prior authorization regime for certain IT investments exceeding EUR 2 million, including AI projects and sovereign cloud initiatives, which can extend procurement cycles and increase compliance documentation requirements for providers.
Value Chain Analysis
The IT services value chain starts with upstream inputs such as skilled talent (cloud, data, cybersecurity, and software engineering), standardized delivery frameworks, and enabling technology from hyperscalers and software vendors. It then moves into service design, consulting, implementation, integration, and ongoing managed operations. Delivery is commonly orchestrated through a global delivery model that distributes work across onshore, nearshore, and offshore centers, with governance layers (security, compliance, FinOps, and service management) acting as control points that affect cost, quality, and contract stickiness.
Downstream, providers package capabilities into vertical or process-led offerings and deliver through account teams, partner ecosystems, and embedded engineering models, before operating services under SLAs and outcome-based constructs. Recent M&A and capability buys show where value is being added in the chain. Accenture agreed in February 2025 to acquire Staufen AG to deepen operational excellence and supply-chain transformation advisory, while Capgemini advanced its business process services stack by agreeing to acquire WNS in July 2025 and later completing the deal, aligning IT services with AI-enabled intelligent operations and broader business workflow ownership.
Competitive Landscape
The IT services market exhibits moderate concentration, with leading players pursuing scale and vertical depth via acquisitions. Capgemini’s USD 3.3 billion purchase of WNS expanded process capabilities in key verticals, while Cognizant’s USD 1.3 billion Belcan takeover bolstered engineering services. IBM’s USD 6.4 billion HashiCorp deal fortified multi-cloud management offerings, underscoring infrastructure orchestration as a competitive battleground.
Technology fusion is the core differentiator: 55% of enterprises now maintain an AI governance board, and vendors that productize AI accelerators or compliance toolkits gain a big advantage.[4]IBM Corporation, “IBM Completes Acquisition of HashiCorp,” ibm.com White-space opportunities arise in quantum-readiness consulting, sustainability analytics, and automated regulatory reporting, domains where smaller specialists can outmaneuver generalists.
Pricing models evolve toward outcomes; clients demand commitments on efficiency gains or revenue lifts. Vendors build cross-functional squads mixing data scientists, industry SMEs, and change-management consultants to satisfy this pivot. Market share shifts will likely hinge on the agility with which providers retool delivery models, reskill talent, and monetize intellectual property across the IT services market.
IT Services Industry Leaders
Accenture plc
IBM (Technology & Consulting Services)
Tata Consultancy Services Ltd.
Cognizant Technology Solutions Corp.
Capgemini SE
- *Disclaimer: Major Players sorted in no particular order
IT Services Market Companies Covered in this Report
- Accenture plc
- International Business Machines Corporation (IBM)
- Tata Consultancy Services Limited (TCS)
- Infosys Limited
- Cognizant Technology Solutions Corporation
- Capgemini SE
- Wipro Limited
- HCL Technologies Limited
- DXC Technology Company
- Atos SE
- Fujitsu Limited
- NTT DATA Corporation
- CGI Inc.
- L&T Technology Services Limited
- Tech Mahindra Limited
- EPAM Systems Inc.
- Endava plc
- Globant S.A.
- Mindtree Limited
- Sopra Steria Group SA
- Rackspace Technology Inc.
- Virtusa Corporation
- Persistent Systems Limited
- UST Global Inc.

Market Opportunities and Future Outlook
One key opportunity sits at the intersection of AI adoption and compliance-by-design, where buyers need implementable controls rather than strategy decks. The EU AI Act timeline, with key obligations applying from 2 August 2026, supports demand for service partners that can operationalize governance into platform engineering, including audit-ready observability, policy-as-code, and traceable model and data controls, particularly for regulated buyers in BFSI and healthcare where cyber-resilience and privacy requirements already influence sourcing.
A second whitespace area is sovereign and localized AI infrastructure services that combine data center capacity, managed platforms, and integration into enterprise workflows under local data-control constraints. Provider moves in 2026 also reflect this pull. HCLTech disclosed an initial INR 3,500 crore investment to build full-stack sovereign AI infrastructure (data centers, compute, models, software, and managed services), while SK Telecom announced an AI data center buildout program targeting large-scale capacity (15 GW total ambition). Together, these developments point to demand for IT services firms that can integrate cloud, security, and managed operations around AI workloads while meeting tightening procurement and transparency requirements in public sector buying.
Recent Industry Developments in IT Services Market
- July 2026: Cognizant expanded its partnership with Google Cloud to accelerate enterprise AI adoption using Gemini Enterprise and Google Workspace. The move strengthens Cognizant's packaged delivery for AI-enabled modernization programs and ties consulting, implementation, and managed services to a major hyperscaler ecosystem.
- June 2026: Cognizant completed the acquisition of Astreya, adding AI-first managed services and infrastructure operations capabilities. The deal broadens Cognizant's ability to run hybrid environments at scale and supports bundled offerings that combine modernization with ongoing managed operations.
- November 2024: IBM completed its acquisition of HashiCorp for USD 6.4 billion, expanding automation and infrastructure provisioning capabilities used in hybrid and multi-cloud environments. Bringing infrastructure orchestration deeper into IBM's stack supports larger transformation engagements and managed services contracts where governance and repeatable deployment patterns are central.


IT Services Market Report Scope and Research Methodology
Market Definition and Coverage
This market is defined as third party revenues earned from delivering IT services to organizations, including consulting, systems integration, application development and maintenance, infrastructure and network services, managed services, and outsourcing, whether delivered on-site or remotely.
Scope exclusions: we exclude pure hardware product sales, packaged software license sales, and telecom connectivity revenues when they are not bundled and billed as an IT service.
Segments Covered in This Report
- By Service Type
- IT Consulting and Implementation
- IT Outsourcing (ITO)
- Business Process Outsourcing (BPO)
- Managed Security Services
- Cloud and Platform Services
- By End-User Enterprise Size
- Small and Medium Enterprises (SMEs)
- Large Enterprises
- By Deployment Model
- Onshore Delivery
- Nearshore Delivery
- Offshore Delivery
- By End-user Vertical
- BFSI
- Manufacturing
- Government and Public Sector
- Healthcare and Life-Sciences
- Retail and Consumer Goods
- Telecom and Media
- Logistics and Transport
- Energy and Utilities
- Other End-user Verticals
- By Geography
- North America
- United States
- Canada
- Mexico
- South America
- Brazil
- Argentina
- Rest of South America
- Europe
- Germany
- United Kingdom
- France
- Italy
- Spain
- Russia
- Rest of Europe
- Asia-Pacific
- China
- India
- Japan
- South Korea
- ASEAN
- Australia and New Zealand
- Rest of Asia-Pacific
- Middle East and Africa
- Middle East
- Saudi Arabia
- United Arab Emirates
- Turkey
- Rest of Middle East
- Africa
- South Africa
- Nigeria
- Egypt
- Rest of Africa
- Middle East
- North America
Data Sources, Market Sizing, and Validation
Desk Research
Desk work starts with public spending and demand signals that anchor the size of the service economy for IT. We typically refer to sources such as the World Bank and IMF for macro baselines, OECD digital economy indicators, and US Bureau of Economic Analysis plus Eurostat services output series to understand how business services are trending over time.
To translate the demand backdrop into an IT-services specific view, we also review materials such as SEC filings, annual reports, and investor presentations of large service providers, along with releases from industry bodies such as ISO/IEC committees and national ICT associations. In parallel, a paid subscription is used for company financials and news screening, and a patent database is used to sanity-check technology shifts that influence service mix and pricing. These sources are illustrative, and many other public and paid references were used for data collection, validation, and clarification.
Primary Interviews and Surveys
Primary work is used to confirm what buyers are really purchasing within IT services, how pricing is moving, and which service lines are being bundled together in large contracts. We interview a mix of service providers, channel partners, and enterprise buyers across APAC, EMEA, and the Americas so that regional delivery models, renewal cycles, and outsourcing intensity are reflected in the final assumptions.
Distribution of primary research fieldwork respondents
| Company type | Respondent position | Region |
|---|---|---|
| Top tier: 35% | CXOs: 12% | APAC: 49% |
| Mid tier: 48% | Functional/Unit leaders: 36% | EMEA: 31% |
| Smaller Players: 17% | Managers: 52% | Americas: 20% |
Market-Sizing & Forecasting
Our sizing model starts with a top-down demand pool build using published IT spending patterns, services output indicators, and enterprise digitization intensity by region. We then split the totals into IT service revenue categories using mix cues from filings and interviews. After that, we apply selective bottom-up checks using sampled provider revenue roll-ups, deal size ranges, and simple volume times average price logic for common service contracts, which helps adjust for underreported pockets.
A few inputs that matter in IT services are cloud migration and managed services penetration, outsourcing share by industry, wage inflation for delivery talent, utilization and billing rate trends, and the pace of cybersecurity and application modernization programs. When gaps show up, they are handled through proxy ratios taken from similar regions or verticals, and then confirmed with experts who see contract renewals and new program launches. For forecasting, we use scenario analysis supported by a small multivariate regression set using macro indicators and enterprise IT budget expectations. The final trajectory is aligned to what interviewees expect for pricing resets and scope expansion over the next contract cycles.
Data Validation & Update Cycle
Each major input is cross-checked against an independent signal so that one data series does not drive the entire outcome. Outliers are reviewed at the region and service-line level, and then questioned again when the implied growth rate does not match known triggers such as hiring trends, large contract awards, or public IT spending guidance.
Before sign-off, the model is reviewed in multiple steps, including internal peer review of assumptions and math checks on unit economics. Reports are refreshed annually, and interim updates are made when material events shift demand, pricing, or delivery capacity. Right before delivery, an analyst performs a fresh pass on key variables so clients receive the latest updated view.
Mordor Intelligence's IT Services Market Size Compared Against Other Published Estimates
Published market values for IT services can differ even when the topic looks the same, because the included revenue lines are not always consistent and the base year can shift by one or two years. Differences also come from how providers treat bundled deals, how they convert currencies for multi-region contracts, and how often the estimates are refreshed.
Hardware product reselling that is not billed as a service sits outside Mordor Intelligence's scope, which is one reason our 2026 value can look lower than estimates that mix product pass-through into services revenue. Another common gap driver is the handling of cloud and platform work, where some sources count broader digital spend instead of only service revenue recognized by providers, and then apply more aggressive price uplift assumptions without re-checking renewal clauses.
Benchmark comparison
| Source | Market Size | Gaps in Research Methodology |
|---|---|---|
| Mordor Intelligence | USD 1.65 T (2026) | |
| Global Consultancy A | USD 1.65 T (2025) | Uses a different base year and may capture a wider set of digitally delivered work under IT services, which can shift service mix and inflate the comparable total when currency timing is not aligned. |
| Industry Publisher B | USD 1.61 T (2025) | Reports one year earlier and can differ on what counts as services revenue in bundled outsourcing contracts, especially when pass-through items and managed service add-ons are not separated clearly. |
The spread in the table is mostly explained by year alignment and what gets counted as services revenue versus adjacent IT spend. By keeping the inputs tied to repeatable signals like enterprise budgets, provider revenue recognition, and contract pricing behavior, the final number remains transparent and easier to reconcile across regions and service types.


Key Questions Answered in the Report
How large is the IT services market in 2026?
The IT services market size is valued at USD 1.65 trillion in 2026, with a projected 8.78% CAGR to 2031.
Which service type is expanding fastest?
Managed Security Services posts the highest 12.18% CAGR as enterprises outsource cyber-resilience.
What region shows the strongest growth?
Asia-Pacific leads with an 11.12% CAGR through 2031, driven by rapid digitization and government tech investment.
How are SMEs influencing demand?
SMEs grow at an 10.92% CAGR by adopting subscription-based cloud and security services that lower entry barriers.
What is driving nearshore delivery adoption?
Enterprises seek time-zone alignment, data-sovereignty compliance, and geopolitical risk mitigation, pushing nearshore models to a 10.18% CAGR.
Why is AI governance important to buyers?
Over 55% of large firms have AI governance boards, making advisory on compliance, ethics, and risk essential in service proposals.
Page last updated on:


