| Study Period | 2018 - 2030 |
| Base Year For Estimation | 2024 |
| Forecast Data Period | 2025 - 2030 |
| Market Volume (2025) | 286.1 MW |
| Market Volume (2030) | 376 MW |
| CAGR | 5.62 % |
| Market Concentration | Low |
Major Players*Disclaimer: Major Players sorted in no particular order |

Israel Data Center Market Analysis
The Israel Data Center Market size is estimated at 286.1 MW in 2025, and is expected to reach 376 MW by 2030, growing at a CAGR of 5.62%. Further, the market is expected to generate colocation revenue of USD 219 Million in 2025 and is projected to reach USD 354.1 Million by 2030, growing at a CAGR of 10.08% during the forecast period (2025-2030).
Israel's data center market is experiencing robust growth driven by its thriving startup ecosystem and technological innovation hub status. The country hosts approximately 625,267 businesses, with an impressive 99.5% being SMEs, creating a strong foundation for digital infrastructure demand. This entrepreneurial landscape has particularly flourished in the cloud data center sector, with Israel boasting 8.4 cloud computing startups per million people, significantly outpacing other developed nations like the United States. The government's active role in promoting technological advancement is evident through initiatives like the Israel Innovation Authority's support programs, which operate with an annual budget of approximately USD 400 million.
The market is witnessing significant infrastructure developments and strategic investments from global technology leaders. In March 2023, Amazon made a notable investment in Israeli supply chain analytics startup Flymingo, demonstrating continued confidence in the region's technological capabilities. Digital Realty's planned campus development in Tel Aviv and Google's activation of its local cloud region for Israel in October 2022 further underscore the market's strategic importance. These developments are complemented by robust fiber connectivity infrastructure, with over 1.5 million families now having access to fiber optic networks.
The data center infrastructure in Israel is characterized by high-tier facilities and advanced technological capabilities. Tier 3 facilities dominate the market, accounting for 75.4 MW of data center capacity, while the absence of Tier 1 and 2 facilities reflects the market's advanced maturity and focus on high-reliability infrastructure. The market has achieved significant progress in infrastructure deployment, with 95% of Israel's households having their deployment commitments met, creating a strong foundation for future data center expansions.
The market is experiencing a transformation in its service delivery model, particularly in the financial and government sectors. The implementation of advanced technologies like blockchain for government bonds and the growing adoption of cloud-based services by public entities demonstrate the market's evolution. Major cloud service providers are establishing dedicated facilities to serve government ministries and public entities, indicating a shift towards more sophisticated and secure data center solutions. This transformation is supported by strategic partnerships between local and international players, creating a robust ecosystem for future data center growth.
Israel Data Center Market Trends
Growing number of smartphone users, digitalization of different services, and increasing digital payments across the country boosts the market growth
- The total data traffic per smartphone was 5.2 GB in 2022. It is expected to reach 32 GB in 2029, registering a CAGR of 29.64% during the forecast period.
- Several end users witnessed an increase in mobile phones, which contributed to data traffic. For instance, the BFSI sector observed companies like Apple Pay and Google Pay entering the market in 2021. About two-thirds of Israel's terminals are capable of accepting wireless payments through such modes.
- The growth can be observed through the significant subscriber penetration of 74% in 2021, which is expected to reach 78% by 2025. This indicates the user inclination and network density in Israel.
- Similarly, the digitalization of different services would generate increased demands for data processing as data traffic increases. The e-commerce sector accounts for a penetration rate of 47% in Israel, which is expected to grow by 25% by 2025.

Understand The Key Trends Shaping This Market
Download PDF
Increasing number of digital consumers boost the data center demand in country
- The total number of smartphone users was 7.1 million in 2022.
- It is expected to reach 8.4 million by 2029, registering a CAGR of 2.31% during the forecast period.
- About 71% of the Israeli population had mobile internet subscriptions in 2021. However, 28% did not use it, and 1% did not have access to a subscription.
- Smartphone usage in Israel was evident, with a prominent smartphone adoption rate of 84% in 2021, compared to a projected rate of 87% by 2025. This signifies growth potential, requiring an efficient network to facilitate device and service adoption.
- With a strong number of 455 million mobile subscribers expected in 2025 in Israel, the number of smartphone users would force telecom service providers to opt for better and faster data center facilities to cope with the increasing performance demand in Israel.

OTHER KEY INDUSTRY TRENDS COVERED IN THE REPORT
- The increasing investments for the expansion of 5G network by Operators drives the growth of the market
- The increasing investments in fiber infrastructre improvements across the nation drives the market growth
- The increasing fiber infrastructre across the country drives the market growth
Segment Analysis: By Hotspot
Rest of Israel Segment in Israel Data Center Market
The Rest of Israel segment dominates the Israel data center market, accounting for approximately 63% of the total IT load capacity in 2024. This segment encompasses multiple Israeli cities that are making significant financial contributions to the data center industry, driven by high social media and internet usage patterns. The segment's growth is supported by improved inland connectivity and the introduction of 5G services across various locations. The segment demonstrates robust growth potential with a projected growth rate of nearly 11% from 2024 to 2029, making it the fastest-growing segment in the market. The Israeli government's investment in various 5G projects across these regions, coupled with the development of smart infrastructure initiatives, continues to drive the expansion of data center facilities in these areas.
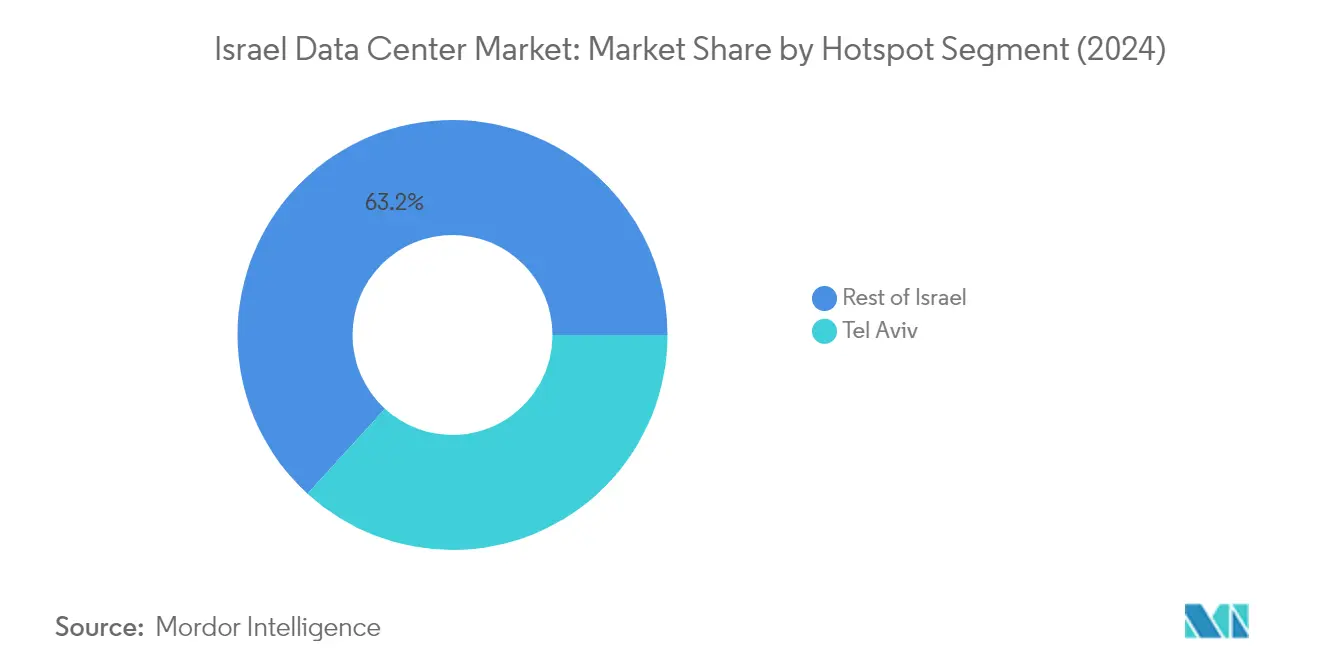
Tel Aviv Segment in Israel Data Center Market
Tel Aviv represents a significant hub in Israel's data center market, holding approximately 37% of the market share in 2024. The region's prominence is attributed to its status as a major technological hub, with its strategic proximity to crucial government facilities, power resources, and technological advancements required for empowering and operating data centers. The segment benefits from the presence of numerous client companies in and around Tel Aviv, leveraging faster internet connectivity through the facilities. The area's growth is further supported by efficient disaster management services, which are essential for the uninterrupted functionality of data center facilities. Additionally, Tel Aviv's position is strengthened by its role in hosting several homegrown startups and international cloud service providers.
Segment Analysis: By Data Center Size
Large Segment in Israel Data Center Market
The large data center segment dominates the Israeli data center market, accounting for approximately 67% of the total IT load capacity in 2024. With eight data center facilities identified as large data centers, this segment commands a significant presence in the market with a combined IT load capacity of around 116 MW. These facilities are strategically concentrated in various regions of Israel, with the rest of Israel holding about 69% market share, followed by the Tel Aviv region at 12%. The segment's dominance is further strengthened by key players like MedOne, which maintains a substantial market presence through its facilities distributed across the country.
Massive Segment in Israel Data Center Market
The massive segment is emerging as the most dynamic growth sector in the Israeli data center market, projected to grow at approximately 12% CAGR from 2024 to 2029. This remarkable growth trajectory is driven by increasing technological advancement and ever-growing data transfer requirements. Digital Realty's planned campus development in Tel Aviv, through a joint venture with Mivne Real Estate, exemplifies this growth with plans for a 20 MW facility in Petah Tikvah. The segment's expansion is further supported by the rising demand for larger facilities to accommodate cloud computing and advanced technological requirements in Israel.
Remaining Segments in Data Center Size Market
The medium and small segments, along with the emerging mega segment, complete the Israeli data center size market landscape. The medium segment maintains a significant presence with nine facilities distributed between Tel Aviv and the rest of Israel, all maintaining Tier 3 certification standards. The small segment continues to serve specific niche requirements, particularly in Tel Aviv, while the mega segment is positioned to emerge as a significant player with planned facilities designed to cater to the increasing demand for hyperscale facilities. These segments collectively provide a diverse range of options to meet varying customer requirements and technological needs in the Israeli market.
Segment Analysis: By Tier Type
Tier 4 Segment in Israel Data Center Market
Tier 4 data centers have emerged as the dominant segment in Israel's data center market, commanding approximately 51% of the total IT load capacity in 2024. These facilities demonstrate superior reliability and performance capabilities, with major players like MedOne and 3Samnet operating Tier 4 certified facilities across various hotspots in the country. The segment's prominence is driven by the increasing demand for maximum uptime and fault-tolerant infrastructure, particularly from sectors requiring mission-critical operations. These facilities offer advanced security measures, redundant power systems, and cooling infrastructure, making them particularly attractive for enterprises requiring the highest levels of data center reliability and performance.
Tier 3 Segment in Israel Data Center Market
The Tier 3 segment is experiencing remarkable growth in the Israeli data center market, with projections indicating an expansion rate of approximately 12% during 2024-2029. This growth is primarily driven by the increasing demand for higher redundancy rates and the segment's ability to offer a balanced combination of reliability and cost-effectiveness. Major service providers are actively introducing more Tier 3 facilities to meet the growing demand from various sectors, including cloud service providers, telecommunications companies, and government agencies. The segment's growth is further supported by its ability to maintain concurrent maintainability while offering substantial uptime guarantees, making it an attractive option for businesses requiring robust data center infrastructure without the premium costs associated with Tier 4 facilities.
Segment Analysis: By Absorption
Israel Data Center Industry Overview
Top Companies in Israel Data Center Market
The Israel data center market features established players like MedOne, Bezeq International, EdgeConneX, and Bynet Data Communications leading the competitive landscape. These companies are actively pursuing product innovation through advanced infrastructure development, including underground facilities with high survival levels and enhanced data center security features. Operational agility is demonstrated through the implementation of smart data center management systems and remote monitoring capabilities, allowing for real-time optimization of data center operations. Strategic moves in the market are characterized by partnerships with global cloud providers and telecommunications companies to enhance connectivity offerings. Market leaders are focusing on expansion through both greenfield developments and acquisitions, particularly in key locations like Tel Aviv, Herzliya, and Petah Tikva, while also investing in sustainable technologies and renewable energy solutions to meet growing environmental concerns.
Local Specialists Dominate Israeli Data Centers
The Israeli data center market exhibits a unique characteristic where local specialists maintain a strong foothold despite the presence of global players. These local companies leverage their deep understanding of regional requirements, particularly in areas of security and compliance with Israeli regulations. The market shows moderate consolidation, with the top players controlling significant market share while maintaining distinct competitive advantages through specialized service offerings and strategic locations. The presence of both established telecommunications companies and dedicated data center operators creates a diverse competitive landscape.
The market has witnessed notable merger and acquisition activities, particularly with international investors and infrastructure funds showing increased interest in Israeli data center assets. These transactions are driven by the strategic importance of Israel as a technology hub and the growing demand for digital infrastructure. The entry of global players through acquisitions of local operators demonstrates the market's attractiveness and the value placed on established local expertise and customer relationships.
Innovation and Security Drive Market Success
For incumbent players to maintain and expand their market share, focus on technological innovation and security capabilities is crucial. Companies must invest in advanced cooling systems, power management solutions, and enhanced data center security features to meet the demanding requirements of Israel's technology sector. The development of specialized data center solutions for key industries such as finance, government, and defense sectors, while maintaining high compliance standards, remains essential for market leadership. Building strong relationships with global cloud providers and offering hybrid solutions will be increasingly important for long-term success.
New entrants and contenders in the market need to differentiate themselves through specialized service offerings and strategic location selection. Success factors include developing niche market segments, offering flexible colocation options, and implementing advanced sustainability measures. The regulatory environment, particularly regarding data protection and security requirements, continues to shape market dynamics and entry barriers. Companies must also consider the concentration of end-users in specific geographic areas and industries while planning their market approach, as well as the increasing demand for edge computing solutions near major business centers.
Israel Data Center Market Leaders
-
3SAMNET
-
Bynet Data Communications Ltd
-
HQserv
-
Lian Group
-
ServerFarm LLC
- *Disclaimer: Major Players sorted in no particular order

Need More Details on Market Players and Competiters?
Download PDF
Israel Data Center Market News
- July 2022: Berkshire Partners announced to pay more than USD 215 million to acquire a 49% stake in MedOne. The company was evaluated at ILS 1.5 billion (USD 430 million).
- August 2021: EdgeConneX announced its agreement to acquire Global Data Center (GDC), an Israeli data center operator based in the Herzliya district. Once completed, the acquisition would bring two new facilities into the EdgeConneX global data center platform, including GDC's highly secure underground facilities in Herzliya and Petah Tikva, near Tel Aviv.
- August 2020: Bynet Data Communications was building an underground data center for Oracle Corporation in Jerusalem, Israel. The facility was a 14,000 sq. m (460,000 sq. ft) bunker located below five parking levels and a 17-story building in the city's Har Hotzvim tech hub. The data center is expected to extend over four floors at 50 meters (160 feet) below ground level.
Free With This Report
We provide a complimentary and exhaustive set of data points on the country and regional level metrics that present the fundamental structure of the industry. Presented in the form of 50+ free charts, the sections cover difficult to find data on various countries on smartphone users, data traffic per smartphone, mobile and broadband data speed, fiber connectivity network, and submarine cables.


Israel Data Center Market Report - Table of Contents
1. EXECUTIVE SUMMARY & KEY FINDINGS
2. REPORT OFFERS
3. INTRODUCTION
- 3.1 Study Assumptions & Market Definition
- 3.2 Scope of the Study
- 3.3 Research Methodology
4. MARKET OUTLOOK
- 4.1 It Load Capacity
- 4.2 Raised Floor Space
- 4.3 Colocation Revenue
- 4.4 Installed Racks
- 4.5 Rack Space Utilization
- 4.6 Submarine Cable
5. Key Industry Trends
- 5.1 Smartphone Users
- 5.2 Data Traffic Per Smartphone
- 5.3 Mobile Data Speed
- 5.4 Broadband Data Speed
- 5.5 Fiber Connectivity Network
-
5.6 Regulatory Framework
- 5.6.1 Israel
- 5.7 Value Chain & Distribution Channel Analysis
6. MARKET SEGMENTATION (INCLUDES MARKET SIZE IN VOLUME, FORECASTS UP TO 2030 AND ANALYSIS OF GROWTH PROSPECTS)
-
6.1 Hotspot
- 6.1.1 Tel Aviv
- 6.1.2 Rest of Isreal
-
6.2 Data Center Size
- 6.2.1 Large
- 6.2.2 Massive
- 6.2.3 Medium
- 6.2.4 Mega
- 6.2.5 Small
-
6.3 Tier Type
- 6.3.1 Tier 3
- 6.3.2 Tier 4
-
6.4 Absorption
- 6.4.1 Non-Utilized
- 6.4.2 Utilized
- 6.4.2.1 By Colocation Type
- 6.4.2.1.1 Hyperscale
- 6.4.2.1.2 Retail
- 6.4.2.1.3 Wholesale
- 6.4.2.2 By End User
- 6.4.2.2.1 BFSI
- 6.4.2.2.2 Cloud
- 6.4.2.2.3 E-Commerce
- 6.4.2.2.4 Government
- 6.4.2.2.5 Manufacturing
- 6.4.2.2.6 Media & Entertainment
- 6.4.2.2.7 Telecom
- 6.4.2.2.8 Other End User
7. COMPETITIVE LANDSCAPE
- 7.1 Market Share Analysis
- 7.2 Company Landscape
-
7.3 Company Profiles (includes Global Level Overview, Market Level Overview, Core Business Segments, Financials, Headcount, Key Information, Market Rank, Market Share, Products and Services, and Analysis of Recent Developments).
- 7.3.1 3SAMNET
- 7.3.2 Adgar Investments and Development Ltd (Adgar Data Center)
- 7.3.3 Bezeq International General Partner Ltd
- 7.3.4 Bynet Data Communications Ltd
- 7.3.5 EdgeConneX Inc.
- 7.3.6 Global Technical Realty (GTR)
- 7.3.7 Global Technical Realty SARL
- 7.3.8 HQserv
- 7.3.9 Lian Group
- 7.3.10 Med 1 IC-1 (1999) Ltd
- 7.3.11 ServerFarm LLC
- 7.4 LIST OF COMPANIES STUDIED
8. KEY STRATEGIC QUESTIONS FOR DATA CENTER CEOS
9. APPENDIX
-
9.1 Global Overview
- 9.1.1 Overview
- 9.1.2 Porter’s Five Forces Framework
- 9.1.3 Global Value Chain Analysis
- 9.1.4 Global Market Size and DROs
- 9.2 Sources & References
- 9.3 List of Tables & Figures
- 9.4 Primary Insights
- 9.5 Data Pack
- 9.6 Glossary of Terms
You Can Purchase Parts Of This Report. Check Out Prices For Specific Sections
Get Price Break-up Now
List of Tables & Figures
- Figure 1:
- VOLUME OF IT LOAD CAPACITY, MW, ISRAEL, 2018 - 2030
- Figure 2:
- VOLUME OF RAISED FLOOR AREA, SQ.FT. ('000), ISRAEL, 2018 - 2030
- Figure 3:
- VALUE OF COLOCATION REVENUE, USD MILLION, ISRAEL, 2018 - 2030
- Figure 4:
- VOLUME OF INSTALLED RACKS, NUMBER, ISRAEL, 2018 - 2030
- Figure 5:
- RACK SPACE UTILIZATION, %, ISRAEL, 2018 - 2030
- Figure 6:
- COUNT OF SMARTPHONE USERS, IN MILLION, ISRAEL, 2018 - 2030
- Figure 7:
- DATA TRAFFIC PER SMARTPHONE, GB, ISRAEL, 2018 - 2030
- Figure 8:
- AVERAGE MOBILE DATA SPEED, MBPS, ISRAEL, 2018 - 2030
- Figure 9:
- AVERAGE BROADBAND SPEED, MBPS, ISRAEL, 2018 - 2030
- Figure 10:
- LENGTH OF FIBER CONNECTIVITY NETWORK, KILOMETER, ISRAEL, 2018 - 2030
- Figure 11:
- VOLUME OF IT LOAD CAPACITY, MW, ISRAEL, 2018 - 2030
- Figure 12:
- VOLUME OF HOTSPOT, MW, ISRAEL, 2018 - 2030
- Figure 13:
- VOLUME SHARE OF HOTSPOT, %, ISRAEL, 2018 - 2030
- Figure 14:
- VOLUME SIZE OF TEL AVIV, MW, ISRAEL, 2018 - 2030
- Figure 15:
- VOLUME SHARE OF TEL AVIV, MW, HOTSPOT, %, ISRAEL, 2018 - 2030
- Figure 16:
- VOLUME SIZE OF REST OF ISREAL, MW, ISRAEL, 2018 - 2030
- Figure 17:
- VOLUME SHARE OF REST OF ISREAL, MW, HOTSPOT, %, ISRAEL, 2018 - 2030
- Figure 18:
- VOLUME OF DATA CENTER SIZE, MW, ISRAEL, 2018 - 2030
- Figure 19:
- VOLUME SHARE OF DATA CENTER SIZE, %, ISRAEL, 2018 - 2030
- Figure 20:
- VOLUME SIZE OF LARGE, MW, ISRAEL, 2018 - 2030
- Figure 21:
- VOLUME SIZE OF MASSIVE, MW, ISRAEL, 2018 - 2030
- Figure 22:
- VOLUME SIZE OF MEDIUM, MW, ISRAEL, 2018 - 2030
- Figure 23:
- VOLUME SIZE OF MEGA, MW, ISRAEL, 2018 - 2030
- Figure 24:
- VOLUME SIZE OF SMALL, MW, ISRAEL, 2018 - 2030
- Figure 25:
- VOLUME OF TIER TYPE, MW, ISRAEL, 2018 - 2030
- Figure 26:
- VOLUME SHARE OF TIER TYPE, %, ISRAEL, 2018 - 2030
- Figure 27:
- VOLUME SIZE OF TIER 3, MW, ISRAEL, 2018 - 2030
- Figure 28:
- VOLUME SIZE OF TIER 4, MW, ISRAEL, 2018 - 2030
- Figure 29:
- VOLUME OF ABSORPTION, MW, ISRAEL, 2018 - 2030
- Figure 30:
- VOLUME SHARE OF ABSORPTION, %, ISRAEL, 2018 - 2030
- Figure 31:
- VOLUME SIZE OF NON-UTILIZED, MW, ISRAEL, 2018 - 2030
- Figure 32:
- VOLUME OF COLOCATION TYPE, MW, ISRAEL, 2018 - 2030
- Figure 33:
- VOLUME SHARE OF COLOCATION TYPE, %, ISRAEL, 2018 - 2030
- Figure 34:
- VOLUME SIZE OF HYPERSCALE, MW, ISRAEL, 2018 - 2030
- Figure 35:
- VOLUME SIZE OF RETAIL, MW, ISRAEL, 2018 - 2030
- Figure 36:
- VOLUME SIZE OF WHOLESALE, MW, ISRAEL, 2018 - 2030
- Figure 37:
- VOLUME OF END USER, MW, ISRAEL, 2018 - 2030
- Figure 38:
- VOLUME SHARE OF END USER, %, ISRAEL, 2018 - 2030
- Figure 39:
- VOLUME SIZE OF BFSI, MW, ISRAEL, 2018 - 2030
- Figure 40:
- VOLUME SIZE OF CLOUD, MW, ISRAEL, 2018 - 2030
- Figure 41:
- VOLUME SIZE OF E-COMMERCE, MW, ISRAEL, 2018 - 2030
- Figure 42:
- VOLUME SIZE OF GOVERNMENT, MW, ISRAEL, 2018 - 2030
- Figure 43:
- VOLUME SIZE OF MANUFACTURING, MW, ISRAEL, 2018 - 2030
- Figure 44:
- VOLUME SIZE OF MEDIA & ENTERTAINMENT, MW, ISRAEL, 2018 - 2030
- Figure 45:
- VOLUME SIZE OF TELECOM, MW, ISRAEL, 2018 - 2030
- Figure 46:
- VOLUME SIZE OF OTHER END USER, MW, ISRAEL, 2018 - 2030
- Figure 47:
- VOLUME SHARE OF MAJOR PLAYERS, %, ISRAEL
Israel Data Center Industry Segmentation
Tel Aviv are covered as segments by Hotspot. Large, Massive, Medium, Mega, Small are covered as segments by Data Center Size. Tier 3, Tier 4 are covered as segments by Tier Type. Non-Utilized, Utilized are covered as segments by Absorption.| Hotspot | Tel Aviv | |||
| Rest of Isreal | ||||
| Data Center Size | Large | |||
| Massive | ||||
| Medium | ||||
| Mega | ||||
| Small | ||||
| Tier Type | Tier 3 | |||
| Tier 4 | ||||
| Absorption | Non-Utilized | |||
| Utilized | By Colocation Type | Hyperscale | ||
| Retail | ||||
| Wholesale | ||||
| By End User | BFSI | |||
| Cloud | ||||
| E-Commerce | ||||
| Government | ||||
| Manufacturing | ||||
| Media & Entertainment | ||||
| Telecom | ||||
| Other End User | ||||
Need A Different Region or Segment?
Customize Now
Market Definition
- IT LOAD CAPACITY - The IT load capacity or installed capacity, refers to the amount of energy consumed by servers and network equipments placed in a rack installed. It is measured in megawatt (MW).
- ABSORPTION RATE - It denotes the extend to which the data center capacity has been leased out. For instance, a 100 MW DC has leased out 75 MW, then absorption rate would be 75%. It is also referred as utilization rate and leased-out capacity.
- RAISED FLOOR SPACE - It is an elevated space build over the floor. This gap between the original floor and the elevated floor is used to accommodate wiring, cooling, and other data center equipment. This arrangement assist in having proper wiring and cooling infrastructure. It is measured in square feet (ft^2).
- DATA CENTER SIZE - Data Center Size is segmented based on the raised floor space allocated to the data center facilities. Mega DC - # of Racks must be more than 9000 or RFS (raised floor space) must be more than 225001 Sq. ft; Massive DC - # of Racks must be in between 9000 and 3001 or RFS must be in between 225000 Sq. ft and 75001 Sq. ft; Large DC - # of Racks must be in between 3000 and 801 or RFS must be in between 75000 Sq. ft and 20001 Sq. ft; Medium DC # of Racks must be in between 800 and 201 or RFS must be in between 20000 Sq. ft and 5001 Sq. ft; Small DC - # of Racks must be less than 200 or RFS must be less than 5000 Sq. ft.
- TIER TYPE - According to Uptime Institute the data centers are classified into four tiers based on the proficiencies of redundant equipment of the data center infrastructure. In this segment the data center are segmented as Tier 1,Tier 2, Tier 3 and Tier 4.
- COLOCATION TYPE - The segment is segregated into 3 categories namely Retail, Wholesale and Hyperscale Colocation service. The categorization is done based on the amount of IT load leased out to potential customers. Retail colocation service has leased capacity less than 250 kW; Wholesale colocation services has leased capacity between 251 kW and 4 MW and Hyperscale colocation services has leased capacity more than 4 MW.
- END CONSUMERS - The Data Center Market operates on a B2B basis. BFSI, Government, Cloud Operators, Media and Entertainment, E-Commerce, Telecom and Manufacturing are the major end-consumers in the market studied. The scope only includes colocation service operators catering to the increasing digitalization of the end-user industries.
| Keyword | Definition |
|---|---|
| Rack Unit | Generally referred as U or RU, it is the unit of measurement for the server unit housed in the racks in the data center. 1U is equal to 1.75 inches. |
| Rack Density | It defines the amount of power consumed by the equipment and server housed in a rack. It is measured in kilowatt (kW). This factor plays a critical role in data center design and, cooling and power planning. |
| IT Load Capacity | The IT load capacity or installed capacity, refers to the amount of energy consumed by servers and network equipment placed in a rack installed. It is measured in megawatt (MW). |
| Absorption Rate | It denotes how much of the data center capacity has been leased out. For instance, if a 100 MW DC has leased out 75 MW, then the absorption rate would be 75%. It is also referred to as utilization rate and leased-out capacity. |
| Raised Floor Space | It is an elevated space built over the floor. This gap between the original floor and the elevated floor is used to accommodate wiring, cooling, and other data center equipment. This arrangement assists in having proper wiring and cooling infrastructure. It is measured in square feet/meter. |
| Computer Room Air Conditioner (CRAC) | It is a device used to monitor and maintain the temperature, air circulation, and humidity inside the server room in the data center. |
| Aisle | It is the open space between the rows of racks. This open space is critical for maintaining the optimal temperature (20-25 °C) in the server room. There are primarily two aisles inside the server room, a hot aisle and a cold aisle. |
| Cold Aisle | It is the aisle wherein the front of the rack faces the aisle. Here, chilled air is directed into the aisle so that it can enter the front of the racks and maintain the temperature. |
| Hot Aisle | It is the aisle where the back of the racks faces the aisle. Here, the heat dissipated from the equipment’s in the rack is directed to the outlet vent of the CRAC. |
| Critical Load | It includes the servers and other computer equipment whose uptime is critical for data center operation. |
| Power Usage Effectiveness (PUE) | It is a metric which defines the efficiency of a data center. It is calculated by: (𝑇𝑜𝑡𝑎𝑙 𝐷𝑎𝑡𝑎 𝐶𝑒𝑛𝑡𝑒𝑟 𝐸𝑛𝑒𝑟𝑔𝑦 𝐶𝑜𝑛𝑠𝑢𝑚𝑝𝑡𝑖𝑜𝑛)/(𝑇𝑜𝑡𝑎𝑙 𝐼𝑇 𝐸𝑞𝑢𝑖𝑝𝑚𝑒𝑛𝑡 𝐸𝑛𝑒𝑟𝑔𝑦 𝐶𝑜𝑛𝑠𝑢𝑚𝑝𝑡𝑖𝑜𝑛). Further, a data center with a PUE of 1.2-1.5 is considered highly efficient, whereas, a data center with a PUE >2 is considered highly inefficient. |
| Redundancy | It is defined as a system design wherein additional component (UPS, generators, CRAC) is added so that in case of power outage, equipment failure, the IT equipment should not be affected. |
| Uninterruptible Power Supply (UPS) | It is a device that is connected in series with the utility power supply, storing energy in batteries such that the supply from UPS is continuous to IT equipment even during utility power is snapped. The UPS primarily supports the IT equipment only. |
| Generators | Just like UPS, generators are placed in the data center to ensure an uninterrupted power supply, avoiding downtime. Data center facilities have diesel generators and commonly, 48-hour diesel is stored in the facility to prevent disruption. |
| N | It denotes the tools and equipment required for a data center to function at full load. Only "N" indicates that there is no backup to the equipment in the event of any failure. |
| N+1 | Referred to as 'Need plus one', it denotes the additional equipment setup available to avoid downtime in case of failure. A data center is considered N+1 when there is one additional unit for every 4 components. For instance, if a data center has 4 UPS systems, then for to achieve N+1, an additional UPS system would be required. |
| 2N | It refers to fully redundant design wherein two independent power distribution system is deployed. Therefore, in the event of a complete failure of one distribution system, the other system will still supply power to the data center. |
| In-Row Cooling | It is the cooling design system installed between racks in a row where it draws warm air from the hot aisle and supplies cool air to the cold aisle, thereby maintaining the temperature. |
| Tier 1 | Tier classification determines the preparedness of a data center facility to sustain data center operation. A data center is classified as Tier 1 data center when it has a non-redundant (N) power component (UPS, generators), cooling components, and power distribution system (from utility power grids). The Tier 1 data center has an uptime of 99.67% and an annual downtime of <28.8 hours. |
| Tier 2 | A data center is classified as Tier 2 data center when it has a redundant power and cooling components (N+1) and a single non-redundant distribution system. Redundant components include extra generators, UPS, chillers, heat rejection equipment, and fuel tanks. The Tier 2 data center has an uptime of 99.74% and an annual downtime of <22 hours. |
| Tier 3 | A data center having redundant power and cooling components and multiple power distribution systems is referred to as a Tier 3 data center. The facility is resistant to planned (facility maintenance) and unplanned (power outage, cooling failure) disruption. The Tier 3 data center has an uptime of 99.98% and an annual downtime of <1.6 hours. |
| Tier 4 | It is the most tolerant type of data center. A Tier 4 data center has multiple, independent redundant power and cooling components and multiple power distribution paths. All IT equipment are dual powered, making them fault tolerant in case of any disruption, thereby ensuring interrupted operation. The Tier 4 data center has an uptime of 99.74% and an annual downtime of <26.3 minutes. |
| Small Data Center | Data center that has floor space area of ≤ 5,000 Sq. ft or the number of racks that can be installed is ≤ 200 is classified as a small data center. |
| Medium Data Center | Data center which has floor space area between 5,001-20,000 Sq. ft, or the number of racks that can be installed is between 201-800, is classified as a medium data center. |
| Large Data Center | Data center which has floor space area between 20,001-75,000 Sq. ft, or the number of racks that can be installed is between 801-3,000, is classified as a large data center. |
| Massive Data Center | Data center which has floor space area between 75,001-225,000 Sq. ft, or the number of racks that can be installed is between 3001-9,000, is classified as a massive data center. |
| Mega Data Center | Data center that has a floor space area of ≥ 225,001 Sq. ft or the number of racks that can be installed is ≥ 9001 is classified as a mega data center. |
| Retail Colocation | It refers to those customers who have a capacity requirement of 250 kW or less. These services are majorly opted by small and medium enterprises (SMEs). |
| Wholesale Colocation | It refers to those customers who have a capacity requirement between 250 kW to 4 MW. These services are majorly opted by medium to large enterprises. |
| Hyperscale Colocation | It refers to those customers who have a capacity requirement greater than 4 MW. The hyperscale demand primarily originates from large-scale cloud players, IT companies, BFSI, and OTT players (like Netflix, Hulu, and HBO+). |
| Mobile Data Speed | It is the mobile internet speed a user experiences via their smartphones. This speed is primarily dependent on the carrier technology being used in the smartphone. The carrier technologies available in the market are 2G, 3G, 4G, and 5G, where 2G provides the slowest speed while 5G is the fastest. |
| Fiber Connectivity Network | It is a network of optical fiber cables deployed across the country, connecting rural and urban regions with high-speed internet connection. It is measured in kilometer (km). |
| Data Traffic per Smartphone | It is a measure of average data consumption by a smartphone user in a month. It is measured in gigabyte (GB). |
| Broadband Data Speed | It is the internet speed that is supplied over the fixed cable connection. Commonly, copper cable and optic fiber cable are used in both residential and commercial use. Here, optic cable fiber provides faster internet speed than copper cable. |
| Submarine Cable | A submarine cable is a fiber optic cable laid down at two or more landing points. Through this cable, communication and internet connectivity between countries across the globe is established. These cables can transmit 100-200 terabits per second (Tbps) from one point to another. |
| Carbon Footprint | It is the measure of carbon dioxide generated during the regular operation of a data center. Since, coal, and oil & gas are the primary source of power generation, consumption of this power contributes to carbon emissions. Data center operators are incorporating renewable energy sources to curb the carbon footprint emerging in their facilities. |
Need More Details on Market Definition?
Ask a Question
Research Methodology
Mordor Intelligence follows a four-step methodology in all our reports.
- Step-1: Identify Key Variables: In order to build a robust forecasting methodology, the variables and factors identified in Step-1 are tested against available historical market numbers. Through an iterative process, the variables required for market forecast are set and the model is built on the basis of these variables.
- Step-2: Build a Market Model: Market-size estimations for the forecast years are in nominal terms. Inflation is not a part of the pricing, and the average selling price (ASP) is kept constant throughout the forecast period for each country.
- Step-3: Validate and Finalize: In this important step, all market numbers, variables and analyst calls are validated through an extensive network of primary research experts from the market studied. The respondents are selected across levels and functions to generate a holistic picture of the market studied.
- Step-4: Research Outputs: Syndicated Reports, Custom Consulting Assignments, Databases & Subscription Platforms

Get More Details On Research Methodology
Download PDF


