
Isotonic Drinks Market Size and Share
Market Overview
| Study Period | 2021 - 2031 |
|---|---|
| Market Size (2026) | USD 18.05 Billion |
| Market Size (2031) | USD 22.83 Billion |
| Growth Rate (2026 - 2031) | 4.82 % |
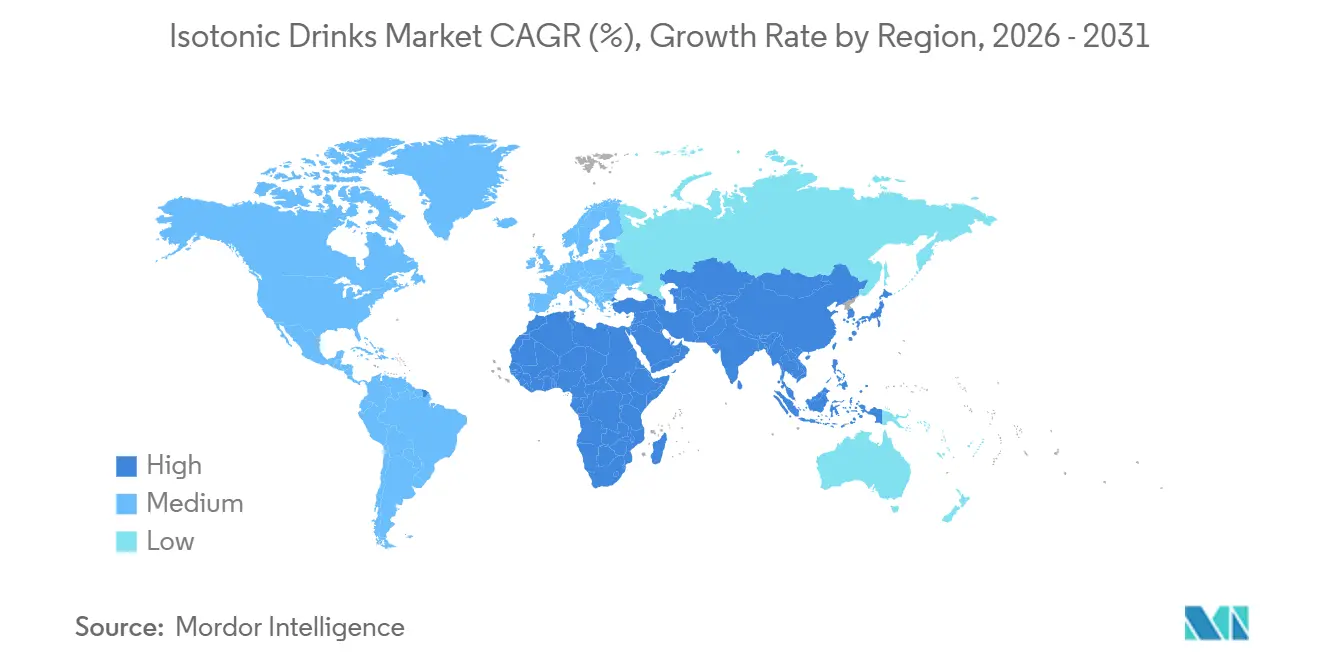
| Fastest Growing Market | Middle East and Africa |
| Largest Market | North America |
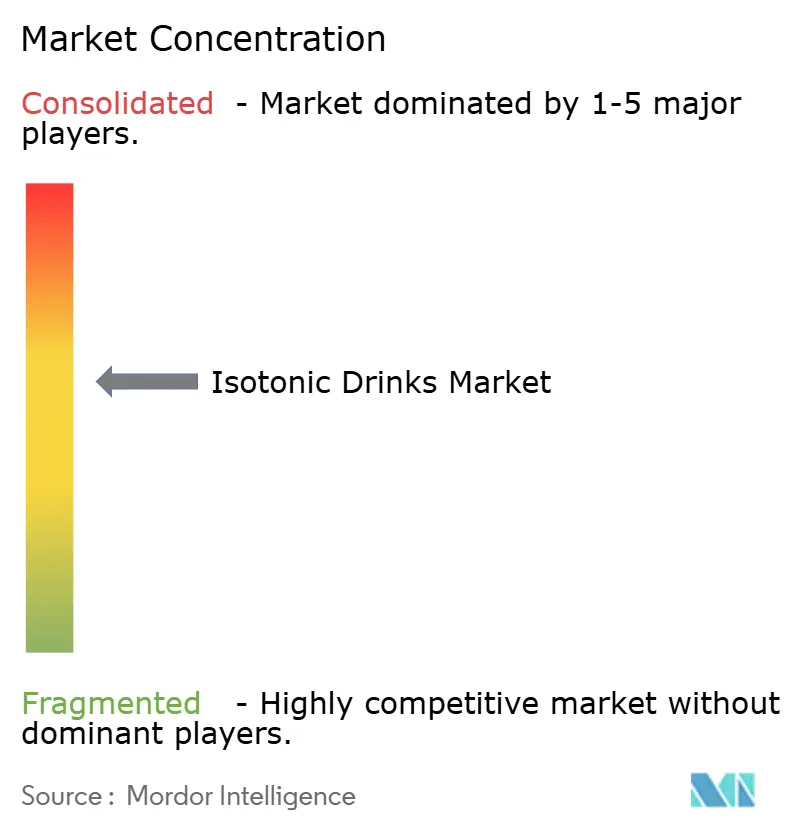
| Market Concentration | Medium |
Major Players *Disclaimer: Major Players sorted in no particular order Image © Mordor Intelligence. Reuse requires attribution under CC BY 4.0. | |
Isotonic Drinks Market Analysis by Mordor Intelligence
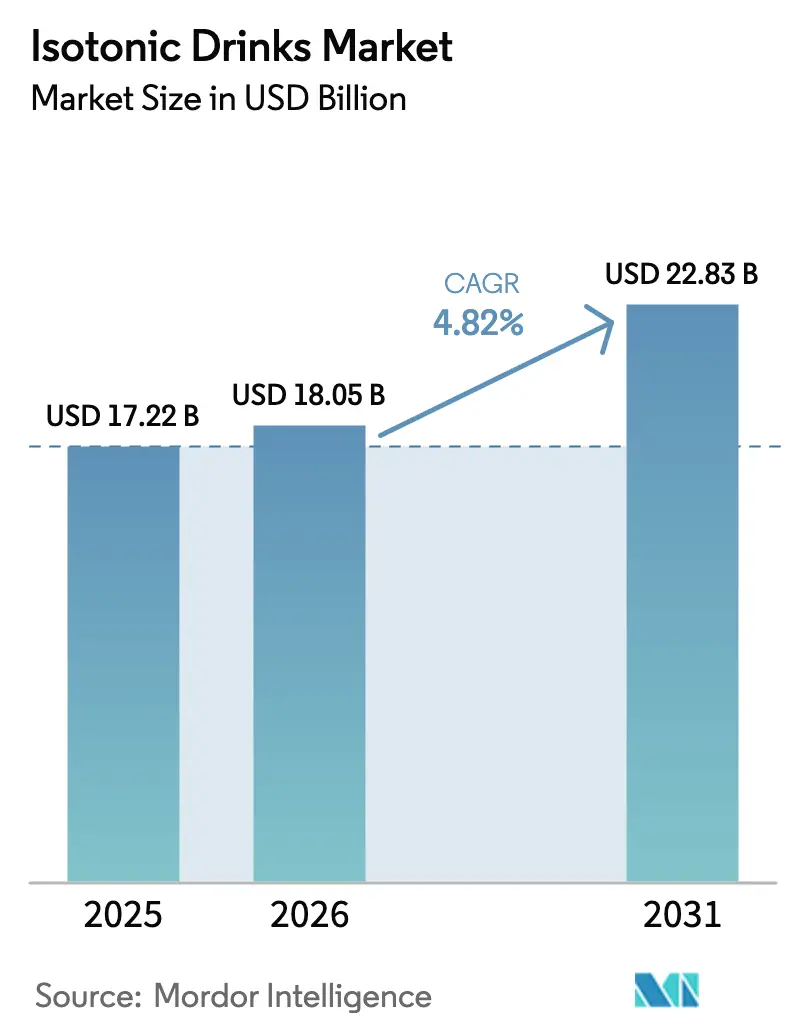
The Isotonic Drinks market size is expected to increase from USD 17.22 billion in 2025 to USD 18.05 billion in 2026 and reach USD 22.84 billion by 2031, growing at a 4.82% CAGR over 2026-2031. Casual fitness routines and a growing interest in electrolyte balance among non-athletes have shifted the primary use case of hydration from event-only replenishment to everyday consumption. While North America continues to set the standard for this category, the Middle East and Africa are witnessing the fastest expansion. This growth is fueled by state investments in stadiums, academies, and youth sports, all underscored by a pressing need for hydration in hot climates. Product development has evolved from mere flavor enhancements to a trend dubbed “functional stacking.” Here, electrolytes are combined with amino acids, adaptogens, or nootropics, allowing brands to command premium prices on shelves. The rise of online retail is propelling the isotonic drinks market forward. By bypassing traditional retail gatekeepers and leveraging influencer content alongside subscription models, brands are effectively securing repeat purchases. Additionally, consumer awareness of hydration's role in overall health is driving demand for innovative isotonic drink formulations.
Key Report Takeaways
- By product type, liquids held 70.32% of the isotonic drinks market share in 2025, while powders are projected to post a 5.19% CAGR through 2031.
- By packaging, bottles led with 58.74% in 2025, and pouches are forecast to grow at 5.90% CAGR through 2031.
- By distribution, supermarkets and hypermarkets captured 48.15% share in 2025, yet online retail is advancing at a 9.11% CAGR through 2031.
- By geography, North America accounted for 52.10% of revenue in 2025; the Middle East and Africa will register the fastest CAGR of 8.31% through 2031.
Note: Market size and forecast figures in this report are generated using Mordor Intelligence’s proprietary estimation framework, updated with the latest available data and insights as of 2026.
Market Trends and Insights
Drivers Impact Analysis of Isotonic Drinks Market*
| Driver | (~) % Impact on CAGR Forecast | Geographic Relevance | Impact Timeline |
|---|---|---|---|
| Rising participation in organized sports and fitness events | +0.9% | Global, with concentration in North America, Europe, and emerging Middle East markets | Medium term (2-4 years) |
| Aggressive athlete-centric marketing and sponsorship deals | +0.7% | North America and Europe, expanding to Asia-Pacific through cricket and football leagues | Short term (≤ 2 years) |
| Product innovation, flavor and functional diversification | +1.1% | Global, led by North America and Europe innovation hubs | Long term (≥ 4 years) |
| Expansion of RTD portfolios in convenience retail | +0.8% | North America, Europe, and urban Asia-Pacific corridors | Medium term (2-4 years) |
| Increasing consumer awareness of hydration and electrolyte balance | +0.9% | Global, with accelerated adoption in Middle East and Africa due to climate factors | Long term (≥ 4 years) |
| Micro-dosing sodium formulations for endurance athletes | +0.4% | North America and Europe endurance sports communities, niche Asia-Pacific segments | Long term (≥ 4 years) |
| Source: Mordor Intelligence | |||
Rising participation in organized sports and fitness events
Sign-ups for endurance races have not only rebounded but have surged past pre-pandemic levels, leading to significant spikes in purchases around marathons and triathlons. As hybrid gym-and-run cultures become the norm, sports beverages are gaining traction among semi-athletes, thereby expanding the market for isotonic drinks. The 2025 US Trends in Team Sports Report from the Sports and Fitness Industry Association (SFIA) highlights a significant 8.6% increase in team sports participation from 2023 to 2024[1]. Corporate wellness programs are now bulk purchasing isotonic products for employee events, solidifying demand beyond traditional retail channels. Youth leagues are incorporating electrolyte protocols into their coaching manuals, fostering a habit of lifelong use starting from adolescence. Gulf nations, channeling funds from Vision 2030, are investing in public fitness programs, leading to the establishment of new stadium kiosks that are set to feature isotonic products. Additionally, the growing awareness of hydration's role in athletic performance is further driving the adoption of isotonic beverages across various demographics.
Aggressive athlete-centric marketing and sponsorship deals
Brands, leveraging NIL rules, are signing on thousands of collegiate micro-influencers. This shift trades broad national advertisements for a more authentic, hyper-local touch, all while achieving a lower cost per engagement. Meanwhile, challenger labels are bypassing traditional TV routes. Instead, they're planting TikTok clips that transform locker-room kits into viral sensations, hastening the penetration of isotonic drinks among the Gen Z demographic. Fresh territories are becoming accessible as international league tours, like the NFL's fixtures in Germany, pave the way for cost-effective brand activations. A notable trend sees contracts increasingly compensating athletes with equity. This evolution not only turns these athletes into shareholder-marketers but also allows them to influence research and development cycles with their flavor feedback. Women's sports sponsorships, now highly valued for their engagement metrics, are adeptly channeling isotonic messaging to the rapidly expanding female fitness audience. These developments collectively highlight the dynamic strategies brands are employing to capture diverse consumer segments.
Product innovation, flavor and functional diversification
Brands are enhancing electrolytes with amino acids, adaptogens, and nootropics, allowing SKUs to command price premiums of 20-30% and driving up the market size of isotonic drinks per transaction. Micro-dosed sodium formulas, guided by sweat-rate wearables, are steering the category towards precision nutrition. To combat “sports-drink fatigue,” brands are introducing botanical and savory flavors, targeting older consumers who are mindful of their sugar intake. Powder sticks facilitate custom dilution and streamline logistics, appealing to eco-conscious shoppers who prioritize lighter packaging. Aseptic cartons with a long shelf life reduce refrigeration costs, comply with EU Extended Producer Responsibility regulations, and secure placements in discount chains. These innovations collectively contribute to the evolving dynamics of the isotonic drinks market. Additionally, the integration of advanced packaging technologies is expected to further enhance product appeal and market penetration.
Expansion of RTD portfolios in convenience retail
In 2025, the United States boasted 152,255 convenience stores, as reported by the National Association of Convenience Stores[2]. High-velocity convenience channels are increasingly favoring single-serve isotonic SKUs, which prioritize dollar margins. Isotonic drinks, often packaged in small bottles and pouches, are strategically placed at eye level in coolers, capitalizing on impulse purchases. Retailers, seeking exclusive flavors, are fragmenting their SKU lists. This strategy not only drives sell-outs due to perceived scarcity but also inflates profit margins. In Southeast Asia, the expansion of cold-chain logistics is overcoming challenges in ready-to-drink (RTD) beverages, diminishing the region's prior reliance on powdered drinks, especially in its tropical climates. Meanwhile, smart vending machines at gyms and campuses are bypassing traditional wholesale channels, significantly enhancing net revenues for direct-to-consumer brands making their mark in physical retail. These trends collectively highlight the evolving dynamics of the isotonic drinks market across different regions.
Restraints Impact Analysis of Isotonic Drinks Market*
| Restraint | (~) % Impact on CAGR Forecast | Geographic Relevance | Impact Timeline |
|---|---|---|---|
| Proliferation of flavored functional waters | -0.5% | Global, particularly North America and Europe where premium water segments are mature | Short term (≤ 2 years) |
| Stringent regulatory scrutiny and novel-ingredient approval timelines | -0.3% | North America (FDA), Europe (EFSA), with spillover to Asia-Pacific markets adopting similar frameworks | Long term (≥ 4 years) |
| Micro-plastic concerns in single-use PET bottles | -0.4% | Europe and North America leading regulatory action, emerging awareness in Asia-Pacific | Medium term (2-4 years) |
| Electrolyte over-consumption leading to health warnings | -0.2% | Global, with heightened scrutiny in markets promoting isotonic drinks for non-athletic use | Medium term (2-4 years) |
| Source: Mordor Intelligence | |||
Proliferation of flavored functional waters
Vitamin-fortified waters, offering isotonic benefits with reduced sugar content, attract casual users who don't need swift glycogen replenishment. Meanwhile, coconut water's natural electrolyte appeal strikes a chord with yoga enthusiasts wary of synthetic additives. As grocery sets evolve, high-demand functional waters frequently push aside isotonic SKUs, and the marketing of alkaline water muddles hydration categories, making it harder for shoppers to navigate and diminishing the share of isotonic products. Furthermore, subscription wellness boxes are now incorporating functional waters, seamlessly integrating them into daily routines and moving away from traditional sports-specific beverages. This shift highlights the growing consumer preference for versatile hydration solutions over niche sports drinks. Functional water brands are increasingly leveraging health-conscious marketing strategies to expand their consumer base.
Stringent regulatory scrutiny and novel-ingredient approval timelines
FDA's GRAS reviews can take up to two years, pushing back launches dependent on new electrolyte complexes. The EFSA's Novel Food approvals require comprehensive dossiers, leading to region-specific formulas that inflate production costs[3]. Front-of-pack sodium warnings curtail performance claims, nudging labels to adopt a more generic “refresh” terminology. Many smaller brands, short on capital for clinical trials, find their innovation pipelines in the isotonic drinks sector stymied. After Brexit, differing national regulations necessitate dual-label stock-keeping units, adding complexity to the European supply chain. Additionally, the rising demand for clean-label products is pressuring manufacturers to reformulate their offerings. This trend is further compounded by increasing consumer awareness of ingredient transparency and health benefits. The growing focus on sustainability is also driving companies to adopt eco-friendly packaging solutions. Furthermore, advancements in ingredient technology are enabling the development of more efficient and functional isotonic beverages.
*Our forecasts treat driver/restraint impacts as directional, not additive. The impact forecasts reflect baseline growth, mix effects, and variable interactions.
Isotonic Drinks Market Segment Analysis
By Product Type:
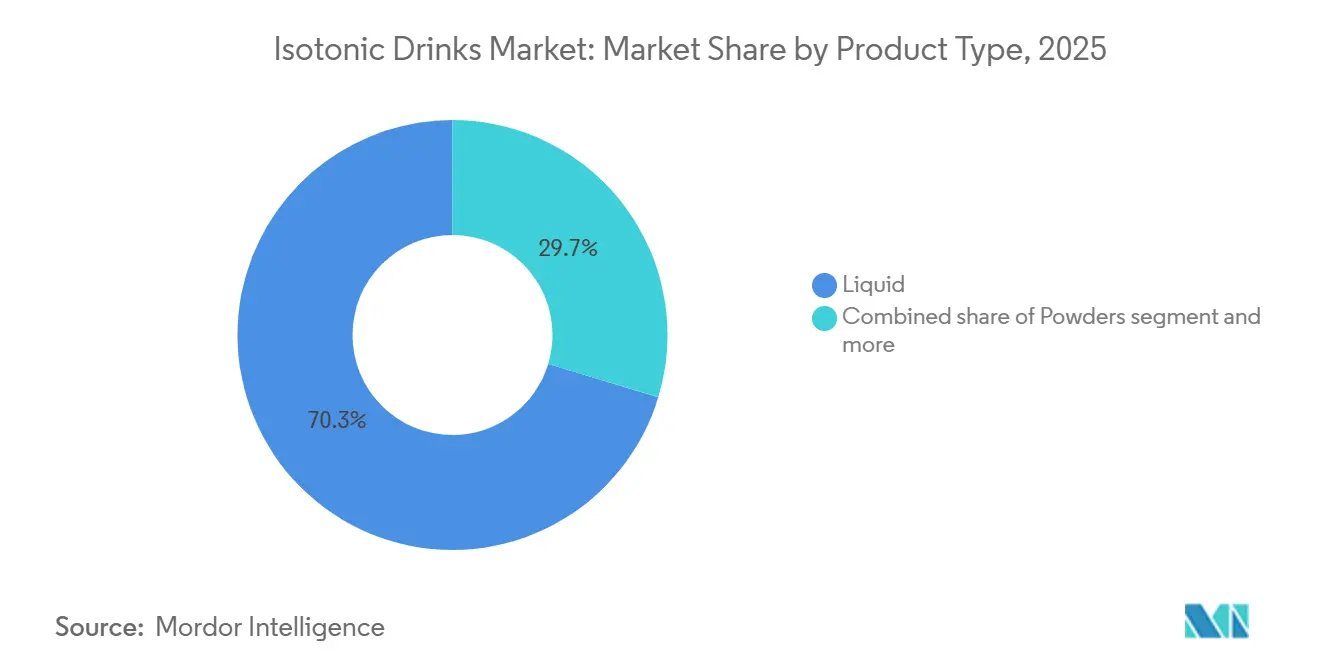
Powder Gains on Portability EconomicsIn 2025, liquids dominated the isotonic drinks market, capturing a robust 70.32% share. Their prominence is bolstered by strategic placements in impulse-driven venues like gym coolers, stadium kiosks, and convenience stores, where the allure of immediate consumption drives purchases. Major players, including Gatorade, fortify this segment with diverse portfolios, cultivating brand ecosystems and fostering consumer loyalty. Even as sustainability gains traction, liquid SKUs enjoy a pivotal edge in consistent availability and taste, propelling steady volume growth in mature markets. The convenience of ready-to-drink formats further strengthens their appeal among time-constrained consumers. Additionally, aggressive marketing campaigns and sponsorships in sports events continue to reinforce their visibility and market dominance.
Powders are emerging as the fastest-growing segment, projected to surge at a CAGR of 5.19% until 2031. This uptick is largely attributed to millennials gravitating towards budget-friendly, travel-optimized sticks and subscription models that champion refillable bottles and ensure consistent revenue streams. The reduced logistical footprint of powders resonates with corporate net-zero initiatives, amplifying their market allure. Additionally, the ready-to-mix nature allows users to tailor their drinks based on individual sweat rates or exercise intensity, infusing a touch of technical customization. The segment also benefits from increasing consumer awareness about reducing single-use plastics. Furthermore, advancements in flavor technology are helping brands address taste concerns, making powders more appealing to a broader audience.

By Packaging Type:
Sustainability Mandates Propel PouchesIn 2025, bottles led the isotonic drinks market, capturing 58.74% of the total volume. Their popularity stems from their convenience and reclosability, especially in settings like gyms where users intermittently sip during workouts. Even amidst sustainability challenges, rigid PET bottles dominate distribution channels, thanks to established filling lines, widespread availability, and strong consumer trust. While deposit-return schemes in countries like Germany introduce added costs, advancements in mono-material barrier films promise improved recyclability, ensuring these bottles remain vital in brand portfolios. Additionally, their ability to maintain product integrity and shelf life further solidifies their position in the market. Thus, bottles stand as the foundational element in the diverse world of isotonic packaging.
Pouches are set to be the fastest-growing packaging format, with a projected CAGR of 5.90% through 2031. Their appeal lies in 60–70% material weight savings and reduced freight emissions. Brands are capitalizing on pouch life-cycle assessments that highlight lower cradle-to-shelf carbon footprints, a selling point for retailers mindful of Scope 3 impacts. With premium designs like matte finishes and sports-cap closures, brands aim to shift pouches' perception from "kids drink" to a choice for adult performance enthusiasts. At the same time, pouches' affordability and portability resonate with younger, eco-conscious consumers, bolstering their popularity in both developed and emerging markets. Furthermore, their adaptability to various product sizes and formats enhances their appeal across diverse consumer segments. Consequently, pouches are carving out a reputation as the go-to eco-friendly and versatile packaging choice in the isotonic drinks arena.
By Distribution Channels:
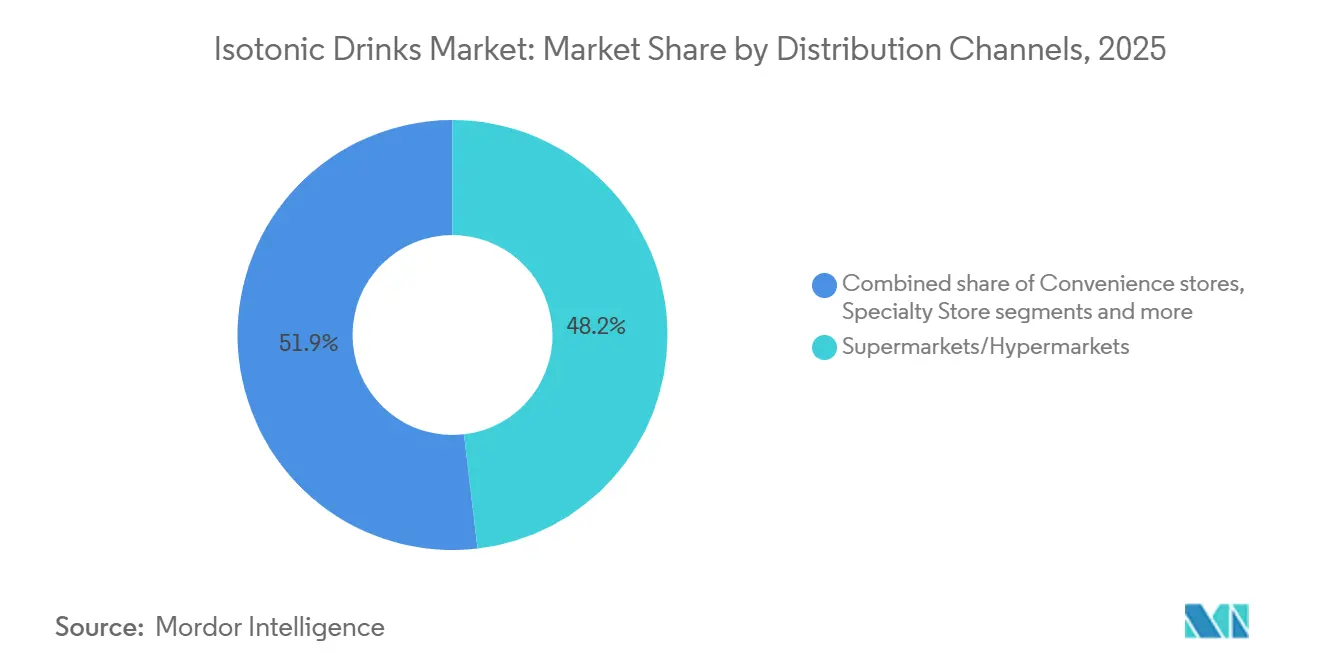
E-Commerce Disrupts Retail GatekeepersIn 2025, supermarkets solidified their status as the leading distribution channel for isotonic drinks, commanding a 48.15% market share. Their expansive reach, established trust, and prominent in-store presence position them as pivotal players in household purchases, particularly for multi-pack liquid SKUs. Major grocers cultivate shopper loyalty by offering exclusive flavor variants and bundled promotions, enhancing the category's value in comparison to rival beverage segments. While convenience stores cater to impulse-driven purchases, specialty nutrition outlets provide expert-led sales, showcasing the diverse retail landscape. Even with the rise of digital platforms, supermarkets continue to be the cornerstone for brand visibility and volume among mainstream consumers. This dominance is further supported by their ability to negotiate competitive pricing with suppliers, ensuring affordability for end consumers.
Online retail is emerging as the fastest-growing channel, with projections indicating a 9.11% CAGR expansion through 2031. E-commerce platforms are now at the forefront of brand launches, leveraging social media, particularly TikTok, to gauge traction before entering brick-and-mortar collaborations. Direct-to-consumer models are enhancing consumer engagement through loyalty programs, curated trial assortments, and hydration-tracking apps. Advanced algorithms not only personalize experiences but also optimize replenishment cycles and suggest larger pack sizes for regular users, driving up household consumption. To keep subscribers engaged, digital retailers introduce limited seasonal flavors, underscoring online retail's role as the innovation hub for the isotonic drinks market. Additionally, the convenience of doorstep delivery further accelerates the adoption of online channels among time-constrained consumers.
Geography Analysis
The Americas Isotonic Drinks Market
In 2025, North America accounted for 52.10% of global consumption, driven by a long-standing sports-drink tradition and a college-sports culture that fosters continuous brand engagement. In the U.S., fragmented NIL rules on athlete endorsements allow emerging brands to capture market share by connecting with local fan bases. Meanwhile, bilingual packaging in Canada and sodium warnings in Mexico introduce compliance costs, often underestimated by smaller U.S. entrants, thereby bolstering the advantages of established players. In South America, while pharmacies dominate, Electrolit leverages its medical credibility to maintain its market share, even as gyms advocate for lower-sugar alternatives. The region's reliance on traditional distribution channels further reinforces the dominance of established brands.
Europe Isotonic Drinks Market
Europe navigates a tightrope, balancing stringent EFSA claim regulations with circular-economy ambitions. This dual focus not only drives demand for cartons but also supports modest growth in the isotonic drinks market. In Germany and the Nordics, deposit-return fees push up PET prices, accelerating a shift towards pouches. Southern Europe's diverse outdoor sports, from cycling to beach volleyball, ensure steady volumes year-round. This consistency helps counterbalance the winter slowdown in Northern Europe, where indoor fitness activities lead to reduced overall sweat loss. Additionally, the region's focus on sustainability continues to shape packaging innovations and consumer preferences.
MEA and APAC Isotonic Drinks Market
Middle East and Africa are set to outpace the globe with an 8.31% CAGR growth rate extending to 2031. This surge is fueled by Gulf mega-projects, which are not only constructing sports cities but also luring global leagues for heightened visibility. In sub-Saharan Africa, where price sensitivity reigns and transport costs are steep, powder sticks find favor. Meanwhile, sachets, often transported by motorbike fleets, conveniently reach informal kiosks that lie beyond the realm of modern trade. The region's growing youth population and increasing sports participation further contribute to the market's rapid expansion. The Asia-Pacific landscape is a tapestry of contrasts: Pocari Sweat enjoys quasi-medical status in Japan, premium imports thrive in China's gym culture, and India's preference leans towards local powders in its sachet-driven economy. Despite Australia's small population capping absolute volumes, its surf and triathlon culture ensures a high per-capita spend on isotonic drinks. Rising health awareness across the region is also driving demand for functional and low-sugar options.
Regulatory Landscape
Regulation of isotonic drinks centers on ingredient and claim substantiation, and the pace of approvals for new electrolyte complexes can delay product launches. In the United States, the FDA Human Foods Program lists 2026 priority deliverables that include a proposed rule to require mandatory submission of GRAS notices for new substances, alongside an updated Food Code in 2026. Together, these items reinforce scrutiny around novel ingredients and signal tighter expectations for sports hydration products.
Several markets are also adjusting frameworks that shape labeling and route-to-market. Health Canada reclassified sports electrolyte products from the Natural Health Product framework to the food regulatory framework effective April 24, 2026, with a voluntary transition period for existing holders until December 31, 2027. This change alters compliance expectations for dossiers, labeling, and marketing. In Australia and New Zealand, FSANZ regulates electrolyte drinks within the Food Standards Code (including Standard 2.6.2), while select European jurisdictions have updated beverage requirements, such as the Czech Republics Decree No. 36/2026 Coll. effective June 14, 2026, adding further country-level compliance management for global brands.
Competitive Landscape
The market shows moderate concentration, with top players commanding the majority of the share, while challengers successfully carve out profitable niches. PepsiCo bolsters Gatorade with science-driven extensions like Gatorlyte. However, the surge in line extensions appears more as a defensive "shelf-blocking" tactic than a genuine push for new usage. Coca-Cola's BodyArmor, buoyed by celebrity co-owners, targets a younger audience, extending its reach beyond Gatorade's core demographic. The company invests heavily in social video campaigns to amplify its authenticity. This competitive dynamic underscores the importance of innovation and targeted marketing in maintaining market leadership.
Nestlé's acquisitions of Nuun and Liquid I.V. showcase a strategic portfolio approach, encompassing tablets, powders, and liquids. This strategy aims to optimize cross-format opportunities within the isotonic drinks sector. Prime Hydration's collaboration with UFC highlights how digital-first brands can upend traditional launch sequences, generating sell-out buzz on TikTok prior to securing deals with mainstream retailers. Brands like Science-in-Sport and BioSteel target elite endurance athletes, offering lab-validated micro-dose sodium ratios. These offerings, available through specialty stores, resonate with serious cyclists and runners. The growing diversity of product formats and marketing strategies reflects the sector's adaptability to evolving consumer preferences.
Regulatory expertise serves as a competitive advantage. Multinational corporations can finance human clinical trials and sustain dual formulations for both EFSA and FDA regions. In contrast, startups frequently resort to co-manufacturing under white-label agreements, which can restrict ingredient innovation. The industry's technological focus is pivoting towards at-home sweat-analysis kits. These kits, by providing app-based dosing recommendations, are steering the isotonic drinks market towards a future of personalized nutrition subscriptions. Furthermore, strategic investments in packaging research and development, exemplified by PepsiCo's collaboration with sustainable film innovators, underscore the growing importance of environmental compliance. As sustainability becomes a critical factor, companies must balance innovation with environmental responsibility to secure long-term growth
Isotonic Drinks Industry Leaders
-
The Coca-Cola Company
-
PepsiCo Inc.
-
Herbalife International Inc
-
Suntory Holdings Limited
-
Bright Lifecare Pvt. Ltd.
- *Disclaimer: Major Players sorted in no particular order
Isotonic Drinks Market Companies Covered in this Report
- PepsiCo Inc
- The Coca-Cola Co. (Powerade, BodyArmor)
- Suntory Holdings Limited
- Monster Beverage Corp. (Reign, NOS)
- Nestle SA (Nuun, Liquid I.V.)
- Congo Brands (Prime Hydration)
- Grupo Pisa (Electrolit)
- Science in Sport plc
- HIGH5 Sports Nutrition
- Lyteline LLC
- Vitalyte Sports Nutrition
- OSHEE Polska
- Otsuka Pharma (Pocari Sweat)
- BioSteel Sports Nutrition
- 6D Sports Nutrition
- Ultima Replenisher
- Isostar
- Cytosport (Muscle Milk)
- Abbott Laboratories (Pedialyte Sport)
- Glanbia plc (Optimum Nutrition Hydrate)
- Herbalife International Inc
- Bright Lifecare Pvt. Ltd.
Market Opportunities and Future Outlook
Portfolio and channel strategies are making room for everyday hydration use cases beyond event-only sports replenishment, especially where digital ordering and distribution help brands improve availability and purchase frequency. Coca-Colas Coke Buddy platform in India illustrates how bottlers can connect directly to retail customers to tighten ordering and inventory management, which in turn supports faster rollout of new hydration SKUs and improves in-stock reliability for high-velocity formats, including single-serve bottles and powders. Manufacturing investments also matter for execution at scale, and Suntory PepsiCos opening of a USD 300 million factory in southern Vietnam, including an automated warehouse, points to capacity and logistics investments aligned with expanding cold-chain and modern trade in Southeast Asia.
Regulatory shifts also create operational opportunities for compliant reformulation and tighter claim discipline, particularly for low-sugar, clean-label, and simplified positioning that can travel across markets with fewer label changes. Health Canadas April 2026 move to classify sports electrolyte products as foods, with a transition window through 2027, provides a defined pathway for brands operating in Canada to align formulations and packaging with food rules rather than NHP requirements. More broadly, large operators with redundant supply chains and partner-brand distribution models, such as those used by PepsiCo, have more flexibility to widen assortments in convenience and online channels while managing constraints from geopolitical and input-cost volatility that can pressure smaller entrants.
Recent Industry Developments in Isotonic Drinks Market
- July 2026: Suntory Oceania reports 36% local production increase and over 252 million units manufactured in its first year, with 21 new products launched. The expansion improves regional supply and broadens product diversification aimed at rising hydration and mineral drink demand.
- June 2026: BodyArmor Fit launched as a sparkling sports drink in a 12-ounce can. The development extends premium sports hydration into a ready-to-drink format with functional positioning for active consumers.
- April 2026: Gatorade Advanced Hydration System announced to target non-athletes with category specific hydration benefits. This shifts portfolio strategy toward broader consumer segments beyond elite athletes and reinforces category level positioning.
Isotonic Drinks Market Report Scope and Research Methodology
Market Definition and Coverage
This market covers ready-to-drink isotonic beverages that are formulated to help restore fluids and electrolytes, and are sold through retail and on-the-go channels for everyday hydration and sports-related consumption.
Scope exclusions: It excludes homemade electrolyte mixes and clinical rehydration solutions that are sold and regulated as medical products.
Segments Covered in This Report
- Product Type
- Liquid
- Powder
- Others (Gels)
- Packaging Type
- Bottle
- Cans
- Pouches
- Aseptic Cartons
- Distribution Channels
- Supermarket/Hypermarket
- Convenience stores
- Specialty Store
- Online Retail Store
- Other Distribution Channels
- By Geography
- North America
- United States
- Canada
- Mexico
- Rest of North America
- South America
- Brazil
- Argentina
- Colombia
- Chile
- Rest of South America
- Europe
- United Kingdom
- Germany
- France
- Italy
- Spain
- Russia
- Sweden
- Belgium
- Poland
- Netherlands
- Rest of Europe
- Asia-Pacific
- China
- Japan
- India
- Thailand
- Singapore
- Indonesia
- South Korea
- Australia
- New Zealand
- Rest of Asia-Pacific
- Middle East and Africa
- United Arab Emirates
- South Africa
- Saudi Arabia
- Nigeria
- Egypt
- Morocco
- Turkey
- Rest of Middle East and Africa
- North America
Data Sources, Market Sizing, and Validation
Desk Research
Desk research starts by locking the product boundary and tracking demand signals that can be checked in public data over time. We typically refer to official and non-paywalled sources such as UN Comtrade trade statistics for beverage-related flows, USDA and EU agriculture and food statistics for sugar and ingredient context, and national health agencies like the US CDC for hydration and physical activity indicators that shape consumption occasions.
To translate category direction into a sizing model, we also review company filings and investor presentations for revenue mix and geographic comments, along with reputable press and trade association releases that discuss sports nutrition and beverage consumption patterns. Where needed, paid subscriptions are used only to speed up company financial collection, news monitoring, and patent searches for formulation trends. These examples are illustrative, and many other public sources were also checked to collect data, validate assumptions, and clarify open questions.
Primary Interviews and Surveys
Primary work is used to test what we see in secondary signals, and then to fill the gaps that public data cannot answer cleanly, such as channel mix, pricing ladders, and how buyers define isotonic versus adjacent hydration drinks. We speak with participants across the value chain, including brand and category teams, distributors and retail channel managers, and ingredient and packaging stakeholders, with coverage across APAC, EMEA, and the Americas so regional differences in pack formats and claims can be reflected.
Distribution of primary research fieldwork respondents
| Company type | Respondent position | Region |
|---|---|---|
| Top tier: 31% | CXOs: 16% | APAC: 38% |
| Mid tier: 49% | Functional/Unit leaders: 29% | EMEA: 37% |
| Smaller Players: 20% | Managers: 55% | Americas: 25% |
Market-Sizing & Forecasting
Sizing is built using a top-down approach where beverage consumption patterns are reconstructed by geography and then narrowed to isotonic drinks using category shares validated in interviews. This starts from country level demand pools and retail structure, and it is then converted into value using observed price bands and pack size normalization.
To keep the model realistic, inputs are tied to simple fingerprints that can be tracked each year, such as changes in sports and fitness participation, shelf and cooler presence in modern trade and convenience, on-the-go single-serve versus multi-pack mix, and the direction of average selling price based on packaging shifts and inflation pass-through. We then corroborate results with selective bottom-up approximations, including sampled price checks by channel, a roll-up of visible brand presence across priority countries, and distributor feedback on sell-through velocity, and gaps are handled by using proxy markets with similar channel structure before being re-tested with expert feedback.
For forecasting, scenario analysis is used so that price, distribution expansion, and consumption frequency can be flexed transparently without overfitting the history. The scenario ranges are anchored to what interviewees view as plausible for promotions intensity, premiumization pace, and how quickly adjacent hydration alternatives affect buyer switching.
Data Validation & Update Cycle
Validation is done by triangulating the final totals against independent signals, including trade movement direction, reported company commentary on category growth, and channel-level pricing behavior, and then checking that volume and value move consistently. Any sharp swings are reviewed again, and the related assumptions are reworked, followed by a second internal analyst review before sign-off.
Reports are refreshed annually, and interim updates are triggered when material events occur, such as major regulatory labeling changes, large pricing resets, or distribution expansions that visibly change availability. Before delivery, an analyst completes a fresh pass to ensure the model and narrative reflect the latest data points available at that time.
Mordor Intelligence's Isotonic Drinks Market Estimate Compared With Other Published Estimates
Published market numbers for isotonic drinks can look far apart, even when they appear to describe the same category, because the product boundary and the starting year are not aligned across publishers. The most common differences come from how adjacent sports hydration formats are treated, how price is converted across regions, and how often the underlying assumptions get refreshed.
Volume and value cross-checks, plus country-level channel pricing sanity checks, are the evidence used to keep the 2026 estimate from Mordor Intelligence tied to a defined isotonic demand pool rather than a broader sports drink bucket. In practice, the spread also comes from whether a study includes powders, electrolyte concentrates, or functional waters, and whether it applies aggressive premiumization or promotion assumptions without validating them through retailer and distributor feedback.
Benchmark comparison
| Source | Market Size | Gaps in Research Methodology |
|---|---|---|
| Mordor Intelligence | USD 18.05 B (2026) | |
| Trade Journal B | USD 15.44 B (2024) | Uses a different base year and a broader category read-through that may blend isotonic drinks with nearby sports hydration products, with limited clarity on how channel pricing and currency timing were standardized. |
| Regional Consultancy A | USD 32.80 B (2026) | Likely counts a wider set of electrolyte and sports beverage formats and applies higher assumed ASP progression, which can inflate totals if pack mix and promotion depth are not revalidated by region. |
The table shows that most of the variation is explainable once base year, included product types, and the price-conversion logic are made explicit. By keeping the scope anchored to ready-to-drink isotonic beverages and testing pricing and channel mix assumptions through repeatable checks, we end up with a balanced figure that can be traced back to clear, updateable inputs.
Key Questions Answered in the Report
What was the isotonic drinks market size in 2026?
The market reached USD 18.05 billion in 2026
Which region leads current sales?
North America held 52.10% revenue share in 2025 and remains the largest regional contributor
Which segment is growing fastest by packaging?
Pouches are projected to expand at 5.90% CAGR through 2031 on sustainability advantages
How quickly are online channels expanding?
Online retail is advancing at a 9.11% CAGR as subscriptions take hold across key consuming nations