
Isobutylene Market Size and Share
Market Overview
| Study Period | 2020 - 2031 |
|---|---|
| Market Size (2026) | USD 30.58 Billion |
| Market Size (2031) | USD 37.15 Billion |
| Growth Rate (2026 - 2031) | 3.98 % |
| Fastest Growing Market | Asia-Pacific |
| Largest Market | Asia-Pacific |
| Market Concentration | Medium |
Major Players
*Disclaimer: Major Players sorted in no particular order Image © Mordor Intelligence. Reuse requires attribution under CC BY 4.0. |
|
Isobutylene Market Analysis by Mordor Intelligence
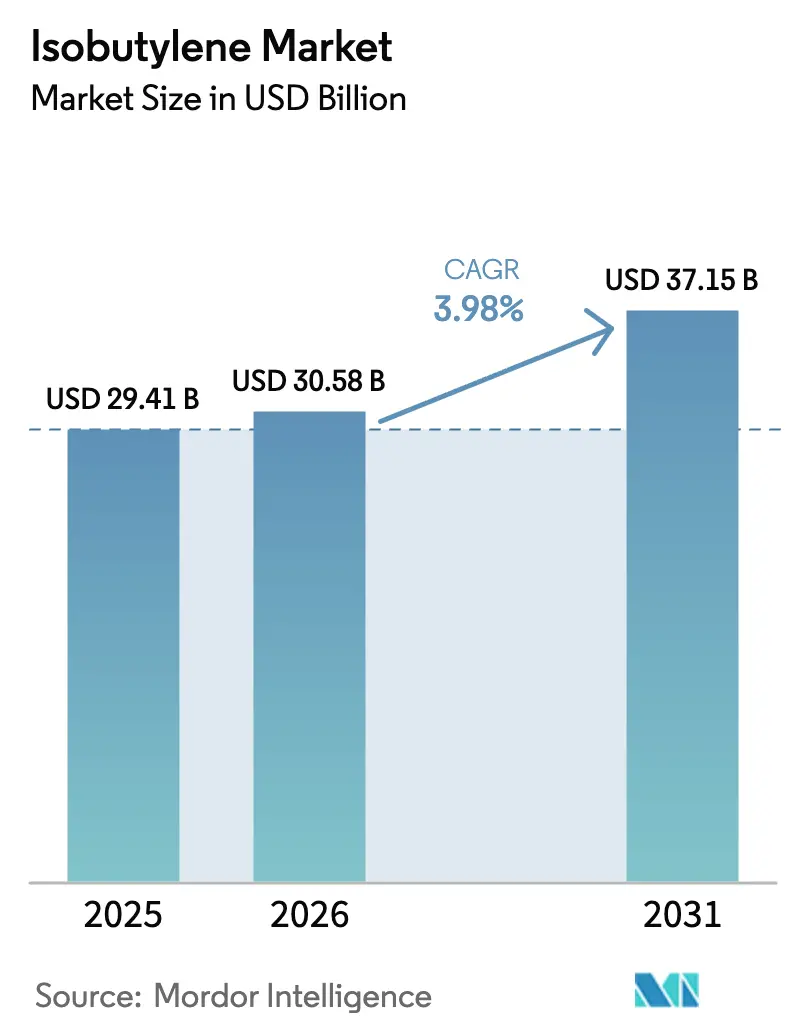
The isobutylene market size was valued at USD 29.41 billion in 2025 and estimated to grow from USD 30.58 billion in 2026 to reach USD 37.15 billion by 2031, at a CAGR of 3.98% during the forecast period (2026-2031). Steady progress comes from isobutylene’s central role in fuel-additive blending, butyl rubber synthesis, and a growing set of specialty materials. Recent regulatory moves—including the U.S. Environmental Protection Agency’s withdrawal of the 1-psi RVP waiver for E10 gasoline across eight Midwestern states—are reshaping octane-boosting demand and encouraging refiners to extract more C4 streams. New capacity additions such as the Texas PO/TBA complex and Asia-Pacific’s petrochemical buildouts are strengthening supply, yet regional over-capacity in light olefins continues to pressure margins. High-purity grades needed for pharmaceutical closures and aerospace sealants are carving out premium niches, while bio-isobutylene start-ups signal a longer-term pivot toward low-carbon routes.
Key Report Takeaways
- By product type, MTBE maintained 78.10% of isobutylene market share in 2025, whereas ETBE is projected to record the fastest 5.06% CAGR through 2031.
- By application, monomer for butyl rubber captured 39.20% share of the isobutylene market size in 2025; fuel additives are anticipated to expand at a 5.42% CAGR between 2026-2031.
- By end-user industry, the automotive sector held 43.20% revenue share in 2025, while pharmaceuticals are forecast to advance at a 5.05% CAGR to 2031.
- By geography, Asia-Pacific dominated with 54.80% of isobutylene market share in 2025 and is set to grow at a 4.72% CAGR through 2031.
Note: Market size and forecast figures in this report are generated using Mordor Intelligence’s proprietary estimation framework, updated with the latest available data and insights as of 2026.
Market Trends and Insights
Drivers Impact Analysis of Isobutylene Market*
| Driver | (~) % Impact on CAGR Forecast | Geographic Relevance | Impact Timeline |
|---|---|---|---|
| Rapid rebound of global butyl rubber tire production | +1.2% | Global, with Asia-Pacific leading | Medium term (2-4 years) |
| Growing demand for MTBE & ETBE anti-knock additives | +0.8% | North America, Europe, emerging markets | Short term (≤ 2 years) |
| Shift to high-purity isobutylene in pharma elastomers | +0.6% | North America, Europe, Japan | Long term (≥ 4 years) |
| Aerospace composites adopting isobutylene-based PIB sealants | +0.4% | North America, Europe | Long term (≥ 4 years) |
| Adoption of bio-isobutylene routes to monetize surplus corn-based bio-ethanol | +0.3% | North America, Brazil | Long term (≥ 4 years) |
| Source: Mordor Intelligence | |||
Rapid Rebound of Global Butyl Rubber Tire Production
Butyl rubber demand climbed as automotive build rates recovered, prompting a 7% rise in North American polypropylene and 4% rise in polyethylene consumption in 2024[1]LyondellBasell, “LyondellBasell Breaks Ground on World’s Largest PO/TBA Plant,” lyondellbasell.com . Electric-vehicle platforms now favor halogenated butyl inner liners for superior air retention, directly supporting isobutylene monomer offtake. ARLANXEO’s X Butyl line widened medical-grade options, underscoring the material’s span into sterile applications. Newly formulated polyisoprene compounds certified under USP <381> further highlight the migration toward regulation-ready elastomers.
Growing Demand for MTBE & ETBE Anti-Knock Additives
The United States exported 38,000 barrels/day of MTBE in 2024, chiefly to Mexico and Chile[2]U.S. Energy Information Administration, “U.S. Exports of MTBE,” eia.gov. Stricter 2027-2032 vehicle standards are paradoxically boosting high-octane blending to keep combustion engines compliant[3]U.S. Environmental Protection Agency, “Greenhouse Gas Emissions Standards for Light-Duty Vehicles,” epa.gov. Brazil’s liquid-fuel market is expanding 1.4% in 2025 and 1.9% in 2026, with ethanol holding a 47% share of Otto-cycle fuels, encouraging downstream ETBE production. Peer-reviewed work shows MTBE coupled with metal-oxide nano-additives can curb CO and unburned hydrocarbons while raising engine efficiency. Russian forecasts extending to 2035 reinforce the worldwide appetite for octane boosters despite geopolitical headwinds.
Shift to High-Purity Isobutylene in Pharma Elastomers
TPC Group expanded high-purity isobutylene output to serve medical elastomer, adhesive resin, and personal-care formulators. Demand stems from injectable drug closures requiring airtight, low-extractable seals. RJ651-30 polyisoprene meets USP <381> for Type I and II stoppers while delivering 15% higher tensile strength than prior formulations. Green cationic routes using FeCl₃ and tris(pentafluorophenyl)-gallium cut halogen waste, answering sustainability screens for pharma supply chains. Emerging-market vaccine fill-finish expansions, notably in India and Southeast Asia, are bolstering demand for ultra-clean elastomers.
Aerospace Composites Adopting Isobutylene-Based PIB Sealants
BASF leverages 85 years of PIB know-how to furnish moisture-proof sealants for fuel systems and fuselage joints. PIB’s chemical inertness ensures compatibility with composite airframe resins where bisphenol restrictions loom. Global Bioenergies achieved >95% selectivity toward sustainable aviation fuel (e-SAF) intermediates, positioning bio-isobutylene for future jet-fuel blends. Long certification cycles create high switching costs, enabling suppliers of PIB sealants to capture margins that exceed commodity elastomers.
Restraints Impact Analysis of Isobutylene Market*
| Restraint | (~) % Impact on CAGR Forecast | Geographic Relevance | Impact Timeline |
|---|---|---|---|
| Increasing penetration of alkyl-tertiary-amyl ether (TAME) as MTBE substitute | -0.7% | Global, particularly developed markets | Medium term (2-4 years) |
| Volatility in refinery C4 streams limiting captive feedstock | -0.5% | Global, with acute impact in Asia-Pacific | Short term (≤ 2 years) |
| Scale-up risk of bio-isobutylene technologies | -0.2% | Global, with focus on North America and Europe | Long term (≥ 4 years) |
| Source: Mordor Intelligence | |||
Increasing Penetration of Alkyl-Tertiary-Amyl Ether (TAME) as MTBE Substitute
Twenty-three U.S. states banned MTBE following groundwater issues, leading refiners to weigh TAME’s lower solubility and comparable octane performance. Vapor-pressure balancing during RFG blending complicates a direct switch, yet ISOMALK-3 isomerization technology cuts operational cost 20% and extends catalyst life a decade, making TAME feedstock cheaper. Future Renewable Fuel Standard volume targets emphasize advanced bio-oxygenates, putting additional pressure on MTBE economics.
Volatility in Refinery C4 Streams Limiting Captive Feedstock
Margins at several Southeast Asian crackers turned negative in 2024, triggering unplanned shutdowns that tightened regional C4 supply. Spot n-butane swings track Brent volatility, causing feedstock price whiplash for isobutylene producers. ONGC will import 800,000 t/y of U.S. ethane by mid-2028 to stabilize cracker yields, underscoring the lengths firms take to derisk supply. EU cracker rationalization aims to mothball another 1 Mt/y of ethylene by 2026 to restore 86-88% utilization. Upcoming U.S. fuel-streamlining rules effective July 2025 layer extra compliance costs that could divert C4 streams toward alkylate over isobutylene extraction.
*Our forecasts treat driver/restraint impacts as directional, not additive. The impact forecasts reflect baseline growth, mix effects, and variable interactions.
Isobutylene Market Segment Analysis
By Product Type:
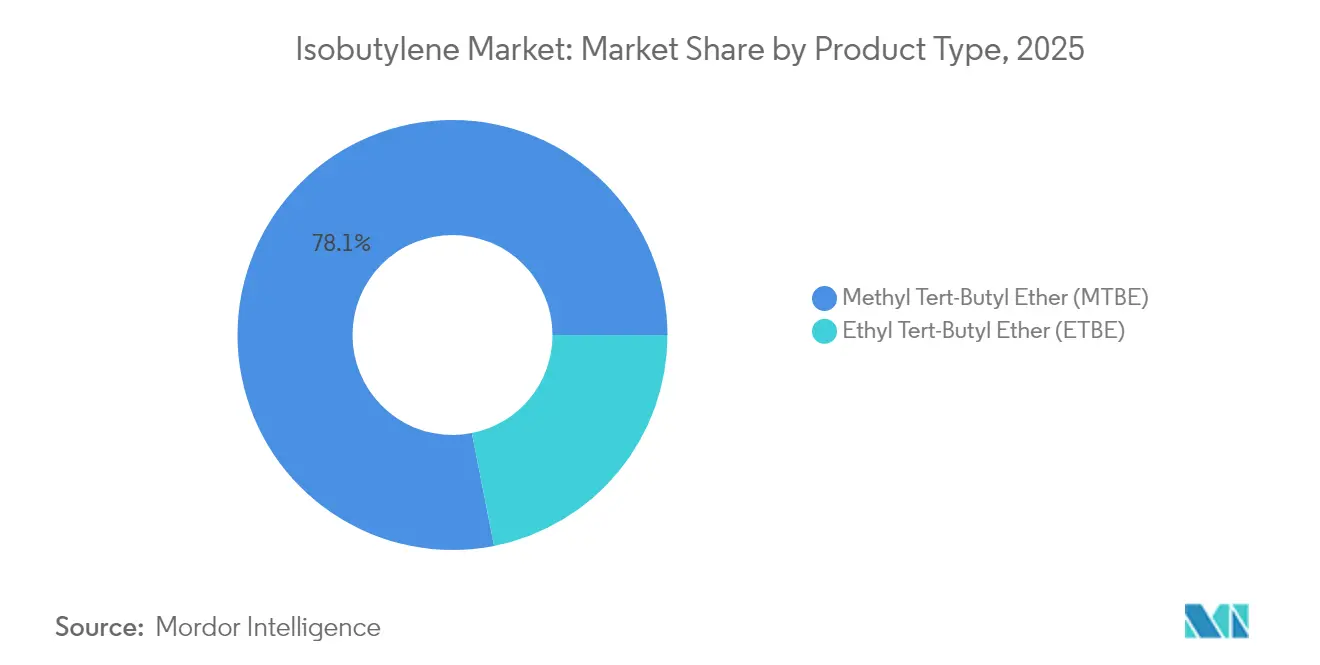
MTBE Dominance Faces ETBE ChallengeMTBE held 78.10% share of the isobutylene market in 2025, owing to its entrenched role in octane upgrading, while ETBE is forecast to climb at 5.06% CAGR through 2031. Evonik’s German and Belgian units keep Europe supplied, illustrating MTBE’s resilience even under stricter fuel directives. Conversely, ETBE’s bio-ethanol linkage is at the heart of decarbonization strategies: Thailand approved a 200,000 t/y bio-ethylene project supporting downstream ETBE pathways. The isobutylene market size for MTBE-based derivatives is projected to reach USD 28.2 billion by 2031, even as ETBE’s smaller base expands briskly.
R&D combining MTBE with nano-TiO₂ additives to trim tail-pipe emissions keeps MTBE competitive. Still, renewable fuel mandates favor ETBE, especially across the EU and Brazil, suggesting gradual share erosion for MTBE beyond 2030. Both derivatives benefit from integrated PO/TBA complexes that co-produce high-purity TBA for downstream isobutylene recovery.


By Application:
Butyl Rubber Leads, Fuel Additives AccelerateButyl rubber synthesis accounted for 39.20% of isobutylene market share in 2025, supported by steady tyre-replacement cycles and electric-vehicle uptake. ExxonMobil emphasizes butyl’s pivotal role in air-retention liners and EV battery gaskets. The isobutylene market size attributable to butyl rubber is anticipated to grow at a 4.05% CAGR, reaching USD 14.6 billion by 2031.
Fuel additives show the steepest 5.42% CAGR amid revived MTBE/ETBE demand in Latin America and Asia. Brazilian Otto-cycle growth and U.S. high-octane blending bolster additive offtake. Specialty elastomers and sealants rely on PIB’s impermeability for pharmaceutical stoppers and aerospace joints, creating high-margin pockets. Chemical intermediates such as butadiene from OXO-D processing widen downstream versatility.
By End-User Industry:
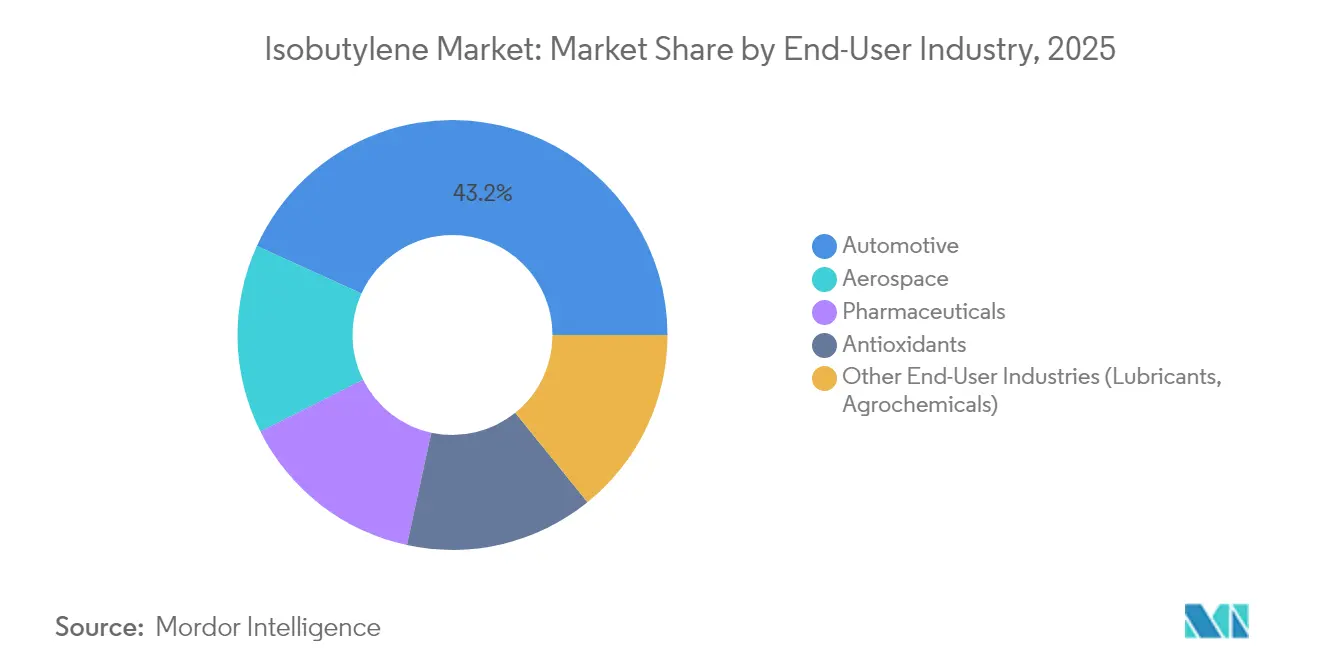
Automotive Dominance, Pharma AccelerationAutomotive retained a 43.20% share in 2025 thanks to tyre, lubricant, and octane-enhancer demand. Stricter 2027-2032 rules prompt OEMs to intensify engine calibration, raising high-octane additive blends. The isobutylene market size for automotive is forecast to reach USD 16.7 billion by 2031.
Pharmaceutical applications advance at a 5.05% CAGR, benefiting from stricter container-closure mandates. RJ651-30 polyisoprene’s USP <381> compliance typifies the shift toward low-extractable elastomers. Aerospace, although volume-light, captures premium margins, while antioxidant and lubricant uses add diversification across agriculture and industrial fluids.
Geography Analysis
APAC Isobutylene Market
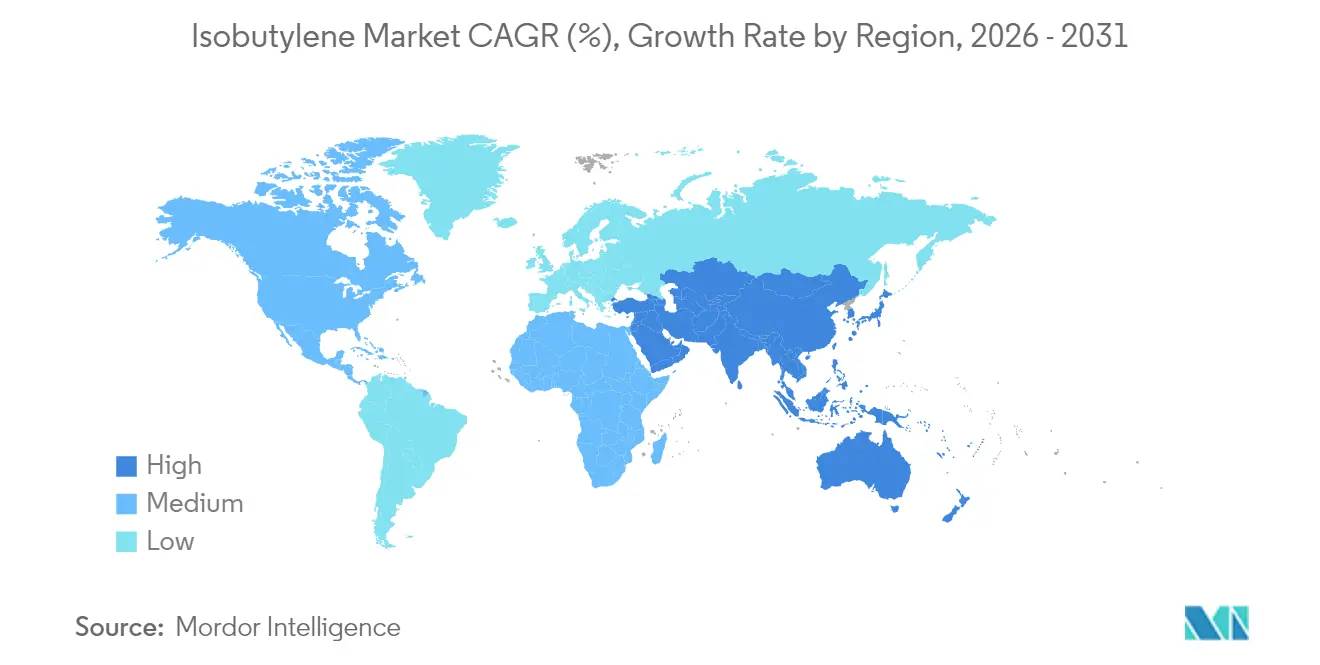
Asia-Pacific controlled 54.80% of the isobutylene market share in 2025 and should log a 4.72% CAGR through 2031. China’s olefin output is forecast to outstrip domestic C2 demand by 121% and C3 by 179% in 2025, creating abundant feedstock yet compressing margins. India’s petrochemical road-map channels USD 87-142 billion to lift capacity from 29.62 Mt to 46 Mt by 2030. Japan pursues carbon-neutral ethylene, potentially catalyzing bio-isobutylene demand.
North America Isobutylene Market
North America capitalizes on low-cost shale liquids. LyondellBasell’s USD 5 billion PO/TBA complex near Houston will reinforce regional supply from 2026 onward. The EPA’s loss of the 1-psi waiver boosts butane extraction by 26,000 b/d, expanding isobutylene feed availability. Mexico remains a key MTBE import market, absorbing U.S. exports tied to regional refining economics.
Europe Isobutylene Market
Europe faces rationalization: ExxonMobil and SABIC already shuttered 955 kt/y of ethylene, and another 1 Mt/y is scheduled to exit by 2026 to reach sustainable utilization. INEOS’s purchase of LyondellBasell’s EO/D unit signals strategic focus on high-purity intermediates.
South America Isobutylene Market
South America’s biofuels drive offers growth. Petrobras earmarked USD 111 billion for 2025-2029 downstream investments, aligning with RenovaBio credit incentives.
MEA Isobutylene Market
The Middle East and Africa exploit advantaged feedstock; SABIC’s USD 6.4 billion Fujian complex and collaborations with Aramco and Sinopec deepen integration with Asian customers.

Value Chain Analysis
Isobutylene supply starts with C4 stream generation in refineries and steam crackers (mixed C4s from FCC, butane dehydrogenation, and cracker byproduct). Upstream feedstock volatility and cracker operating decisions flow into isobutylene availability, which is then recovered via extraction and fractionation and converted through integrated units into MTBE/ETBE, polyisobutylene (PIB), butyl rubber monomer streams, and other C4 derivatives. In North America, PO/TBA integration is a key linkage because tertiary butyl alcohol can be dehydrated to isobutylene, and Gulf Coast operators also use crude C4 processing and hydrotreating to widen usable feed slates.
Midstream and downstream value is shaped by product purity and end-use qualification. High-purity isobutylene and controlled-MW PIB require tighter specifications, dedicated handling, and compliance with industrial safety and transport requirements reflected in safety data sheets, which raises the role of specialty gas and chemical distributors and certified packaging. Large integrated producers (for example, BASF in PIB and LyondellBasell across olefins and PO/TBA) tend to manage site operating rates to protect margins, while U.S. Gulf Coast players such as TPC Group focus on debottlenecking and crude C4 processing flexibility to stabilize feedstock conversion into higher-value derivatives.
Competitive Landscape
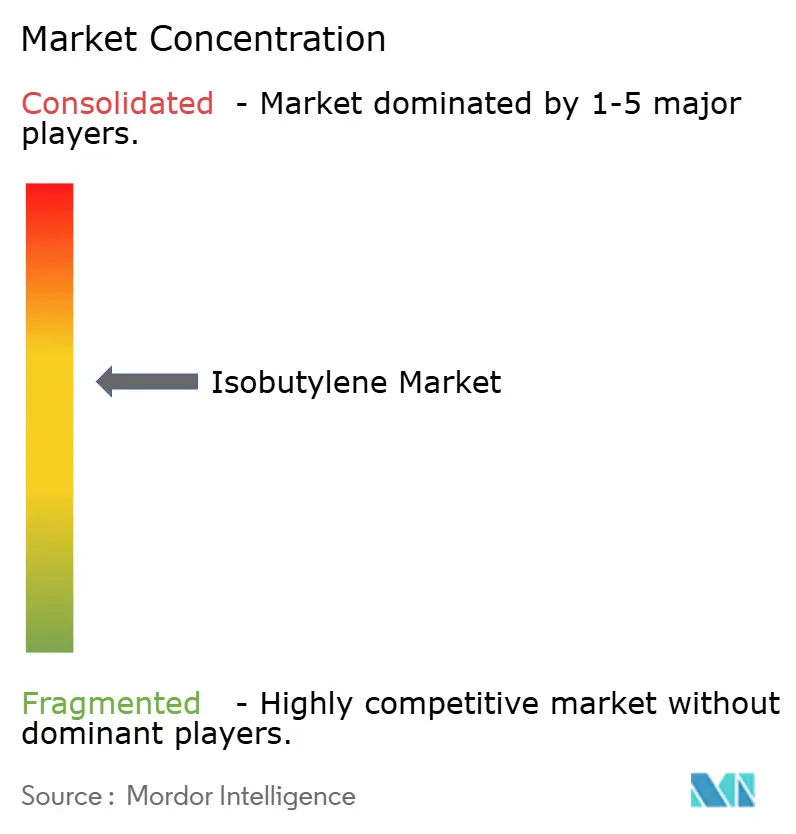
The isobutylene market is moderately consolidated in nature. Established participants leverage vertically integrated complexes to manage cost and secure feedstock. BASF runs PIB operations from the 1930s, supplying pharmaceuticals and aerospace. ExxonMobil and SABIC pursue joint ventures that capture scale while optimizing cracker utilization. LyondellBasell’s new PO/TBA facility will be the world’s largest and pairs propylene-oxide value with tertiary butyl alcohol that can be dehydrogenated to isobutylene, tightening the company’s grip on global trade flows.
TPC Group’s OXO-D technology yields high-reactivity isobutylene for performance polymers, underpinned by 300+ patents. Huntsman’s partnership with Sinopec anchors Chinese PO/MTBE output that feeds both domestic and export markets.
Bio-based entrants remain niche yet strategic: Global Bioenergies scaled to 1,000 t/y and targets aviation fuel demonstration by 2027, appealing to airlines seeking low-carbon scope 3 reductions. Consolidation is likely as sustainability certification, pharma GMP compliance, and aerospace NADCAP audits raise capital intensity.
Isobutylene Industry Leaders
-
Exxon Mobil Corporation
-
TPC Group
-
BASF
-
Shell plc
-
LyondellBasell Industries Holdings B.V.
- *Disclaimer: Major Players sorted in no particular order
Isobutylene Market Companies Covered in this Report
- Axens
- BASF
- Exxon Mobil Corporation
- Honeywell International Inc.
- Kaneka Corporation
- Linde PLC
- LyondellBasell Industries Holdings B.V.
- OMV Aktiengesellschaft
- Shell plc
- SIBUR Holding PJSC
- Sumitomo Chemical Co., Ltd.
- TPC Group
- Vinati Organics Limited

Market Opportunities and Future Outlook
Premiumization inside the isobutylene chain is increasingly tied to investments aimed at higher-value PIB and specialty applications, rather than only commodity fuel ethers. In February 2026, BASF expanded medium molecular weight polyisobutylene capacity at Ludwigshafen by 10,000 metric tons per year, explicitly connecting the addition to insulation and breathable membrane applications that pull demand toward performance materials and construction-related end uses. This supports scope for suppliers that can provide consistent molecular-weight control, low-odor and low-impurity grades, and technical support for compounding and membrane formulations.
Supply-chain opportunities also focus on resilience and feedstock flexibility across C4 processing, especially where utilization swings affect output. LyondellBasell noted in early 2026 that it was managing operating rates across North American and European assets and experienced unplanned downtime at Bayport PO/TBA, highlighting how reliability and integration affect the availability of tertiary butyl alcohol and downstream isobutylene recovery. Producers and traders with redundant logistics, alternative sourcing of mixed C4s, and the ability to shift between ether production and elastomer and intermediate outlets have clearer routes to capture value when regional light-olefin overcapacity compresses commodity margins.
Recent Industry Developments in Isobutylene Market
- March 2026: TPC Group advances near-term debottlenecking to expand Crude C4 processing capacity, including a 19% increase in hydrotreating capacity to be completed during 2026. The expansion increases Isobutylene/C4 derivative capacity in the US Gulf, improving feedstock resilience and strengthening C4 processing capability.
- May 2025: LyondellBasell Industries Holdings B.V. started construction of a USD 5 billion PO/TBA complex in Texas, the world’s largest integrated facility for these co-products. The expansion boosts isobutylene derivative capacity and strengthens the US supply chain and derivatives capacity.
- October 2024: TPC Group increased capacity for di-isobutylene production at its Houston facility. The expansion supports higher isobutylene derivative output and improves supply for specialty markets.


Isobutylene Market Report Scope and Research Methodology
Market Definition and Coverage
For this study, the market covers the value of isobutylene sold as a chemical building block and used to make downstream products, counted at the point of isobutylene supply and consumption across major regions.
Scope exclusions: We exclude the full downstream value of finished goods made from isobutylene (for example, final tires, packaged fuels, or consumer products) to avoid double counting.
Segments Covered in This Report
-
By Product Type
- Methyl Tert-Butyl Ether (MTBE)
- Ethyl Tert-Butyl Ether (ETBE)
-
By Application
- Fuel Additives
- Monomer for Butyl Rubber
- Chemical Intermediate
- Specialty Elastomers & Sealants
-
By End-User Industry
- Automotive
- Aerospace
- Pharmaceuticals
- Antioxidants
- Other End-User Industries (Lubricants, Agrochemicals)
-
By Geography
-
Asia-Pacific
- China
- India
- Japan
- South Korea
- Rest of Asia-Pacific
-
North America
- United States
- Canada
- Mexico
-
Europe
- Germany
- United Kingdom
- France
- Italy
- Rest of Europe
-
South America
- Brazil
- Argentina
- Rest of South America
-
Middle East and Africa
- Saudi Arabia
- South Africa
- Rest of Middle East and Africa
-
Asia-Pacific
Data Sources, Market Sizing, and Validation
Desk Research
Desk research starts with mapping supply routes for isobutylene (refinery C4 streams and petrochemical routes) and then linking them to end-use demand signals like gasoline blending and synthetic rubber output. We rely on public data series that help anchor volumes and trade directions, and then we translate them into value using observed price ranges and product-mix assumptions.
Common reference points include sources such as the U.S. Energy Information Administration (gasoline and blending components), the U.S. EPA (fuel rule changes that affect oxygenate demand), Eurostat (industrial output and chemical trade), UN Comtrade (import and export flows for relevant chemicals), and the International Energy Agency (transport fuel demand trends). We also review company filings, investor decks, customs notes, and association publications, and then use paid subscriptions for company financial intelligence, patent search, and shipment-level trade checks when a public series is too high level. These sources are illustrative, and many additional public documents were reviewed for data collection, cross-checks, and clarification.
Primary Interviews and Surveys
Primary work is used to confirm how much isobutylene is typically directed into MTBE, ETBE, butyl rubber, and other uses, and to validate realistic utilization and pricing ranges by region. We speak with a mix of producers, distributors, and downstream formulators so gaps from public data can be closed (especially where reporting is delayed or aggregated). Coverage is balanced across major consuming regions so that our assumptions reflect differences in fuel specs, refinery integration, and local supply availability.
Distribution of primary research fieldwork respondents
| Company type | Respondent position | Region |
|---|---|---|
| Top tier: 29% | CXOs: 13% | APAC: 49% |
| Mid tier: 55% | Functional/Unit leaders: 37% | EMEA: 29% |
| Smaller Players: 16% | Managers: 50% | Americas: 22% |
Market-Sizing & Forecasting
Sizing is built using a top-down approach where fuel demand, oxygenate blend rates, and synthetic rubber output are used to reconstruct an addressable isobutylene demand pool, which is then translated into value using region-appropriate price and purity mixes. To keep the totals realistic, we corroborate results with selective bottom-up approximations, such as supplier capacity and utilization checks, sampled price per ton ranges, and channel feedback on typical contract structures.
Key inputs that shape the model include refinery and steam cracker C4 availability, MTBE and ETBE blending economics, butyl rubber and lubricant additive production indicators, import and export balances for related chemicals, and feedstock and energy cost trends that influence operating rates. For forecasting, we mainly use scenario analysis supported by short time-series smoothing, since policy moves on fuel specifications and regional capacity additions can shift demand faster than a straight-line trend. When bottom-up information is missing for smaller markets, we fill gaps using proxy indicators like fuel consumption and industrial output, and then re-test the result with expert feedback before finalizing.
Data Validation & Update Cycle
Outputs are checked through triangulation across independent signals, including trade direction, operating rate logic, and end-use demand consistency, and then variances are reviewed until the driver is clearly explained. If a region shows an unusual jump, the assumption is re-opened and respondents are re-contacted to confirm whether it is a price movement, a mix shift, or a real volume change.
A second analyst review is completed before sign-off so calculation steps and conversions are consistent across regions and years. Reports are refreshed annually, and interim updates are made when material events occur, such as new capacity start-ups, major shutdowns, or fuel regulation changes. Before delivery, a final data pass is performed so clients receive the latest updated view.
Mordor Intelligence's Isobutylene Market Estimate Compared With Other Published Estimates
Published market sizes for isobutylene can look far apart because each publisher draws the line at a different point in the value chain and then applies different price and mix assumptions. Currency timing, the way captive transfers are treated, and how quickly updates are applied after policy or capacity changes also add visible spread.
Some estimates roll isobutylene together with a wider derivatives basket or include the full revenue of downstream products like MTBE, ETBE, and rubbers. In Mordor Intelligence, the total is kept at the isobutylene value layer and is validated using end-use demand build-ups (fuel blending demand and synthetic rubber indicators) plus trade and utilization checks, which reduces double counting when the same molecules move through multiple processing steps.
Benchmark comparison
| Source | Market Size | Gaps in Research Methodology |
|---|---|---|
| Mordor Intelligence | USD 30.58 B (2026) | |
| Trade Journal A | USD 25.91 B (2024) | Uses an earlier base year and leans on a narrower price deck during a different feedstock cycle, and it appears to treat high-purity volumes more conservatively which lowers the blended value. |
| Industry Publisher B | USD 23.45 B (2024) | Combines isobutylene with a broader derivatives grouping in some places but then applies simplified conversion ratios and limited validation on regional operating rates, which can understate the addressable isobutylene layer. |
The table shows that year choice and scope layering drive most of the gap, not a single demand driver. By keeping the value point consistent, re-checking mix and prices by region, and re-testing assumptions against independent supply and demand signals, we end up with a market size that is easier to trace and repeat across updates.


Key Questions Answered in the Report
What is the current Isobutylene Market size?
The Isobutylene Market is valued at USD 30.58 billion in 2026 and is forecast to reach USD 37.15 billion by 2031.
Which product holds the largest isobutylene market share?
In the Isobutylene Market, MTBE dominates with 78.10% of global revenue in 2025, thanks to its entrenched role as an octane enhancer.
Which application segment is growing fastest?
In the Isobutylene Market, fuel additives are projected to grow at a 5.42% CAGR between 2026-2031 as regulators tighten octane and emissions requirements.
Why is Asia-Pacific the leading region?
In the Isobutylene Market, the region commands 54.80% of global demand due to large-scale petrochemical expansions in China and India that secure abundant C4 feedstock and end-use growth.
Page last updated on:


 Your data is secure and never sold or shared.


