
Market Overview
| Study Period | 2020 - 2031 |
|---|---|
| Forecast Data Period | 2026 - 2031 |
| Base Year Market Size (2025) | USD 4.43 Billion |
| Market Size (2026) | USD 4.57 Billion |
| Market Size (2031) | USD 5.36 Billion |
| Growth Rate (2026 - 2031) | 3.22 % |
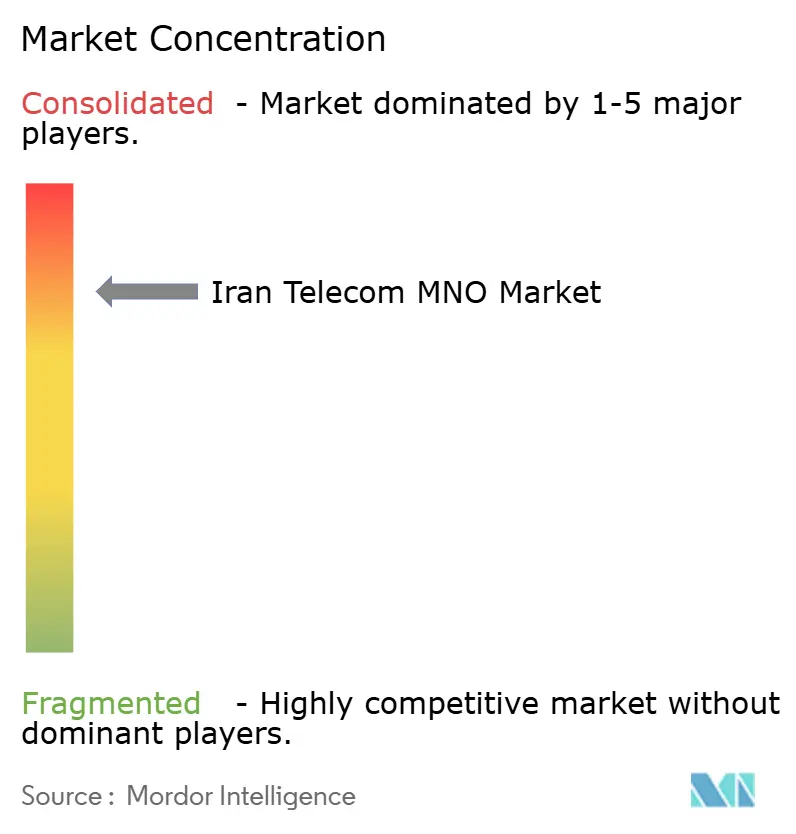
| Market Concentration | High |
Major Players *Disclaimer: Major Players sorted in no particular order Image © Mordor Intelligence. Reuse requires attribution under CC BY 4.0. | |
Iran Telecom MNO Market Analysis by Mordor Intelligence
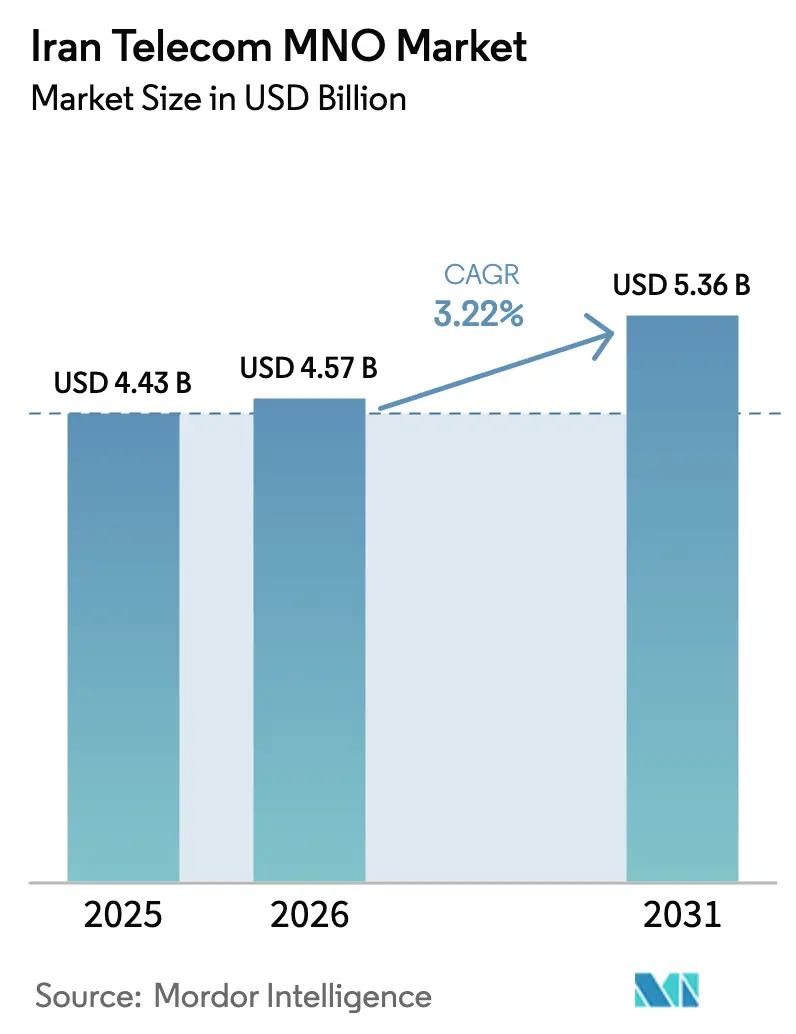
Iran Telecom MNO Market size in 2026 is estimated at USD 4.57 billion, growing from 2025 value of USD 4.43 billion with 2031 projections showing USD 5.36 billion, growing at 3.22% CAGR over 2026-2031.
The measured growth path shows how operators are sustaining revenues despite sanctions that limit equipment imports and foreign partnerships. Domestic infrastructure programs, particularly the National Information Network, now route most traffic inside the country and lower transit costs.[1] “In-house adaptation sustains growth,” tejaratnews.com Government fiber-to-the-home subsidies aimed at 20 million premises stimulate broadband demand even as rial volatility inflates capital expenses. Mobile internet penetration surpassed 109% in 2024, so growth hinges on higher-value data, IoT, and enterprise services rather than new subscriber additions. Operators also gain revenue momentum from domestic video streaming, cloud hosting, and super-app partnerships that deepen customer engagement.
Key Report Takeaways
- By service type, data and internet services led with 47.68% of the Iran Telecom MNO market share in 2025; IoT and M2M services are projected to expand at a 3.35% CAGR through 2031.
- By end user, the consumer segment accounted for 86.22% share of the Iran Telecom MNO market size in 2025, while enterprise services are advancing at a 3.95% CAGR to 2031.
Note: Market size and forecast figures in this report are generated using Mordor Intelligence’s proprietary estimation framework, updated with the latest available data and insights as of 2026.
Iran Telecom MNO Market Trends and Insights
Drivers Impact Analysis*
| Driver | (~) % Impact on CAGR Forecast | Geographic Relevance | Impact Timeline |
|---|---|---|---|
| 5G spectrum acceleration | +0.8% | National with early gains in Tehran, Isfahan, Mashhad | Medium term (2-4 years) |
| Gov-backed FTTH subsidy scheme | +0.6% | National, prioritizing rural and underserved areas | Long term (≥ 4 years) |
| Domestic video-streaming boom | +0.4% | National, concentrated in urban centers | Short term (≤ 2 years) |
| Sanction-driven domestic cloud buildout | +0.5% | National, enterprise-focused in major cities | Medium term (2-4 years) |
| IoT uptake in oil and gas monitoring | +0.3% | Khuzestan and offshore fields | Long term (≥ 4 years) |
| FinTech super-app partnerships | +0.2% | National, urban uptake | Short term (≤ 2 years) |
| Source: Mordor Intelligence | |||
5G spectrum acceleration
The communications ministry awarded the 3,600 MHz and 3,700 MHz bands in early 2025, clearing a regulatory hurdle that had slowed migration to 5G technology. [2]Iran Daily Editors, “5G Frequency Auction Results,” iran daily.ir Chinese vendors now supply most radio access equipment because U.S. sanctions block European suppliers; their integrated hardware–software stacks shorten roll-out timelines and cut procurement costs, enabling operators to light up 5G in Tehran, Isfahan, and Mashhad before March 2025. First-phase coverage targets 20 million users, with enterprise use cases in oil, gas, and manufacturing validating premium tariffs. Early adopters benefit from lower latency for industrial monitoring and high-resolution video, while operators gain a differentiated value proposition that eases price competition in saturated 4G segments. Success of the pilot zones will guide the nationwide expansion plan now scheduled for completion by 2027.
Gov-backed FTTH subsidy scheme
The USD 2.1 billion (≈ 50 trillion rial) subsidy program reduces household installation fees from 3.5 million tomans (≈ USD 70) to levels affordable for middle-income subscribers. [3]Business Desk, “Rural Fiber Subsidy Details,” donya-e-eqtesad.comMore than 98% of villages with at least 20 households already have high-speed access, positioning Iran ahead of several regional peers in rural broadband penetration. Subsidized fiber stimulates take-up of premium data bundles, online gaming, and over-the-top TV services that lift average revenue per user. Operators also monetize wholesale dark-fiber leases to cloud providers building domestic data centers. The program dovetails with the National Information Network’s goal of routing sensitive traffic locally, thereby conserving scarce international bandwidth and lowering peering costs for carriers.
Domestic video-streaming boom
Restrictions on global platforms such as Netflix channel demand toward local services like Filimo and Namava, whose combined paying user base climbed above 14 million in 2024. Irancell now bundles unlimited access to domestic video catalogs with high-speed data tiers, adding content-driven stickiness that reduces churn. Local hosting means traffic remains inside Iran, trimming international transit fees and easing pressure on congested gateways. Advertisers follow audiences to domestic platforms, providing operators with incremental revenue through targeted video ad insertion. The content partnership model will expand as rights holders see higher monetization potential within a sovereign digital ecosystem.
Sanction-driven domestic cloud buildout
Enterprises migrating from AWS, Azure, and Google Cloud to domestic providers such as Abr Arvan increased domestic IaaS demand by 46% year-over-year in 2024. Telecom operators supply the secure fiber cross-connects, leased lines, and managed security layers that corporate customers require for data residency compliance. Because reliability is paramount, enterprises accept higher local pricing, giving operators a rare opportunity to expand margins even while the consumer business commoditizes. New data centers in Tehran, Qom, and Tabriz generate wholesale backhaul demand that absorbs excess network capacity. The cloud shift also anchors large-volume contracts, helping carriers hedge against price-sensitive prepaid mobile segments.
Restraints Impact Analysis*
| Restraint | (~) % Impact on CAGR Forecast | Geographic Relevance | Impact Timeline |
|---|---|---|---|
| US sanctions on network imports | -0.7% | National | Long term (≥ 4 years) |
| Rial volatility raising CAPEX costs | -0.5% | National | Medium term (2-4 years) |
| High energy costs and grid outages | -0.3% | Industrial regions | Short term (≤ 2 years) |
| OTT cannibalization of international voice | -0.2% | Urban centers | Medium term (2-4 years) |
| Source: Mordor Intelligence | |||
US sanctions on network imports
Broad U.S. export controls continue to bar Ericsson, Nokia, and Cisco from shipping critical gear to Iranian carriers. Operators rely on Chinese suppliers whose product roadmaps do not always match Western standards, reducing interoperability and complicating multi-vendor optimization. Spare-parts lead times stretch to several months, raising the risk of service degradation after equipment failures. Financial sanctions also freeze dividends owed to foreign shareholders; MTN Group has been unable to repatriate USD 1 billion since 2018, limiting its flexibility to reinvest. Together these factors lengthen payback periods on 5G and fiber builds, curbing the pace of network modernization.
Rial volatility raising CAPEX costs
The rial lost over 30% of its value against the U.S. dollar between 2023 and 2024, inflating prices of imported radios, servers, and optical modules. Budget uncertainty forces operators to renegotiate vendor contracts in shorter cycles and to hold larger inventories of spare parts. Smaller carriers with thin cash reserves postpone upgrades, risking quality gaps that accelerate subscriber migration to the two largest operators. Currency swings also deter foreign investors whose returns would be exposed to rapid depreciation; this restricts outside capital that could otherwise accelerate 5G scale-up. To mitigate risk, carriers hedge by sourcing more components domestically, although local manufacturing capacity remains limited to passive infrastructure and low-end devices.
*Our forecasts treat driver/restraint impacts as directional, not additive. The impact forecasts reflect baseline growth, mix effects, and variable interactions.
Segment Analysis
By Service Type: Data services anchor growth while IoT accelerates
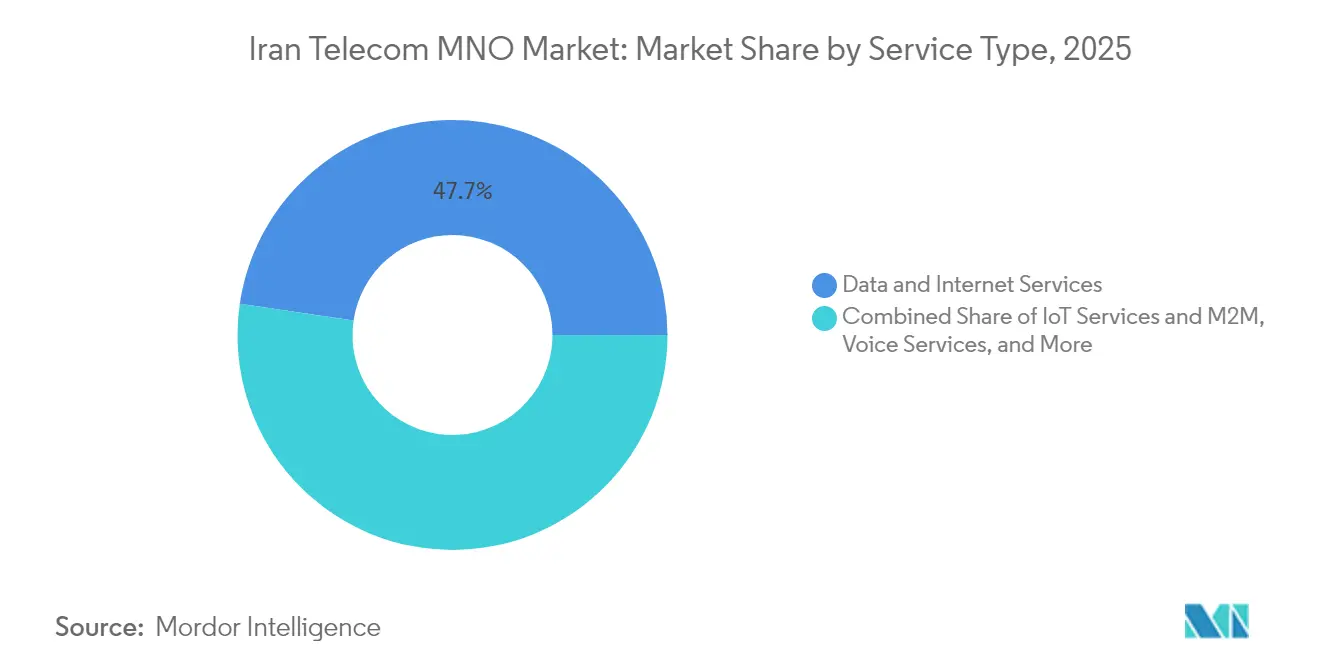
Data and internet services captured 47.68% of the Iran Telecom MNO market share in 2025, and the segment’s solid usage growth positions it as the central pillar of operator revenue streams. The Iran Telecom MNO market size tied to data plans is forecast to compound at 3.05% through 2031 as video streaming, mobile gaming, and remote work sustain bandwidth demand. Operators bundle zero-rated access to domestic content platforms, balancing higher per-gigabyte prices with perceived value. The shift toward bigger data packages offsets the slow erosion in voice and SMS revenues that continues under OTT pressure. Consumer appetite for rich media also drives investments in content delivery networks located inside Iran, improving latency for end users and slashing peering costs for carriers.
IoT and M2M revenue grows from a small base at a 3.35% CAGR, making it the fastest-expanding service category. Oil and gas operators deploy sensor networks across wellheads and pipelines in Khuzestan, transmitting telemetry via NB-IoT links that demand ultra-reliable connectivity. The launch of Hatef and Keyhan satellites in 2024 furnishes narrowband coverage to remote deserts and offshore platforms, allowing operators to package hybrid terrestrial-satellite solutions. Municipalities in Tehran, Mashhad, and Shiraz pilot smart-parking and traffic-light projects that could scale nationally once proof of value is demonstrated. Although IoT currently generates less than 5% of sector revenue, high gross margins and multi-year contracts give it outsize strategic importance for ARPU stability. Operators develop proprietary IoT management portals and cyber-security layers as differentiators, reinforcing their move from pure connectivity providers to managed-service partners.


By End User: Massive consumer base funds enterprise ambition
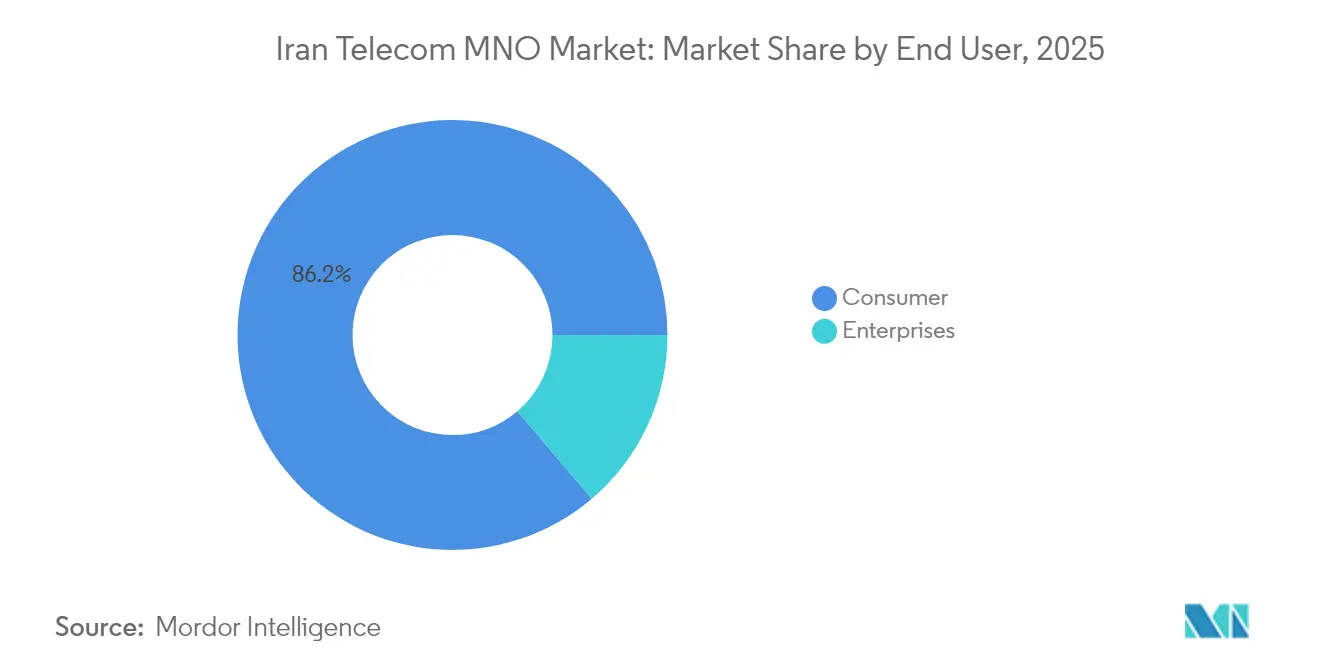
The consumer segment delivered 86.22% of 2025 revenue, reflecting Iran’s 109% mobile penetration and strong smartphone replacement cycle. Ongoing fiber subsidies raise the ceiling for fixed-mobile convergence bundles that include IPTV, cloud gaming, and smart-home security feeds. Tiered unlimited plans help operators monetize heavy video users while limiting network congestion through speed throttling above preset thresholds. Competitive differentiation now centers on value-added apps such as e-wallets, ride-hailing integrations, and exclusive drama series. Churn remains moderate because number portability adoption is low, although Rightel leverages digital-only onboarding and youth-oriented branding to lure urban prepaid users.
Enterprise services, while smaller in absolute terms, advance at a 3.95% CAGR to 2031, outpacing the consumer side and lifting blended ARPU for the Iran Telecom MNO industry. Banks, insurers, and payment processors require secure private APNs for their mobile workforces, a niche that commands double the per-SIM revenue of mass-market plans. Manufacturers in Isfahan deploy 5G private networks to automate quality control via machine-vision cameras, driving incremental spectrum-leasing income for carriers. The Iran Telecom MNO market size attached to enterprise verticals will climb steadily as sanctions keep public-cloud options limited and motivate firms to source end-to-end solutions locally. Operators tailor bundled offers that weave in fixed connectivity, managed security, cloud storage, and IoT dashboards, creating sticky multi-year contracts with predictable cash flows.
Geography Analysis
Regional disparities are narrowing as national infrastructure priorities push fiber and 4G/5G coverage deep into rural districts. Tehran remains the largest revenue pool, accounting for an estimated 30.65% of Iran Telecom MNO market revenue in 2025 on the back of higher ARPU and dense enterprise clusters. Early 5G deployments across Tehran’s business corridors catalyze demand for ultra-low-latency applications such as real-time stock trading and cloud CAD. Isfahan and Mashhad follow, sharing in the first wave of 5G roll-outs thanks to their sizable university populations and tourism activity.
Rural provinces witness a step-change in broadband quality as the FTTH subsidy program connects villages larger than 20 households. Universal service obligations compel operators to install base stations powered by renewable micro-grids in mountainous terrain where grid power is unreliable. For users in Kohgiluyeh-Boyer Ahmad and Sistan-Baluchestan, the leap from 2G voice to 4G data unlocks e-learning and telemedicine options previously inaccessible. This inclusivity aligns with the National Information Network, which now handles 99% of domestic traffic, lowering cross-border data exposure and reducing peering costs.
Border regions such as West Azerbaijan leverage improved mobile coverage to boost cross-border e-commerce with Turkey and Iraq. Coastal provinces along the Persian Gulf benefit from enhanced maritime connectivity for port logistics and offshore oil rigs, bolstering IoT use cases in asset tracking. The Iran Telecom MNO market size associated with these industrial corridors will increase as operators integrate 5G standalone cores that support network slicing, enabling dedicated logical networks for petrochemical complexes or free-trade zones. Overall, geographical expansion follows a mosaic of economic hubs, resource sites, and government inclusion mandates, ensuring balanced growth across divergent socio-economic landscapes.
Regulatory Landscape
Iran's mobile market is overseen by the Ministry of Information and Communications Technology (ICT), with the Communications Regulatory Authority (CRA) serving as the primary regulator for licensing, spectrum management, and tariff oversight. A key recent regulatory milestone was the award of 3,600 MHz and 3,700 MHz spectrum in early 2025, which supported operator progress on 5G rollouts in major cities. CRA performance and rollout targets also feed into operator capex priorities, including a stated 5G coverage objective running through 2028.
Beyond commercial rules, operators also work under national security and content-control mandates that can include internet restrictions or shutdown compliance during heightened sensitivity periods. Pricing policy has been handled through staged adjustments, with a phased tariff increase spanning late 2025 into early 2026. Separately, the policy direction supporting the National Information Network reinforces data localization and domestic traffic routing requirements, which in turn influences network architecture, peering decisions, and partnerships with domestic cloud and content platforms.
Competitive Landscape
Market concentration is moderate, with three nationwide operators dividing the subscriber base. Hamrah-e Aval (MCI) commands leadership by virtue of its 75 million subscribers and deepest rural footprint, leveraging scale economies to negotiate favorable vendor pricing. MTN Irancell delivered 49% service-revenue growth in H1 2024 after repricing data bundles and upselling enterprise VPNs, signaling its intent to erode MCI’s dominance. Rightel positions itself as the digital challenger, bundling Filimo streaming access and unlimited social-media data to target youth and professionals seeking premium experiences.
Strategic moves skew toward alliances that leverage domestic technology ecosystems. Irancell signed a framework agreement with Abr Arvan to co-locate edge data centers, marrying connectivity with cloud compute for latency-sensitive applications. Hamrah-e Aval invests in AI-enabled customer-care chatbots that lower operating costs while improving resolution times, setting a customer-experience benchmark in a competitively tight marketplace. Rightel cooperates with fintech giant Digipay to embed micro-lending in its self-care app, expanding beyond connectivity into financial services.
Equipment sourcing gravitates toward Huawei and ZTE under long-term supply agreements that include training and local assembly. While Chinese solutions ease sanction risk, they constrain multi-vendor flexibility, prompting carriers to develop in-house integration expertise. Energy-efficient radios and liquid-cooling data centers help operators cap rising electricity costs during peak demand periods. Regulatory oversight remains firm but supportive of innovation: the ICT Ministry green-lighted a sandbox for 5G private networks that lets industrial customers test use cases before commercial launch. The evolving landscape rewards carriers that balance network quality, digital service breadth, and compliance with sovereign data mandates.
Iran Telecom MNO Industry Leaders
Mobile Communications of Iran (MCI)
MTN Irancell
Rightel
- *Disclaimer: Major Players sorted in no particular order

Market Opportunities and Future Outlook
In Iran, MNO opportunities center on monetizing higher-value data and digital services within a sovereign, localized internet environment. The National Information Network routes the majority of domestic traffic locally, which supports carrier economics by reducing international transit dependence and creates room for operator-aligned domestic cloud, CDN, and edge hosting. This is consistent with observed enterprise migration toward domestic cloud providers (such as Abr Arvan) and ongoing expansion of domestic video streaming services (including Filimo and Namava), both of which lift demand for reliable mobile backhaul, private connectivity, and local delivery infrastructure.
Investment opportunities also track government-led broadband expansion, including the FTTH subsidy program (USD 2.1 billion) that supports fixed-mobile convergence bundles and wholesale fiber leasing to domestic data centers. On mobile, early-2025 mid-band 5G spectrum awards and CRA coverage targets through 2028 strengthen the business case for industrial and enterprise use cases, including private networks and IoT in oil and gas monitoring in regions such as Khuzestan. With equipment import constraints under sanctions, operators and suppliers can focus on deeper local integration, spares planning, and energy-resilience measures to sustain service quality while expanding capacity in high-usage corridors.
Recent Industry Developments
- July 2026: Deployment of additional LTE capacity and mobile sites to maintain network stability for a major state event. The expansion increases network capacity for the peak-demand period. This strengthens MTN Irancell's resilience and market position ahead of the event.
- June 2026: Rightel launched a new fiber optic network in the city of Mianeh. It expands the fiber backbone in a key urban center. The capacity addition broadens the service footprint and competitive edge in fixed-mobile integration.
- June 2026: Mobile Communications of Iran (MCI) reported 75.9 million active subscribers at annual general meeting. It reinforces leadership and scale in Iran's MNO market. The result solidifies incumbent market dominance and supports capacity to leverage ecosystem partnerships.


Research Methodology Framework and Report Scope
Market Definition and Coverage
For this methodology, the market is defined as the value of mobile network operator telecom services sold in Iran, covering core connectivity revenues from serving both consumer and enterprise users.
Scope exclusions: This scope excludes handset and device sales, standalone ICT software and IT services, and non-telecom digital media revenues.
Segmentation Overview
- Overall Telecom Revenue and ARPU
- Service Type
- Voice Services
- Data and Internet Services
- Messaging Services
- IoT and M2M Services
- OTT and PayTV Services
- Other Services (VAS, Roaming and International Services, Enterprise and Wholesale Services, etc.)
- End-User
- Enterprises
- Consumer
Data Sources, Market Sizing, and Validation
Desk Research
Desk research starts with building the operating context for Iran telecom, so we can set realistic demand and pricing guardrails before any forecasting is attempted. We rely on public statistics and technical indicators such as Communications Regulatory Authority (CRA) releases, Statistical Center of Iran time series (population and inflation), and ITU indicators for telecom access and usage where comparable.
To make the model usable in USD terms, we also review macro and currency markers published by official bodies such as the Central Bank of Iran, and we pair those with operator disclosures found in annual reports, investor materials, and credible business press coverage. Where needed, paid subscriptions for company financials and news, patent databases, and shipment-level import and export records are used to cross-check capex cycles, network build intensity, and equipment flow signals. These desk research sources are illustrative only, and many other public and paid references were also used to collect data, validate it, and clarify gaps.
Primary Interviews and Surveys
We use interviews and surveys with telecom executives, functional leaders, network specialists, and managers in Iran to test assumptions about subscriber activity, data usage, pricing, enterprise demand, and service revenue. Respondents help clarify gaps in public records, assess model inputs, and reconcile differences between reported operator results and the final estimate.
Distribution of primary research fieldwork respondents
| Company type | Respondent position |
|---|---|
| Top tier: 30% | CXOs: 15% |
| Mid tier: 50% | Functional/Unit leaders: 30% |
| Smaller Players: 20% | Managers: 55% |
Market-Sizing & Forecasting
The core sizing starts from a top-down reconstruction of service revenue pools by linking connections, active data users, and usage intensity to monetization proxies such as ARPU, bundle pricing, and the share of data in service revenue. In practice, the model is anchored to market fingerprints that can be checked, including mobile connection counts and penetration, smartphone and broadband adoption trends, data traffic growth, and network expansion markers such as 4G and 5G coverage progress.
Once the top-down totals are built, selective bottom-up checks are run so the results do not drift away from what the market can realistically generate. These checks use sampled price plans, implied revenue per subscriber bands derived from interviews, and channel feedback on recharge and bundle take-up, which are then used to adjust outliers and fill gaps where public splits are not available.
For forecasting, scenario analysis is applied around a base case aligned to expert expectations on demand growth and pricing behavior. The yearly path is smoothed using exponential smoothing for variables that tend to move gradually, such as ARPU and the subscriber base. When data is missing for a sub-period, we interpolate using nearby regulatory indicators and confirmed operator behavior, and we document the assumption so it can be revisited in the next update.
Data Validation & Update Cycle
Validation is done in several steps so the final number is not driven by a single source type. We compare outputs against independent signals such as penetration, reported network rollout milestones, and macro affordability indicators, and then we re-check any large variances that do not match interview feedback.
Before sign-off, the model and key assumptions go through analyst reviews that focus on consistency across years, clean currency handling, and realistic service mix changes. Reports are refreshed annually, and interim updates are triggered when material events occur, such as major policy shifts, sharp currency movements, or unexpected network rollout changes. Right before delivery, a final pass is completed so clients receive the latest updated view.
Mordor Intelligence's Iran Telecom Market Size Measured Against Other Published Estimates
Published market values for Iran telecom can differ widely, and most gaps come from what is counted as telecom revenue and how currency and inflation effects are treated in USD reporting. Timing can also change the result, because base-year choices shift the value even when the underlying demand trend looks similar.
Subscriber penetration signals and CRA-reported industry revenue checkpoints are used to link Mordor Intelligence's estimate to billable MNO service revenue, instead of blending in device sales or broader ICT spending.
Benchmark comparison
| Source | Market Size | Gaps in Research Methodology |
|---|---|---|
| Mordor Intelligence | USD 4.43 B (2025) | |
| Regional Consultancy A | USD 11.50 B (2024) | This figure appears to treat the market as total telecom plus adjacent categories, which can fold in devices and wider ICT services, and it also uses a different base year that changes the USD translation. |
| Trade Journal B | USD 2.12 B (2023) | This value aligns more with regulator-reported ICT industry revenue converted at a single point exchange rate, which can understate telecom-only service revenue when non-telecom ICT lines and currency timing are mixed. |
The spread in the table is mainly explained by scope boundaries and the year and currency choices used to express local revenues in USD. By keeping the model tied to measurable connectivity demand and repeatable revenue drivers, the sizing stays transparent and easier to update when new regulator and operator indicators are released.


Key Questions Answered in the Report
How big is the Iran Telecom MNO market in 2026?
The sector generated USD 4.57 billion in 2026 and is on course to reach USD 5.36 billion by 2031.
What is driving revenue growth for Iranian mobile operators?
Higher-value data bundles, 5G roll-outs, domestic cloud hosting, and IoT demand in oil-and-gas and smart-city projects underpin revenue expansion.
Which service category is growing fastest?
IoT and M2M connections are expanding at a 3.35% CAGR through 2031 thanks to industrial monitoring and municipal smart-infrastructure projects.
How do sanctions affect telecom equipment sourcing?
U.S. sanctions block European vendors, so operators procure most 4G and 5G gear from Chinese suppliers, leading to longer lead times and limited vendor diversity.
Why is the enterprise segment attractive to carriers?
Enterprise contracts bundle connectivity with cloud, security, and IoT services, yielding higher ARPU and long-term cash-flow stability.
What role does the National Information Network play?
The network routes 99% of domestic traffic inside Iran, cutting international transit fees and reinforcing data-sovereignty compliance for operators.
Page last updated on:


 Your data is secure and never sold or shared.


