
Market Overview
| Study Period | 2021 - 2031 |
|---|---|
| Forecast Data Period | 2026 - 2031 |
| Base Year Market Size (2025) | 2.5 gigawatt |
| Market Volume (2026) | 3.41 gigawatt |
| Market Volume (2031) | 16.14 gigawatt |
| Growth Rate (2026 - 2031) | 36.45 % |
| Market Concentration | Medium |
Major Players *Disclaimer: Major Players sorted in no particular order Image © Mordor Intelligence. Reuse requires attribution under CC BY 4.0. | |
Iran Solar Energy Market Analysis by Mordor Intelligence
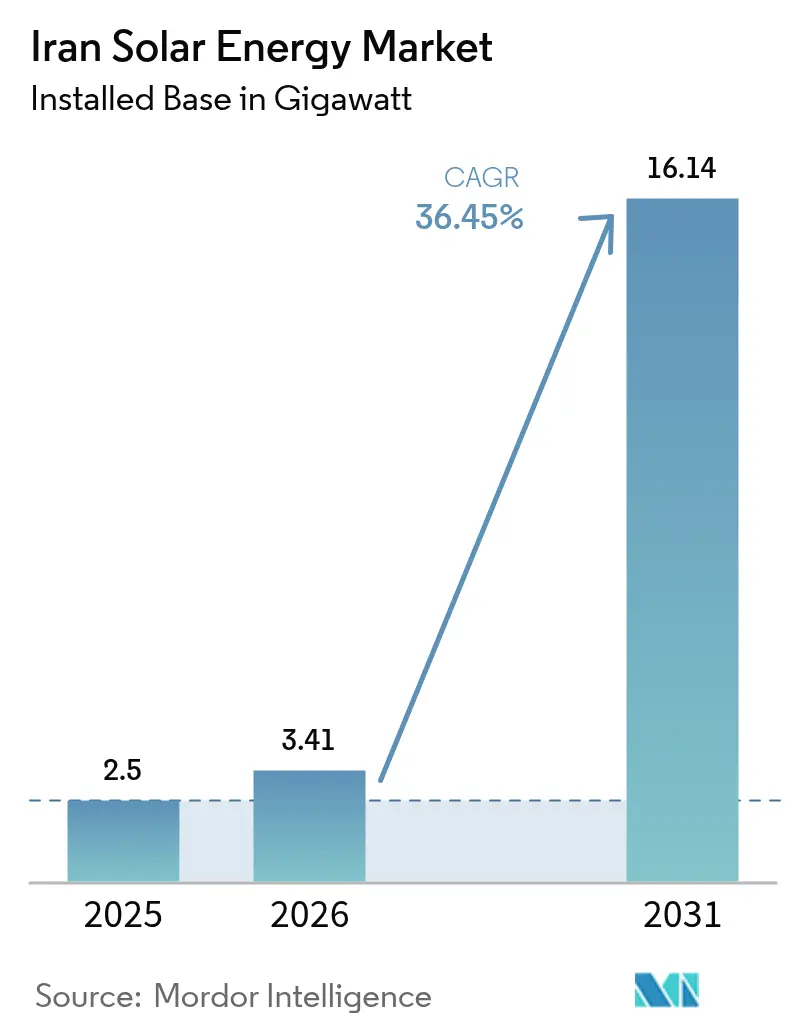
The Iran Solar Energy Market size in terms of installed base was valued at 2.5 gigawatt in 2025 and estimated to grow from 3.41 gigawatt in 2026 to reach 16.14 gigawatt by 2031, at a CAGR of 36.45% during the forecast period (2026-2031).
This growth surge is driven by a 15 GW national target, 300 sunny days per year, and an average solar irradiance of over 2,200 kWh per square meter. The SATBA feed-in tariff (FiT) revival offers 20-year, foreign-exchange-indexed contracts that restore bankability for private developers, while the 10 GW industrial captive-solar exemption from load shedding anchors demand from energy-intensive plants. Import-duty waivers on bifacial modules and trackers, together with localization mandates that seed joint-venture factories, are further accelerating capacity build-out. Foreign-exchange constraints and fossil-fuel subsidies still temper residential adoption, but rail freight from China and domestic assembly lines provide viable workarounds.
Key Report Takeaways
- By technology, solar photovoltaic (PV) accounted for 97.43% of Iran's solar energy market share in 2025 and is projected to grow at a 36.12% CAGR through 2031.
- By grid type, on-grid systems held a 93.55% share of the Iranian solar energy market in 2025; off-grid registered the fastest growth at a 40.25% CAGR.
- By end-user, utility-scale installations secured 74.62% of Iran's solar energy market share in 2025, while commercial and industrial systems led growth at a 41.12% CAGR.
Note: Market size and forecast figures in this report are generated using Mordor Intelligence’s proprietary estimation framework, updated with the latest available data and insights as of 2026.
Iran Solar Energy Market Trends and Insights
Drivers Impact Analysis*
| Driver | (~) % Impact on CAGR Forecast | Geographic Relevance | Impact Timeline |
|---|---|---|---|
| SATBA feed-in-tariff revival boosts bankability | +8.5% | National, with early gains in Isfahan, Kerman, Yazd | Medium term (2-4 years) |
| 10 GW industrial captive-solar exemption from load-shedding | +7.2% | Industrial corridors, concentrated in Tehran, Isfahan, Khuzestan | Short term (≤ 2 years) |
| Nomad & rural mini-grid roll-out (28,000 kits by 2024) | +5.8% | Rural and nomadic regions nationwide | Long term (≥ 4 years) |
| Import-duty waiver on bifacial modules & trackers | +4.9% | National, with spillover to neighboring markets | Medium term (2-4 years) |
| Localization mandate spurs JV manufacturing capacity | +4.1% | Manufacturing hubs in Tehran, Isfahan, with export potential | Long term (≥ 4 years) |
| Source: Mordor Intelligence | |||
SATBA Feed-in Tariff Revival Boosts Bankability
The restored 20-year FiT, indexed to foreign-exchange rates, removes off-taker risk and shields returns from devaluation. Solar projects that once stalled at 3% of annual capacity targets now progress as SATBA has granted permits exceeding 29 GW, creating a substantial development pipeline. Domestic pension funds welcome inflation-protected yields, and preliminary talks on rial-denominated green bonds indicate emerging depth in the capital market. Early grid-synchronized projects validate cash flows, encouraging follow-on investment, and the multiplier effect accelerates the Iranian solar energy market beyond official forecasts.
10 GW Industrial Captive-Solar Exemption from Load-Shedding
Guaranteed grid access for self-generation provides energy-intensive plants with a clear arbitrage: replacing blackout downtime, which cuts summer output by up to 40%, with a predictable solar supply. The 600 MW Aftab-e-Sharq complex, co-developed by Mobarakeh Steel, demonstrates how captive solar reduces operational volatility and cuts CO₂ emissions by 2.5 million tons annually.[1]MAPNA Group Communications, “Aftab-e-Sharq 600 MW Solar Project Update,” mapnagroup.com Spatial clustering around industrial corridors reduces infrastructure costs per MW and fosters shared maintenance ecosystems, thereby deepening solar’s competitiveness in manufacturing value chains.
Nomad & Rural Mini-Grid Roll-Out (28,000 Kits)
Portable systems, offered at 10% of the cost, have electrified 10% of Iran’s 252,000 nomadic households, demonstrating a scalable off-grid model that bypasses the need for expensive transmission extensions. High reliability in harsh climates encourages sedentary rural communities to adopt similar solutions, and government subsidy precedents pave the way for solar-powered irrigation and cold-storage schemes that enhance food security. The three-year deployment window showcases institutional agility that could be redeployed for larger rural energy programs.
Import-Duty Waiver on Bifacial Modules & Trackers
Removing duties aligns policy with energy-yield economics: bifacial panels deliver up to 30% more output in high-albedo deserts while single-axis trackers add 15-25% generation gains.[2]Wiley Editorial Board, “Performance Uplift of Bifacial Modules in High-Albedo Terrains,” Wiley, onlinelibrary.wiley.com Higher harvests raise tax receipts, making the waiver fiscally neutral and position Iran to benefit from global bifacial cost curves expected to dominate installations post-2030. The measure also signals a pragmatic balance between access to technology and domestic manufacturing incentives.
Restraints Impact Analysis*
| Restraint | (~) % Impact on CAGR Forecast | Geographic Relevance | Impact Timeline | |
|---|---|---|---|---|
| Subsidised fossil-fuel tariffs undercut solar LCOE | -3.8% | National, with higher impact in gas-rich regions | Long term (≥ 4 years) | |
| FX liquidity crunch for imported PV components | -2.9% | National, with acute effects in import-dependent regions | Short term (≤ 2 years) | |
| Grid-congestion & curtailment in Yazd-Kerman solar belt | -2.4% | Yazd-Kerman corridor, with spillover to central provinces | Medium term (2-4 years) | |
| Sanctions-linked financing bottlenecks | -2.1% | National, with higher impact on large-scale projects | Medium term (2-4 years) | |
| Source: Mordor Intelligence | ||||
Subsidized Fossil-Fuel Tariffs Undercut Solar LCOE
Electricity priced near USD 0.04/kWh distorts economics, keeping solar LCOE at a premium, especially for residential customers. Subsidy reform is politically sensitive, yet gradual industrial tariff rises signal an implicit recognition that the fiscal burden is unsustainable. Differential price adjustments now encourage corporates to adopt renewables, but household uptake lags until broader subsidy rationalization narrows the gap.
FX Liquidity Crunch for Imported Components
Sanctions-induced banking curbs prompt developers to turn to informal currency markets, which offer exchange rates 20-30% higher, thereby inflating capital expenditures for inverters and trackers. Rail shipments from China to Aprin dry port offer an alternative logistics option; however, currency volatility necessitates contingency buffers in project budgets. Localization is a long-term hedge, although advanced component production still relies on imported precursor materials.
*Our forecasts treat driver/restraint impacts as directional, not additive. The impact forecasts reflect baseline growth, mix effects, and variable interactions.
Segment Analysis
By Technology: Solar PV Achieves Complete Market Dominance
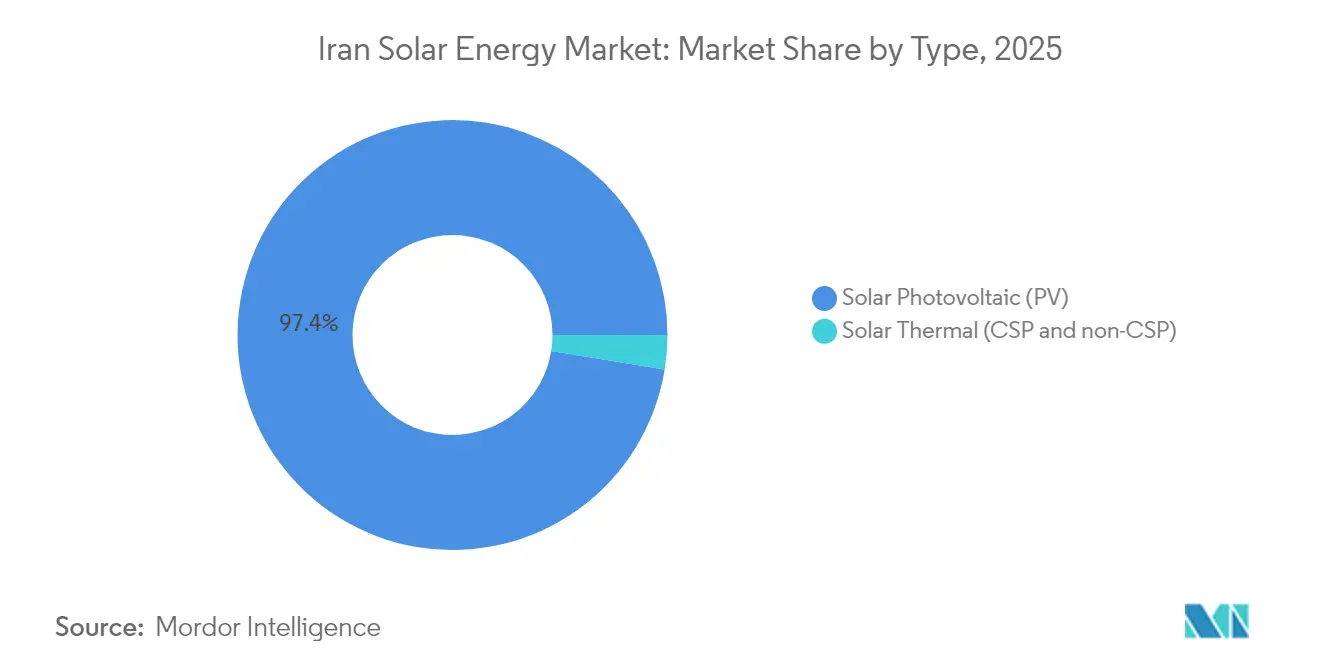
Solar PV accounted for 97.43% of Iran's solar energy market share in 2025, as every new megawatt added since late 2023 has used crystalline-silicon modules. The Iranian solar energy market size devoted to PV is projected to grow at a 36.12% CAGR through 2031, as policymakers have eliminated regulatory pathways for water-intensive CSP, opting instead for a single-technology platform that standardizes engineering, O&M, and grid-code compliance. Iran's 300 sunny days and direct normal irradiance above 2,200 kWh/m² raise PV capacity factors to 23% in southeastern deserts, keeping levelized costs below subsidized gas peaker plants over 20-year FiT contracts.
Technology consolidation further trims soft costs as EPC firms reuse design templates, procurement contracts, and workforce training modules. Duty-free access to bifacial panels and single-axis trackers enables developers to increase yield by up to 30% at flat capital expenditure, locking in superior economics for the Iran solar energy market size earmarked for utility projects. The absence of rival technologies also simplifies supply-chain localization, enabling Tehran and Isfahan factories to scale module assembly lines without splitting volume across multiple process flows. Continued global price declines for mono-PERC and TOPCon wafers, therefore, directly feed into domestic capex savings, sustaining PV's market share through 2031.


By Grid Type: On-Grid Dominates While Off-Grid Accelerates
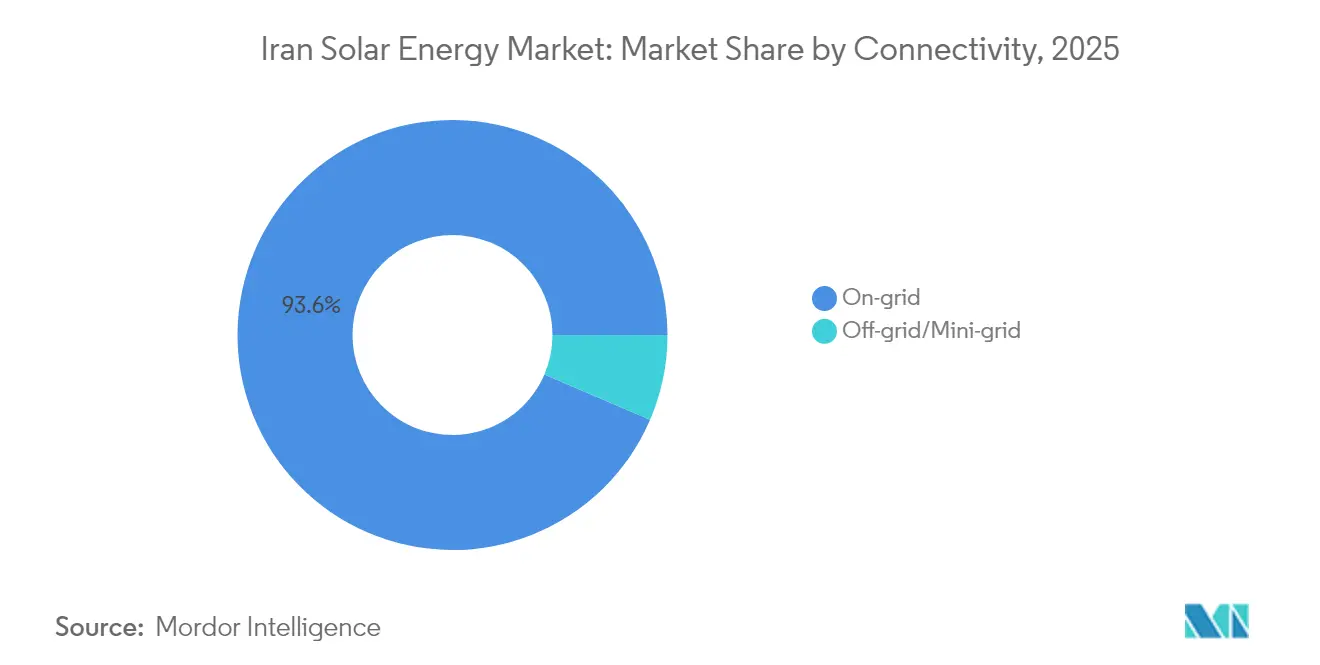
On-grid assets represented 93.55% of Iran's solar energy market share in 2025 because SATBA's 20-year, FX-indexed power-purchase agreements guarantee bankable cash flows for utility plants. This grid-linked slice of the Iranian solar energy market size grows steadily as developers rush to plug a 14 GW summer deficit; yet, off-grid and mini-grid systems register a sharper 40.25% CAGR through 2031, driven by 28,000 subsidized nomadic kits and village micro-grids that leapfrog transmission bottlenecks.
Curtailment in the congested Yazd-Kerman corridor is now pushing some sponsors toward storage-coupled off-grid farms, creating a feedback loop that accelerates decentralized adoption. Net-metering and one-stop interconnection desks cut paperwork for rooftop projects feeding urban feeders, while standalone arrays power pumps, telecom towers, and agro-clusters beyond the reach of the high-voltage backbone. Taken together, on-grid expansion and off-grid acceleration create a twin-track build-out that enhances both bulk supply and last-mile access.
By End-User: Utility-Scale Leads While C&I Surges
Utility plants larger than 5 MW commanded 74.62% of Iran's solar energy market share in 2025, reflecting a state strategy that prioritizes high-impact projects capable of offsetting a projected 30% generation shortfall. The Iran solar energy market size for these grid-anchored parks grows steadily, but commercial and industrial (C&I) systems post a faster 41.12% CAGR as manufacturers secure blackout immunity under a 10 GW captive-solar exemption.
Mobarakeh Steel's off-take from the 600 MW Aftab-e-Sharq complex exemplifies how C&I demand underwrites utility economics while delivering 2.5 million t annual CO₂ cuts. Subsidized household tariffs of around USD 0.04/kWh still hinder residential adoption, yet rising industrial rates and ESG reporting rules are propelling factory rooftops and brownfield carports into financial viability. As fiscal pressures prompt the government to consider broader tariff reform, the C&I surge is likely to intensify, gradually balancing today's utility-heavy project pipeline.
Geography Analysis
Southern and central provinces form the nucleus of the Iranian solar energy market. The Yazd-Kerman belt, blessed with 2,200 kWh/m² of irradiation, hosts landmark projects such as the 600 MW Aftab-e-Sharq park, which demonstrates industrial-utility collaboration. Grid congestion in the corridor prompts parallel investment in 400-kV lines and battery systems to stave off curtailment risks.
The northern coastal provinces of Gilan and Mazandaran show promise for rooftop potential in densely populated areas. Although irradiance is lower, proximity to demand nodes and robust urban grids offset production differentials. Pilot “solar settlements” are already paving streets with PV canopies that double as shading and power generation.
Western regions such as Khuzestan and Kermanshah present emerging opportunities tied to oil-gas infrastructure that offers strong grid backbones and industrial offtakers. Resource assessments identify Abadan and Aghajari as high-yield sites with minimal land-use conflicts. Further east, Semnan Province is earmarked for a high-tech solar hub backed by Chinese capital, creating export corridors into Central Asia once sanctions constraints ease.
Regulatory Landscape
Iran's solar market is primarily governed by the Renewable Energy and Energy Efficiency Organization (SATBA) under the Ministry of Energy, which oversees licensing and procurement for renewable projects. The core instrument remains SATBA's guaranteed power purchase agreement (feed-in tariff) structure, supported by pathways such as industrial self-consumption and green power trading through the Iran Energy Exchange (IRENEX). Policy direction is anchored by national capacity goals cited by SATBA (including an 18,000 MW renewables target by 2030), alongside the country's planning framework that calls for accelerated renewables build-out through the Seventh Development Plan.
On the demand side, mandates and compliance requirements are increasingly used to create bankable offtake beyond utility tenders. These include a requirement for government bodies to supply 40% of their electricity from renewable sources and a stated requirement for industries to source 20% of electricity from renewables starting in 2028. In May 2026, SATBA highlighted rooftop solar as a priority area, linking facilitation measures to financing access and domestic equipment production, which reinforces the linkage between policy incentives and localization requirements in the solar supply chain.
Competitive Landscape
Market concentration is moderate, with MAPNA Group spearheading development and vertically integrated joint ventures strengthening local supply chains. MAPNA’s renewable arm synchronised the first 20 MW of Aftab-e-Sharq in October 2024 and targets full completion of 600 MW before 2027, showcasing its turnkey EPC capability. Chinese majors, JinkoSolar, Trina Solar, and Longi, sustain equipment dominance through cell and wafer supply, but opt for licensing rather than direct ownership to navigate sanctions.
Strategically, top domestic firms pursue localization to lock in FiT premium eligibility and hedge currency exposure. Target segments include floating PV on reservoirs, combining evaporation control with generation; agro-PV in water-scarce farms; and grid-stabilizing battery hybrids that can unlock curtailed capacity. Barriers to new entrants remain high due to financing hurdles and the complexity of navigating policies, yet the scale of upcoming tenders ensures room for specialized EPC, O&M, and digital monitoring players.
Iran Solar Energy Industry Leaders
Mapna Renewable Energy
SATBA-backed Ghadir Solar
JinkoSolar
KPV Solar GmbH
Carlo Maresca SpA
- *Disclaimer: Major Players sorted in no particular order


Market Opportunities and Future Outlook
A white-space persists in distributed and small-scale solar, where the deployment model can ease pressure on transmission and summer peak constraints. SATBA has advanced a 15 GW small-scale solar program spanning residential, commercial, and agricultural users (June 2026). This direction also fits the operational reality of grid congestion in core solar corridors, and it increases the case for hybrid configurations (solar plus storage) that support feeder-level reliability. That creates room for suppliers of hybrid inverters, batteries, and rooftop EPC and O&M services capable of scaling.
Financing and participation structures are also broadening. In June 2026, SATBA cited receiving more than USD 900 million in resources for renewable power plant development and outlined a solar project fund concept intended to enable public participation through share purchases, expanding capital sources beyond traditional bank-led project finance. At the same time, large anchor projects continue to validate industrial offtake and execution capability, including the staged commissioning of Mobarakeh Steel Company's 600 MW Aftab-e-Sharq development in Isfahan. These developments support opportunities across industrial captive solar, grid interconnection services, and localization-linked procurement for modules and balance-of-system equipment.
Recent Industry Developments
- June 2026: MAPNA Group inaugurated the 10 MW Shahinshahr solar plant in Isfahan province. The commissioning adds operating reference capacity for MAPNA in central Iran and strengthens developer credibility with SATBA-led procurement and corporate buyers seeking faster-to-build projects.
- January 2025: MAPNA Group and SATBA signed a memorandum of understanding for investment, construction, and operation of 3,000 MW of renewable power plants. The MoU established a large domestic development pipeline and signaled deeper participation by an Iranian EPC-developer in utility-scale renewables under SATBA frameworks.
- December 2024: The Ministry of Energy, with Tavanir involvement, launched a program to provide portable solar panels to nomadic households nationwide with beneficiaries paying 10% of the cost. The initiative strengthened the off-grid and mini-grid channel, creating demand for standardized small systems and last-mile service networks outside the main grid footprint.


Research Methodology Framework and Report Scope
Market Definition and Coverage
For this study, the Iran solar energy market is defined as solar-based power generation within Iran, measured using installed capacity additions and the operating installed base, and then reconciled with project execution and grid connection timelines.
Scope exclusions: We exclude solar equipment export activity that is not installed in Iran and any off-grid consumer devices that do not connect to a power system.
Segmentation Overview
- By Technology
- Solar Photovoltaic (PV)
- Concentrated Solar Power (CSP)
- By Grid Type
- On-grid
- Off-Grid
- By End-User
- Utility-Scale
- Commercial and Industrial (C&I)
- Residential
- By Component (Qualitative Analysis)
- Solar Modules/Panels
- Inverters (String, Central, Micro)
- Mounting and Tracking Systems
- Balance-of-System and Electricals
- Energy Storage and Hybrid Integration
Data Sources, Market Sizing, and Validation
Desk Research
Desk research was used to assemble the base facts that keep the model grounded in Iran-specific realities, especially power demand, the generation mix, and the pace of capacity build outs. We used public and official sources such as IRENA renewable capacity series, IEA electricity indicators, World Bank macro series, and national energy balance and electricity statistics where available.
To understand how solar projects move from announcement to commissioning, we also reviewed tender notices, project commissioning updates, and policy releases carried on reputed press and industry association websites. Company filings and investor materials were checked for project pipelines and EPC activity, and a paid subscription for company financials and news intelligence was used only to cross-check timelines and reported investment signals. The desk research sources listed here are illustrative, and we also pulled from other public datasets and documents for data collection, validation, and clarification.
Primary Interviews and Surveys
Interviews and surveys with participants in Iran cover developers, equipment suppliers, utilities, project financiers, and industrial users. Respondents help identify stalled or unreported projects, clarify procurement and pricing conditions, and distinguish announced capacity from projects that have reached construction or grid connection. Their input is also used to adjust secondary-data assumptions before the final analysis.
Distribution of primary research fieldwork respondents
| Company type | Respondent position |
|---|---|
| Top tier: 26% | CXOs: 15% |
| Mid tier: 49% | Functional/Unit leaders: 32% |
| Smaller Players: 25% | Managers: 53% |
Market-Sizing & Forecasting
Sizing starts with a top-down build that reconstructs the addressable solar capacity using Iran power demand, planned generation additions, and renewable policy targets, and then filters that total through grid readiness and the project execution pace. Once that total is formed, we corroborate it with selective bottom-up checks such as sampled project capacity roll ups from announced and under-construction plants, channel checks on delivery lead times, and typical capacity blocks used in utility scale and C&I projects.
Key inputs that guide the market model include installed capacity by year, commissioning schedules versus award dates, grid connection readiness, and the likely split between utility scale and distributed projects based on what developers are prioritizing. For forecasting, we run scenario analysis so constraints like financing availability, import logistics, and policy continuity can be varied without breaking the model logic. Where project data is incomplete, we apply conservative realization factors and timing lags, and then adjust after re-checking with primary responses.
Data Validation & Update Cycle
Validation is done through multiple checks so the final numbers do not rely on a single dataset or one interview thread. We compare outputs against independent signals such as power sector capacity totals, reported commissioning events, and macro indicators that should move in the same direction as solar build outs, then review outliers before sign-off.
A multi-step analyst review is followed, where assumptions are re-tested and the model is re-run after clarifications are received from follow-up calls. Reports refresh on an annual cycle, and interim updates are triggered when material events occur such as major policy changes, large project commissioning batches, or a visible shift in equipment availability. Before delivery, a final analyst pass is completed so clients receive the most current view available at that time.
Mordor Intelligence's Iran Solar Energy Market Sizing Compared With Other Published Estimates
Published market sizes for Iran solar energy can look far apart because some authors use different units, different inclusions, and different timing rules for when capacity is counted. Differences also come from whether the estimate is tied to installed capacity, project investment value, or a broader ecosystem view that includes services beyond power generation.
Installed capacity versus revenue coverage is the biggest gap driver. In Mordor Intelligence, the core number is tied to commissioned solar capacity in Iran, while some published figures present a USD value that also includes system design, equipment sales, installation, and O&M services.
Benchmark comparison
| Source | Market Size | Gaps in Research Methodology |
|---|---|---|
| Mordor Intelligence | USD 3.41 B (2026) | |
| Global Consultancy A | USD 1.67 B (2024) | This estimate is stated as a revenue number for a wider solar ecosystem, which can include manufacturing, financing, installation, and operations, so it will not line up with a capacity-led view that tracks commissioning timing. |
| Trade Journal B | USD 1.80 B (2024) | The published size is also in USD and appears to mix time references, and the method reads more dependent on generalized growth rates than on project level commissioning schedules and grid connection progress. |
The spread in the table is mainly explained by what each source counts as market activity and how timing is handled for projects that are awarded but not yet commissioned. By keeping assumptions anchored to commissioning progress checks and then re-validating lags through field feedback, the model stays traceable to repeatable steps and observable build-out signals.


Key Questions Answered in the Report
How large is the Iran solar energy market in 2026?
Installed capacity reached 3.41 GW in 2026 and is projected to hit 16.14 GW by 2031.
What annual growth rate is forecast for Iranian solar installations?
Capacity is set to advance at a 36.45% CAGR from 2026 to 2031.
Which segment leads solar deployment in Iran?
Utility-scale plants above 5 MW held 74.62% share of installed capacity in 2025.
What share does solar PV hold in Iran’s technology mix?
Solar PV commands 97.43% of installations and continues to grow due to favorable economics.
How does the FiT scheme support project finance?
SATBA offers 20-year, FX-indexed purchase agreements that eliminate offtaker risk for grid-connected projects.
What impact do localization mandates have on supply chains?
Joint-venture factories assembling modules and inverters reduce foreign-exchange exposure and create skilled jobs in Tehran and Isfahan.
Page last updated on:


 Your data is secure and never sold or shared.


