
Market Overview
| Study Period | 2021 - 2031 |
|---|---|
| Forecast Data Period | 2026 - 2031 |
| Base Year Market Size (2025) | USD 37.10 Billion |
| Market Size (2026) | USD 39.18 Billion |
| Market Size (2031) | USD 51.51 Billion |
| Growth Rate (2026 - 2031) | 5.62 % |
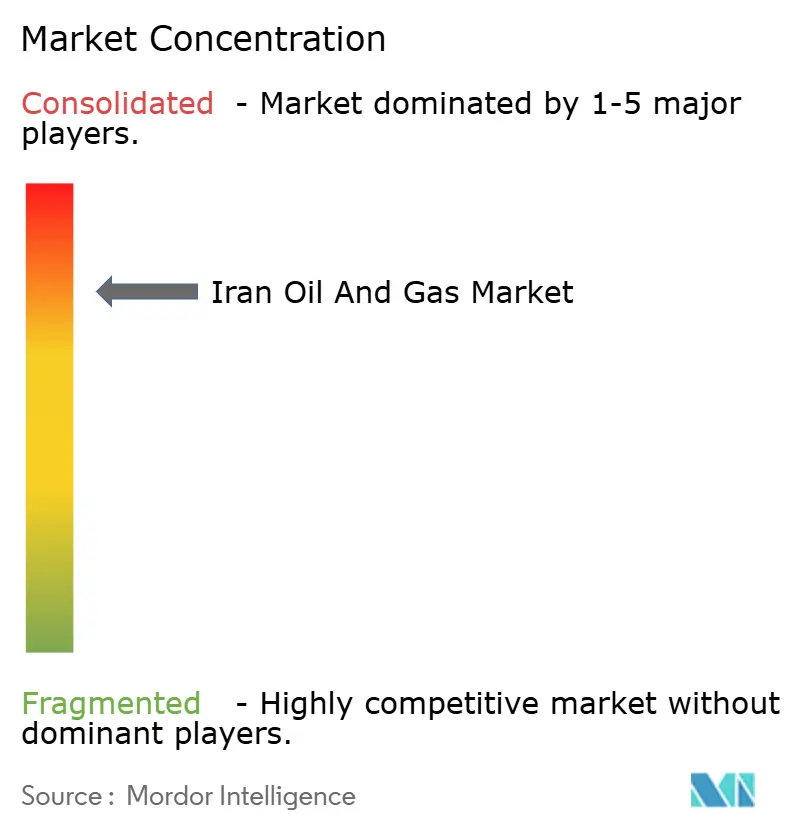
| Market Concentration | High |
Major Players *Disclaimer: Major Players sorted in no particular order Image © Mordor Intelligence. Reuse requires attribution under CC BY 4.0. | |
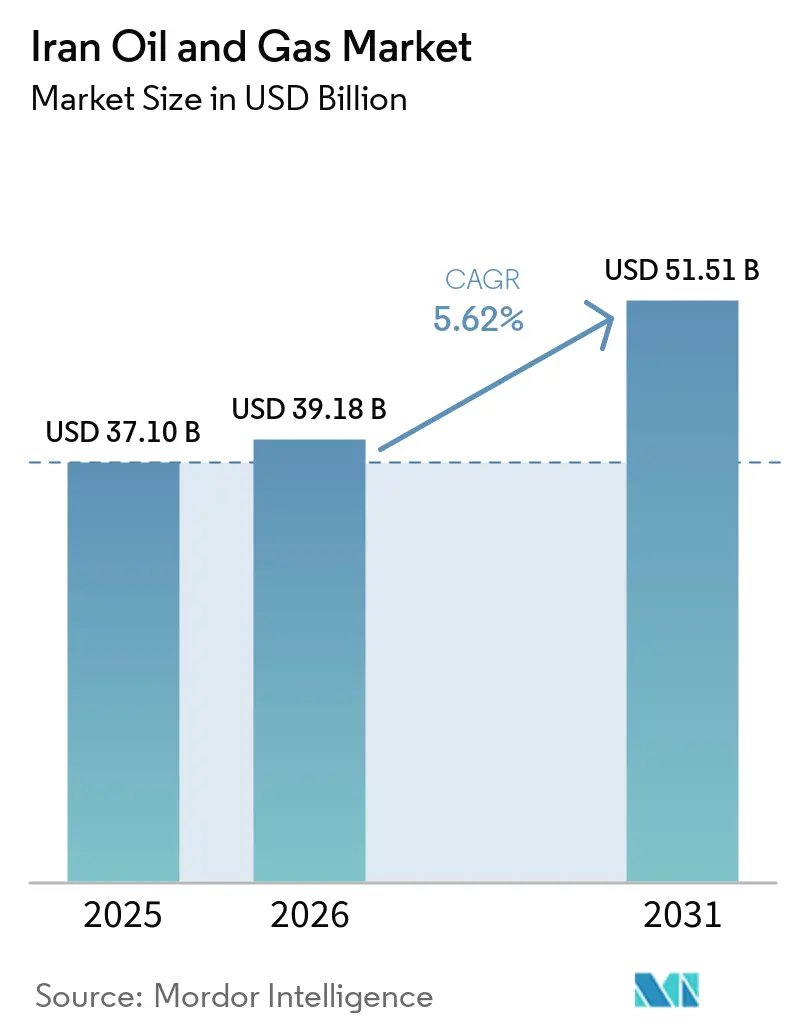
Iran Oil and Gas Market Analysis by Mordor Intelligence
Iran Oil And Gas market size in 2026 is estimated at USD 39.18 billion, growing from 2025 value of USD 37.10 billion with 2031 projections showing USD 51.51 billion, growing at 5.62% CAGR over 2026-2031.
Robust reserve availability, state-backed capital deployment, and resilient export flows underpin this trajectory even as sanctions pressure persists. The upstream sector anchors revenue, as Iran is the fourth-largest crude producer in OPEC. Meanwhile, the downstream segment is growing faster, with domestic firms adding fluid catalytic cracking and condensate-splitting capacity to increase product yields. Onshore production remains the backbone of the Iranian oil and gas market, but offshore investments at South Pars are accelerating to protect reservoir pressure and sustain natural-gas output. Asset deployment overwhelmingly favors development projects, yet exploration spending is rising because reserve replacement has become a policy imperative. High market concentration persists: The National Iranian Oil Company (NIOC) and its subsidiaries continue to dictate most decisions, although private and quasi-state contractors now win multi-billion-dollar tenders that were once the domain of foreign major oil companies.
Key Report Takeaways
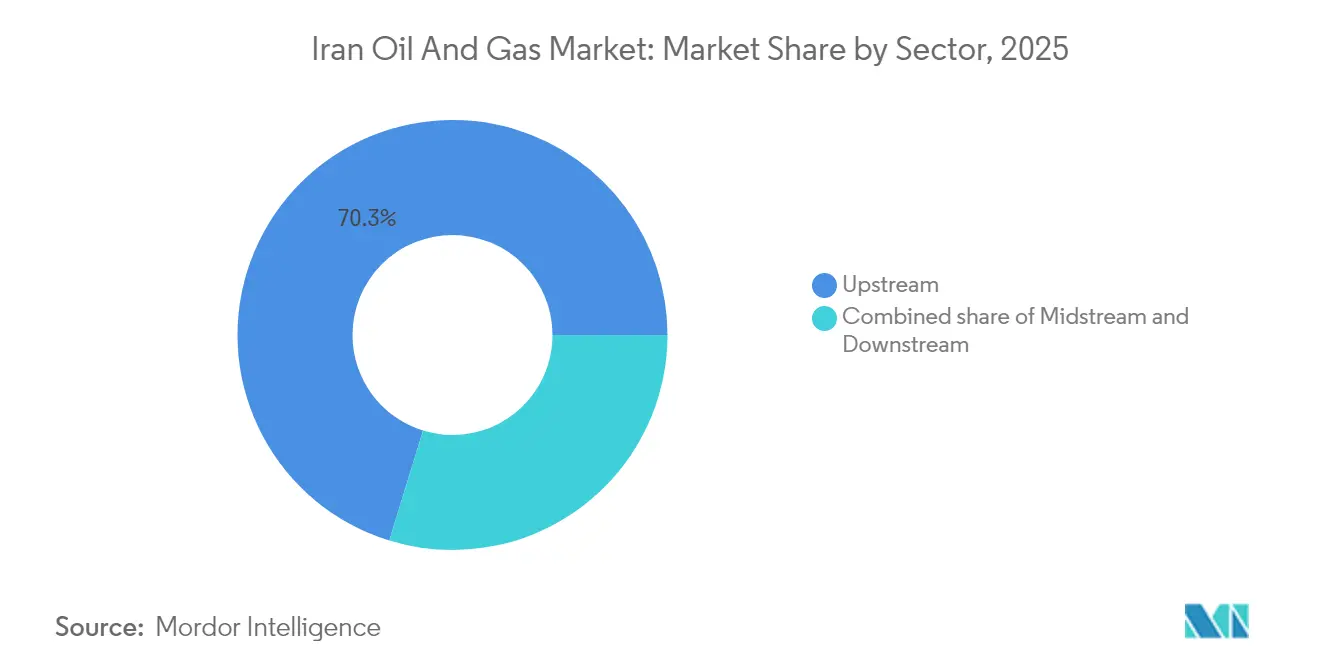
- By sector, the upstream segment held 70.25% of the Iranian oil and gas market share in 2025, while midstream activities are projected to post a 7.18% CAGR through 2031.
- By location, onshore operations accounted for 70.75% of the Iranian oil and gas market size in 2025, and offshore investments are projected to advance at a 7.62% CAGR over 2026-2031.
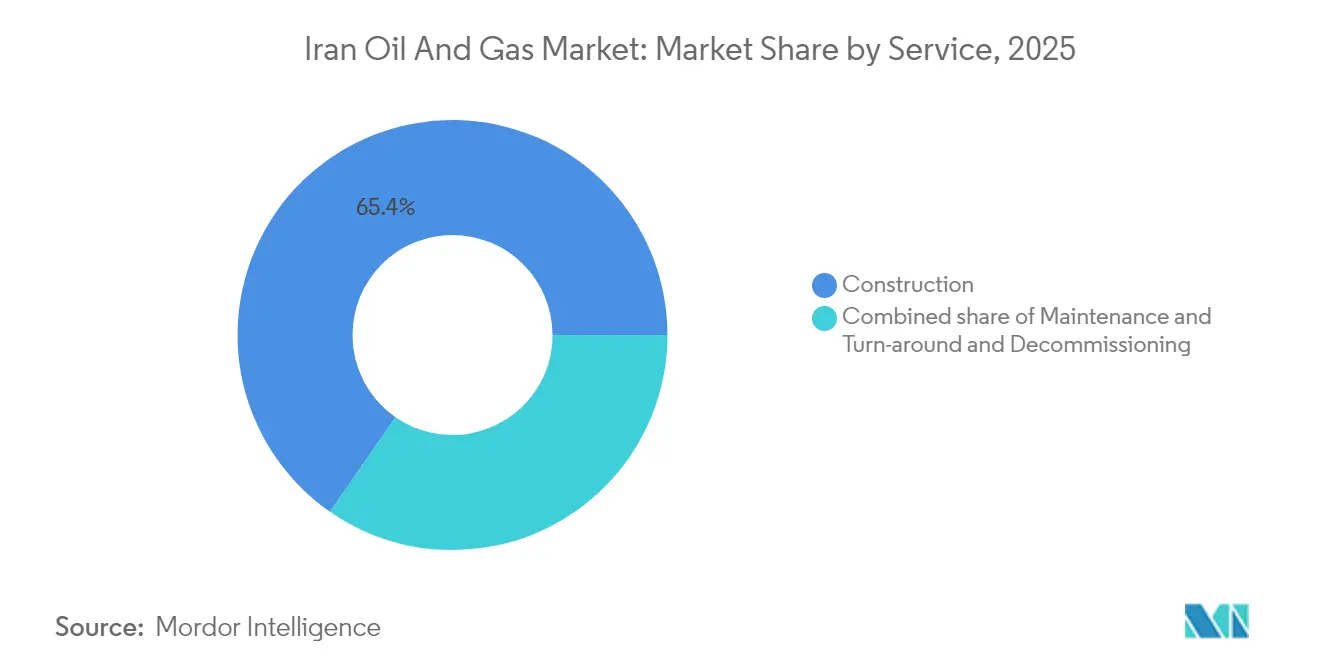
- By service, construction accounted for a 65.35% share of the Iranian oil and gas market size in 2025, and is projected to expand at a 6.28% CAGR through 2031.
Note: Market size and forecast figures in this report are generated using Mordor Intelligence’s proprietary estimation framework, updated with the latest available data and insights as of 2026.
Market Trends and Insights
Drivers Impact Analysis of Iran Oil and Gas Market*
| Driver | (~) % Impact on CAGR Forecast | Geographic Relevance | Impact Timeline |
|---|---|---|---|
| Expansion of South Pars gas-field phases | +1.2% | National, with primary impact in Persian Gulf offshore | Medium term (2-4 years) |
| Post-JCPOA access to LNG technology & know-how | +0.8% | National, with export potential to Asia-Pacific | Long term (≥ 4 years) |
| Domestic fuel-subsidy reform boosting retail prices | +0.9% | National, with urban concentration effects | Short term (≤ 2 years) |
| Rising petrochemical demand from Asia-Pacific | +1.1% | National production, Asia-Pacific export markets | Medium term (2-4 years) |
| Development of mini-refineries for remote regions | +0.6% | Regional, focused on underserved provinces | Medium term (2-4 years) |
| AI-driven reservoir modelling cutting E&P CAPEX | +0.4% | National, concentrated in major field operations | Long term (≥ 4 years) |
| Source: Mordor Intelligence | |||
Expansion of South Pars Gas-Field Phases
South Pars is the largest single growth lever for the Iranian oil and gas market. NIOC signed USD 17 billion of pressure-boosting contracts that cover new compressor platforms, subsea lines, and additional wells. The shared reservoir holds 14 trillion cubic meters of gas and already supplies 700 million cubic meters per day; however, production would begin to decline from 2027 without the upgrades. Phase 11 has recently added a seventh well, which will increase daily flow by 28 million m³ once all platforms are online(1). Phase 14 operates at a design throughput of 18.25 billion m³ per year, providing condensate feedstock for domestic refineries. The investment protects recovery rates vis-à-vis Qatar, whose faster drawdown could otherwise trigger a 42 million m³ annual Iranian loss by 2029(2).
Post-JCPOA Access to LNG Technology and Know-How
Easing technology barriers since 2024 has revived the Iran LNG project, which targets 10 million tonnes per annum (tpa) based on South Pars Phase 12 gas(3). A preliminary agreement with OMV and a USD 500 million EPC award to a consortium including Daelim highlight renewed European and Asian participation. Iran holds 1,200 trillion cubic feet (tcf) of gas reserves, but remains a negligible LNG exporter because its existing terminals were never completed. Technology inflows enable the monetization of stranded gas, diversification away from sanctions-exposed pipelines, and positioning as a swing supplier to Asia once trains start operating by the late 2020s. Domestic valve and pump makers also gain learning-curve benefits as they localize high-pressure cryogenic components for future schemes.
Domestic Fuel-Subsidy Reform Boosting Retail Prices
Fuel-subsidy costs of USD 80-100 billion a year prompted the government to halve monthly subsidized gasoline quotas to 42.5 million liters and raise prices to 20,000 rials per liter in 2025. Semi-subsidized prices climbed to 80,000 rials per liter, narrowing the gap with import parity and deterring excessive consumption. Iran’s gasoline demand had reached 122 million liters per day, exceeding refinery output and resulting in USD 2 billion in import bills each year. The reform encourages motorists to adopt conservation practices, frees condensate for use as petrochemical feedstock, and enhances fiscal flexibility for upstream spending. Approved premium-grade imports at market rates focus the subsidy on lower-income households while nudging affluent drivers to pay cost-reflective prices.
Rising Petrochemical Demand from Asia-Pacific
Iran produced 69 million tons of petrochemicals in 2023 and plans to exceed 80 million tons in 2024, backed by 10 new complexes. Export revenue already stands at USD 16 billion, with China, India, and other Asian buyers accounting for the majority of volumes. Competitive feedstock derived from low-cost gas enables Iranian producers to price attractively, even when shipping via third-party traders, thereby overcoming sanctions barriers. The National Petrochemical Company’s integration strategy positions Iran to climb the value chain into specialty products that carry higher margins and lower transport intensity. Domestic demand for plastics, fertilizers, and solvents provides a stable baseload, protecting the Iranian oil and gas market from export volatility.
Restraints Impact Analysis of Iran Oil and Gas Market*
| Restraint | (~) % Impact on CAGR Forecast | Geographic Relevance | Impact Timeline |
|---|---|---|---|
| US secondary sanctions reinstatement risk | -1.8% | Global, with primary impact on export markets | Short term (≤ 2 years) |
| Ageing onshore production infrastructure | -0.7% | National, concentrated in mature fields | Long term (≥ 4 years) |
| Limited foreign financing routes via SWIFT | -0.5% | Global, affecting international partnerships | Medium term (2-4 years) |
| High gas re-injection requirement for mature fields | -0.3% | National, primarily onshore legacy fields | Long term (≥ 4 years) |
| Source: Mordor Intelligence | |||
US Secondary Sanctions Reinstatement Risk
Washington’s secondary sanctions hinder tanker insurance, banking, and spare parts procurement, thereby increasing operational costs and limiting capital for expansion. New designations in 2025 targeted a network facilitating shadow-fleet deliveries to China and imposed penalties on Iran’s oil minister. Iran’s crude exports recovered to about 1.65 mbpd in 2025, yet remain vulnerable to stricter maritime monitoring that could slash flows and dent fiscal receipts. Financial isolation also delays payments to EPC contractors, disrupts equipment imports, and limits foreign direct investment, which is essential for advanced enhanced oil recovery methods.
Ageing Onshore Production Infrastructure
Roughly 85% of Iranian refineries were built before 1979 and need comprehensive retrofits to meet Euro 4/5 fuel specs(4). Current configurations convert 30% of crude into mazut and bitumen, escalating domestic pollution and undercutting product margins. Decline rates at giants such as Masjid Soleyman highlight the urgency: absence of modern artificial-lift systems and corrosion control steadily erode throughput. A USD 43 billion modernization blueprint stalled after the JCPOA collapse, leaving projects like the long-planned RHU upgrade at Abadan behind schedule. The government now prioritizes selective revamps such as the eco-friendly residue-hydroconversion unit at Isfahan, but funding gaps slow a comprehensive overhaul.
*Our forecasts treat driver/restraint impacts as directional, not additive. The impact forecasts reflect baseline growth, mix effects, and variable interactions.
Iran Oil and Gas Market Segment Analysis
By Sector:
Upstream Dominance Drives Market LeadershipThe upstream segment contributed USD 26.06 billion to the Iran oil and gas market size in 2025, translating into a commanding 70.25% share of the Iran oil and gas exploration and production market for the year. Meanwhile, midstream activities are forecast to expand at a 7.18% CAGR through 2031 as new pipelines and storage terminals come online. National Iranian Oil Company has signed USD 13 billion of development contracts that will lift output by 350,000 bpd across six fields, with Azadegan alone slated to reach 550,000 bpd once surface facilities, gas-injection units, and gathering networks are completed. Midstream momentum centers on the 300,000 bpd crude line linking Bandar Abbas refinery to interior supply hubs; this line removes coastal tanker shuttles and saves USD 80 million per year in freight. Downstream gains are expected to come from the fully domestic fourth phase of the Persian Gulf Star Refinery, which will add 120,000 bpd of condensate capacity, positioning Iran as a consistent gasoline exporter rather than importer.
Iran’s sectoral mix reflects an adaptive response to sanctions that limit foreign technology; local contractors now manage complex modules, such as delayed-coking and hydrocracker trains, previously handled by international engineering firms. Domestic fabrication of pumps, valves, and catalysts curtails procurement delays and anchors cost in local currency. Petrochemical integration provides an additional demand sink; output reached 100 million tons in 2024, a 10% rise that cements Iran’s status as the Gulf’s second-largest supplier of polymers and fertilizers. Upstream still dominates cash flow because every incremental barrel secures foreign exchange; however, the parallel expansion of midstream and downstream facilities mitigates export disruptions and captures higher margins from refined and petrochemical products.

By Location:
Onshore Assets Anchor Production BaseOnshore resources delivered 70.75% of the Iranian oil and gas market size in 2025 on the strength of long-established fields in Khuzestan, while offshore output in the Persian Gulf and Sea of Oman is projected to rise at a 7.62% CAGR to 2031, lifting its Iranian oil and gas market share over the forecast horizon. The land-based dominance stems from giant reservoirs—Azadegan, Azar, and Masjid Soleyman—that collectively hold 38 billion barrels in situ and enjoy paved-road access, water injection grids, and experienced labor. Offshore acceleration relies on continued South Pars development; total spending has reached USD 90 billion, with an additional USD 17 billion earmarked for pressure boosting to keep pace with Qatari withdrawals from the shared dome.
Geographic allocation also accounts for the thirty-plus shared reservoirs where Iran faces competitive drawdown by its neighbors; the Forouzan oilfield illustrates the gap, as Saudi Arabia lifts fourteen times more from the same structure. Offshore projects, therefore, carry strategic weight: South Pars now supplies 70% of national gas demand and ranks as the world’s largest standalone gas reserve. Onshore economics still appeal—lower capex, easier logistics, and rapid payback—yet deeper offshore reservoirs promise superior long-run returns and diversify feedstock for future LNG and petrochemical trains. Together, location-specific investments strike a balance between near-term cash generation and long-term security of supply.
By Asset Type:
Construction Activities Lead Investment FocusConstruction projects accounted for 65.35% of Iran's oil and gas market share in 2025 and are expected to advance at a 6.28% CAGR through 2031, making infrastructure build-out the largest single allocation of capital across the value chain. The 20-year Azadegan contract illustrates scale: drilling 420 new wells, laying 460 km of flowlines, and installing two gas-lift compression stations will lift field capacity from 205,000 bpd to 550,000 bpd. Domestic EPC leader Khatam al-Anbiya heads the fourth phase of Persian Gulf Star Refinery, highlighting a policy push to complete megaprojects with Iranian talent and locally sourced steel, catalysts, and control systems.
Construction's appeal reflects the realities of sanctions; civil works and mechanical erection rely on home-grown skills rather than imported digital cores or proprietary software. Parallel activity encompasses eco-friendly residue hydroconversion at Isfahan Refinery and ten new petrochemical plants, which will collectively increase aggregate capacity to surpass 95 million tons by 2025. Pipeline mileage is expected to reach 15,000 km by March 2025, reducing truck haulage and lowering product losses on long inland routes. Prioritizing shovel-ready construction mitigates technology bottlenecks, secures employment, and prepares a platform for future enhanced-oil-recovery and LNG projects once sanctions ease.
Geography Analysis
Domestic concentration shapes the Iranian oil and gas market. The Persian Gulf dominates offshore activity, led by South Pars with 14 tcm of gas reserves and a daily output of 700 million m³ that underwrites nearly all LNG and petrochemical feedstock ambitions. Southern coastal provinces host condensate splitters and export jetties, minimizing the distance between gas processing, refining, and tanker loading. Khuzestan, in the southwest, anchors onshore crude production with fields that together supply over half of the nation's production.
Shared-field dynamics influence spending. Iran competes with Iraq across 12 reservoirs and with Qatar in the South Pars field, prompting accelerated drilling schedules and pressure-maintenance programs to prevent cross-border migration. The Caspian Sea acreage remains underexplored; Iran is the only littoral state not producing oil, despite holding 0.5 billion barrels of proven reserves, which are constrained by depth, ice conditions, and a lack of deepwater rigs. Moving east, the Jask terminal on the Gulf of Oman provides a strategic bypass to the Strait of Hormuz, giving Iran redundancy against maritime chokepoint disruptions.
Pipeline geography extends influence. Iran, Turkmenistan, and Iraq signed a swap that will move 10 bcm of Turkmen gas through Iranian lines to Iraq, earning transit fees and firming regional relevance. New 42-inch crude and product pipelines link inland refineries to export ports, freeing capacity at Kharg Island and diversifying outlets. Despite its hydrocarbon heft, renewable deployment lags: installed clean-power capacity stands at 75 MW, versus a 2,500 MW target, which is well behind that of Saudi Arabia and Turkey. Geography, therefore, affords both opportunities and gaps that steer forthcoming capital allocation.
Regulatory Landscape
Iran's oil and gas sector is governed by the Ministry of Petroleum (MOP) under the Law on the Duties and Powers of the Ministry of Oil (2012), with operational execution concentrated in state entities including National Iranian Oil Company (NIOC), National Iranian Gas Company (NIGC), and National Iranian Oil Refining and Distribution Company (NIORDC). Upstream investment and development continue to rely primarily on the Iran Petroleum Contract (IPC) framework, which structures contractor participation through service-style and performance-linked arrangements rather than concessionary ownership.
Recent policy changes focus on faster project processing and more flexible contracting to keep developments moving under sanctions constraints. In June 2025, the Economic Council issued a regulation to facilitate the conclusion and implementation of upstream oil and gas contracts, including defined timelines for NIOC (three weeks for proposal handling and two months for negotiations). An October 2023 amendment to the IPC model also allowed contractors to award limited second-tier subcontracts (below 0.5% of direct capital cost) without prior Joint Management Committee approval, reducing administrative friction for field services and smaller scope packages.
Competitive Landscape
The Iranian oil and gas market is highly concentrated around state entities. NIOC controls upstream licensing and production, while the National Iranian Gas Company manages processing and trunklines. Pars Oil and Gas Company leads South Pars operations. Domestic EPC and service firms, such as Petropars, Khatam al-Anbiya Construction, and MAPNA Group, secured USD 17 billion in South Pars pressure-boosting contracts in 2025, reflecting a strategic pivot towards nationalizing project delivery. Localization is now an explicit policy because sanctions cut access to Western majors.
Strategic moves increasingly emphasize vertical integration. MAPNA, originally a turbine maker, now drills onshore wells and supplies refinery equipment, embedding itself across the value chain. Revolutionary Guards entities have expanded their control over crude marketing, coordinating shadow-fleet logistics, and offering price discounts to Asian refiners that provide cash or barter goods(5). Such control tightens market concentration yet ensures continuity when external financing falters.
Innovation surfaces despite isolation. Iran’s Information Technology Organization has launched six AI megaprojects aimed at narrowing a 15-25% energy supply-demand gap by optimizing industrial consumption and predicting pipeline maintenance. Pilot deployments in upstream reservoir modeling aim to enhance recovery factors without relying on foreign consultants. Companies capable of merging field data with AI tools gain a commercial edge as NIOC rewards efficiency gains with performance-based contracts.
Iran Oil and Gas Industry Leaders
-
National Iranian Oil Company (NIOC)
-
National Iranian Gas Company (NIGC)
-
National Iranian Oil Refining & Distribution Company (NIORDC)
-
National Petrochemical Company (NPC)
-
Petropars Ltd
- *Disclaimer: Major Players sorted in no particular order
Iran Oil and Gas Market Companies Covered in this Report
- National Iranian Oil Company (NIOC)
- National Iranian Gas Company (NIGC)
- National Iranian Oil Refining & Distribution Company (NIORDC)
- National Petrochemical Company (NPC)
- Iranol Oil Company
- Pars Oil Company
- PetroIran Development Company (PEDCO)
- Petropars Ltd
- Dana Energy
- Mapna Group (Oil & Gas Division)
- Persia Oil & Gas Industry Development Co.
- Pasargad Energy Development Co.
- Tadbir Energy Development Group
- Iranian Offshore Engineering & Construction Co. (IOEC)
- National Iranian Drilling Company (NIDC)
- Sina Energy Development Co.
- Khatam al-Anbiya Construction HQ (Oil division)
- Ghadir Investment (Oil & Gas)
- Omid Investment Management (Energy)
Market Opportunities and Future Outlook
Near-term whitespace centers on execution capacity that protects base production and eases domestic supply imbalances, particularly in mature oil provinces and across the national gas grid. NIOC's January 2026 investment contracts valued at USD 2.7 billion for 20 onshore drilling rigs and crude processing equipment across fields such as Mansouri, Abtimur, Ramshir, and Golkhari point to sustained demand for domestically supplied drilling, workover, and surface processing packages, along with associated maintenance and construction scope. Connectivity projects also offer a parallel track to reduce bottlenecks between production, refining, and demand centers, with late-2025 completion of the 102 km Sabzab to Tang-e Fani crude pipeline and the start of stable crude transfers to Shazand refinery in January 2026.
Offshore gas stability and new reservoir additions define a second opportunity set for EPC, well services, subsea, and compression-related capabilities. Pars Oil and Gas Company actions in 2026, including an environmental permit for South Pars Phase 11 (Platform A) and completion of infill wells at South Pars Phases 15 and 3, reinforce the need for pressure-management and infill-drilling supply chains tied to South Pars, which already supplies a large share of national gas demand. On the demand-management side, NIGC signed programs with energy service companies to cut end-user consumption by 25% to 35% under the Seventh Development Plan, creating commercial space for metering, leak detection, network rehabilitation, and industrial efficiency solutions. The government's Seventh Development Plan target of 12,000 MW renewables by end-2026, plus mandates for government agencies to raise their solar share (20% to 40%), also supports gas-to-power balancing initiatives, with knock-on effects for upstream gas allocation and midstream reliability projects such as the Miandoab to Ajabshir gas pipeline (96% complete, commissioning targeted for November 2026).
Recent Industry Developments in Iran Oil and Gas Market
- March 2026: National Iranian Gas Company (NIGC) announced a push to accelerate completion of unfinished gas network projects and launched the Leak-Free 1405 initiative targeting zero-leak performance. The program elevates pipeline integrity, monitoring, and repair scope across the transmission and distribution system, aligning capex with reliability and loss-reduction priorities during periods of supply tightness.
- September 2025: National Iranian Oil Company (NIOC) signed a USD 600 million, 20-year contract with Mobarakeh Steel Co. and Iranian Offshore Engineering and Construction Co. (OIEC) to develop the Madar gas field. The deal strengthens domestically anchored execution for upstream gas additions and supports supply reinforcement for the national grid amid technology and financing constraints.
- March 2025: NIOC signed contracts totaling about USD 17 billion with Petropars, Khatam al-Anbiya, OIEC, and MAPNA to execute the South Pars Pressure Boosting Project across seven hubs. The investment formalized a large, multi-contractor offshore program focused on compressor platforms, subsea lines, and wells, which directly supports Iran's ability to sustain South Pars output and stabilize gas supply for power and industry.
Iran Oil and Gas Market Report Scope and Research Methodology
Market Definition and Coverage
For this report, the market is defined as the value generated from oil and gas activity within Iran across upstream, midstream, and downstream operations, including onshore and offshore work, and core services supporting assets across their life cycle.
Scope exclusions: The sizing does not treat broader energy and power value chains (such as electricity generation) and non-hydrocarbon mining as part of the market.
Segments Covered in This Report
- By Sector
- Upstream
- Midstream
- Downstream
- By Location
- Onshore
- Offshore
- By Service
- Construction
- Maintenance and Turn-around
- Decommissioning
Data Sources, Market Sizing, and Validation
Desk Research
Desk research was used to set the fact base for Iran production, processing, and system constraints, before numbers were modeled. We relied on public sources such as OPEC and IEA statistical releases, EIA country briefs, UN Comtrade trade series, and World Bank macro indicators to ground volumes, pricing context, and FX assumptions.
To translate sector activity into a value model, we also reviewed company releases and audited statements where available, along with investor presentations, technical papers, and credible press coverage on field development, pipeline availability, and refinery operations. Where the public trail became thin, we used paid subscriptions for company financials and intelligence, as well as shipment-level import and export signals for selected equipment and materials, mainly to validate direction and timing rather than to force exact totals. These desk sources are illustrative and not exhaustive, and many other references were used for data collection, cross-checks, and clarification.
Primary Interviews and Surveys
Our Iran fieldwork covers CXOs, functional and unit leaders, and managers across upstream, midstream, downstream, and oilfield service activities. Interviews and surveys help clarify realized prices, project timing, utilization, sanctions effects, and unreported activity that may not appear in secondary data. We compare responses with the model to investigate gaps before accepting the final assumptions.
Distribution of primary research fieldwork respondents
| Company type | Respondent position |
|---|---|
| Top tier: 27% | CXOs: 18% |
| Mid tier: 48% | Functional/Unit leaders: 32% |
| Smaller Players: 25% | Managers: 50% |
Market-Sizing & Forecasting
The core model starts with a top-down build that reconstructs Iran activity using production and processing throughput indicators, and then applies service and cost-intensity assumptions across upstream, midstream, and downstream. The totals were corroborated with selective bottom-up approximations, such as sampled project spend checks, typical service mix by asset type, and a limited ASP x volume logic for repeatable items, which then helped adjust the final numbers when mismatches showed up.
Key inputs used in the model included crude and gas production levels, refinery utilization patterns, onshore versus offshore development mix, pipeline and storage additions, and service-day or maintenance intensity assumptions that change with asset age. Forecasts were built using scenario analysis, because sanctions environment, project slippage, and FX timing can shift year-to-year outcomes even when longer-term demand drivers stay similar. Where bottom-up information was missing for smaller projects, assumptions were scaled using comparable asset classes and then reviewed again during validation calls.
Data Validation & Update Cycle
Model outputs were checked against independent signals such as production trends, public project milestones, and macro indicators that typically move sector spending, and then any large variances were investigated before sign-off. Anomaly checks were done at multiple levels, including year-over-year jumps, implied unit economics, and segment shares that drifted beyond realistic bounds, followed by an internal review across analysts.
The report is refreshed annually, and interim updates are made when material events change supply outlook, pricing assumptions, or project execution timing. If new disclosures or credible market signals materially shift a core input, experts are re-contacted and the assumptions are re-run so the published view stays current.
Mordor Intelligence's Iran Oil and Gas Market Estimate Compared With Other Published Estimates
Published market sizes for Iran oil and gas can look far apart, even when similar time windows are used, because each publisher draws the market line differently and also normalizes prices and FX in its own way. Differences also come from which activity indicators are trusted most, and how recently assumptions were refreshed.
Some external estimates fold in wider energy and end-use spending that sits outside oil and gas operations, and then the value grows quickly as more end-user categories get added. In Mordor Intelligence, the value is limited to upstream, midstream, and downstream activity inside Iran, with onshore and offshore coverage, and with services counted only when they are tied to construction, maintenance and turn-around, or decommissioning on oil and gas assets.
Benchmark comparison
| Source | Market Size | Gaps in Research Methodology |
|---|---|---|
| Mordor Intelligence | USD 37.10 B (2025) | |
| Global Consultancy A | USD 80.00 B (2024) | Uses a 2024 base and presents a broader construct that can include end-user energy consumption and energy-adjacent revenues, which lifts totals compared with an activity-led oil and gas value chain view. |
| Industry Publisher B | USD 56.04 B (2025) | Centers on exploration and production spend and company coverage, which can over-attribute upstream capex to the full market and can miss midstream and downstream balancing checks tied to throughput and service intensity. |
The spread in the table is mainly explained by scope, followed by base-year choice and refresh timing, which can shift value even when physical activity changes slowly. By keeping the build traceable to sector activity indicators and then pressure-testing it with practical cross-checks, the final number stays easier to reproduce and to compare across years.
Key Questions Answered in the Report
What is the current size of the Iran oil and gas market?
The Iran oil and gas market size is USD 39.18 billion in 2026 and is forecast to reach USD 51.51 billion by 2031.
Which segment holds the largest Iran oil and gas market share?
The upstream segment leads with 70.25% share in 2025, driven by extensive crude and gas extraction activities.
How fast is the midstream sector growing?
Midstream activities are forecast to expand at a 7.18% CAGR through 2031 as new pipelines and storage terminals come on line.
Why is South Pars critical for Iran’s gas outlook?
South Pars supplies 700 million m³ of gas daily and commands major investment to maintain pressure, making it central to domestic consumption and prospective LNG exports.
What risks could slow Iran oil and gas market growth?
Secondary US sanctions and ageing onshore infrastructure pose the greatest downside risks because they limit financing, technology access, and refinery modernization.