
IPM Pheromone Market Size and Share
Market Overview
| Study Period | 2021 - 2031 |
|---|---|
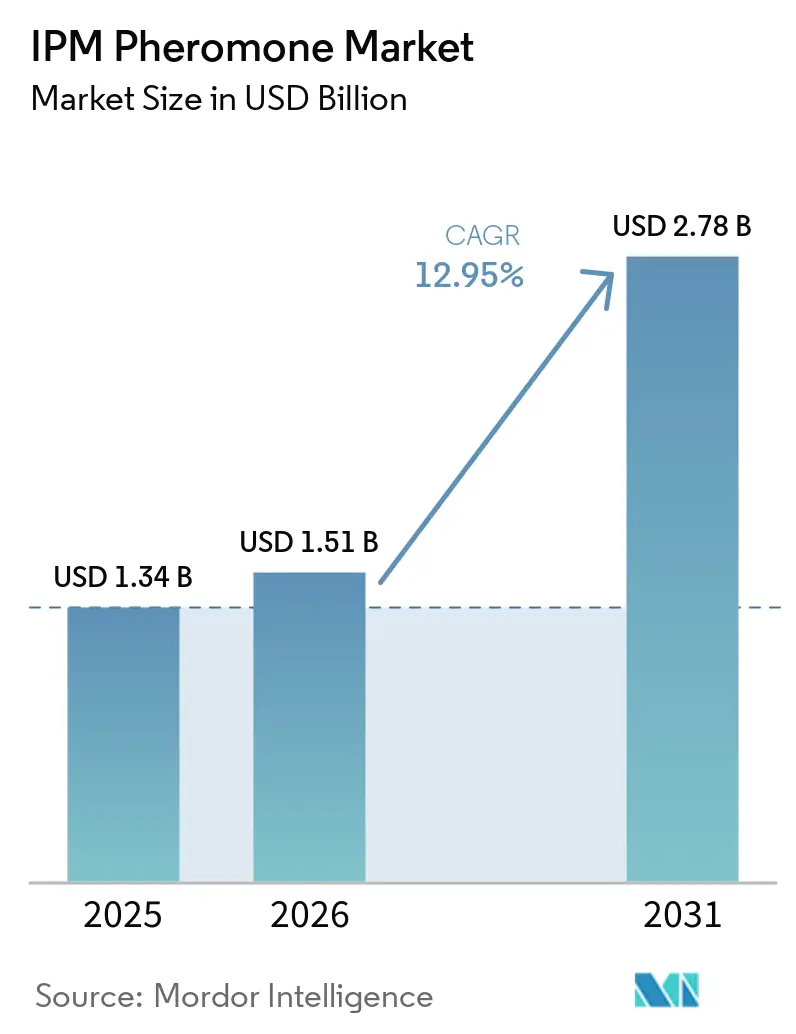
| Market Size (2026) | USD 1.51 Billion |
| Market Size (2031) | USD 2.78 Billion |
| Growth Rate (2026 - 2031) | 12.95 % |
| Fastest Growing Market | Asia Pacific |
| Largest Market | Europe |
| Market Concentration | Medium |
Major Players *Disclaimer: Major Players sorted in no particular order Image © Mordor Intelligence. Reuse requires attribution under CC BY 4.0. | |
IPM Pheromone Market Analysis by Mordor Intelligence
The IPM pheromone market size is expected to grow from USD 1.34 billion in 2025 to USD 1.51 billion in 2026 and is forecast to reach USD 2.78 billion by 2031 at 12.95% CAGR over 2026-2031. Robust demand stems from tightening residue limits, shrinking arable land, carbon-credit incentives, and subsidy programs that lower entry barriers. Mating disruption dominates perennial crops because season-long efficacy reduces spray labor, while mass trapping gains momentum as precision-agriculture tools pinpoint pest hotspots. Biodegradable dispensers, microencapsulation advances, and fermentation-based synthesis fortify competitive moats for incumbents. Europe leads adoption under the Sustainable Use of Pesticides Directive, but Asia-Pacific delivers the fastest growth on the back of China’s Green Development Plan and India’s smallholder subsidies. North America monetizes organic premiums, whereas South America and Africa present white-space opportunities as export horticulture expands.
Key Report Takeaways
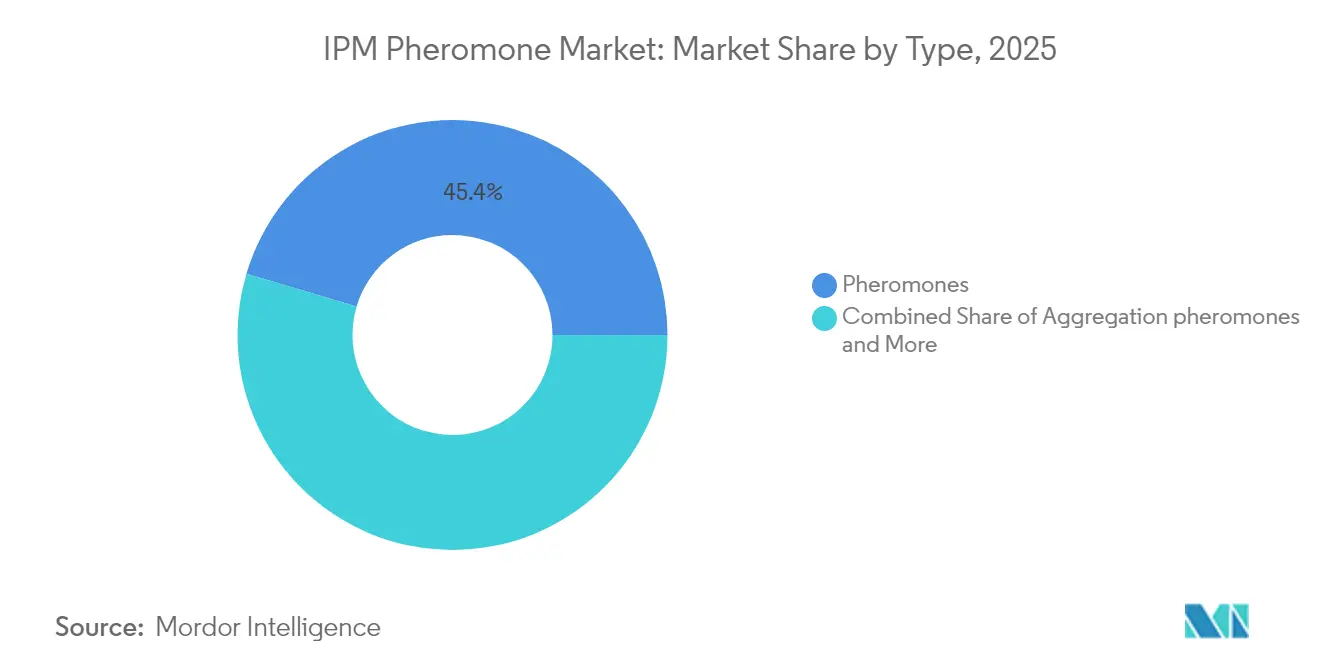
- By type, pheromones held a 45.40% revenue share in 2025, while aggregation pheromones are projected to expand at a 14.85% CAGR through 2031.
- By function, mating disruption held 51.60% of IPM pheromone market share in 2025, and mass trapping is forecast to register the fastest 14.10% CAGR to 2031.
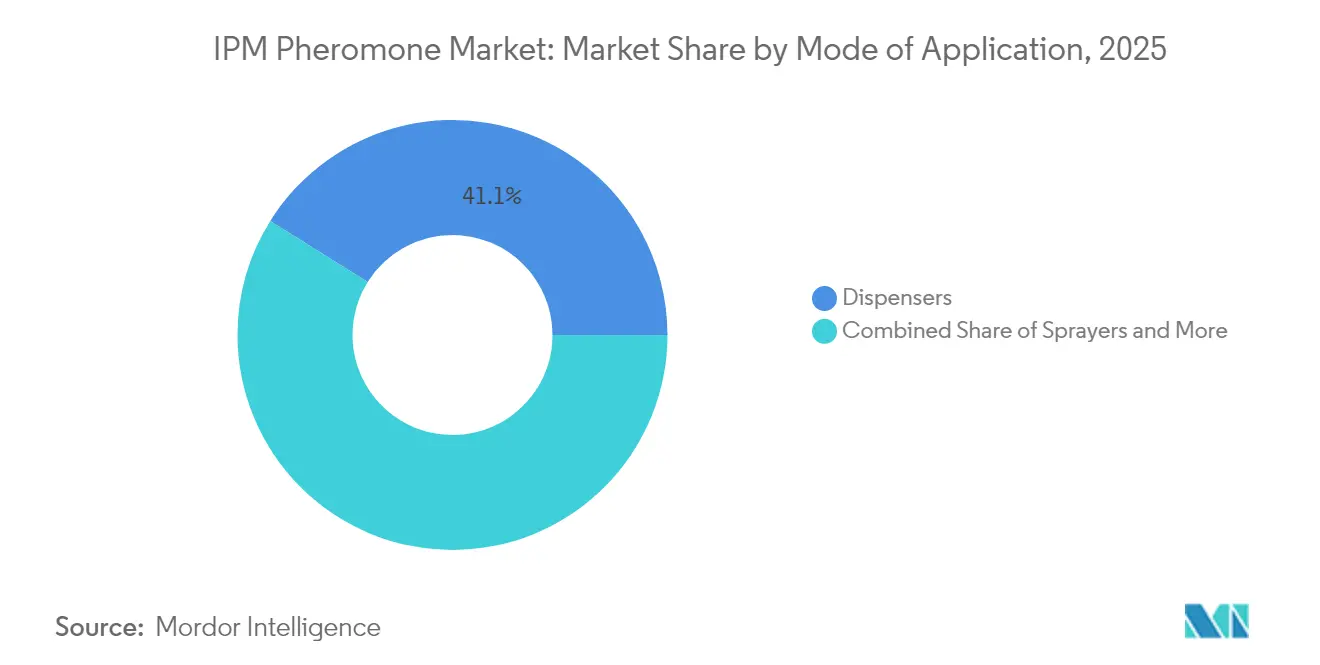
- By mode of application, dispensers commanded 41.10% of IPM pheromone market share in 2025, while the same segment is projected to post a 13.45% CAGR through 2031.
- By crop, field crops accounted for 39.20% of the IPM pheromone market size in 2025, whereas vegetable crops are anticipated to grow at a 13.85% CAGR to 2031.
- By geography, Europe led with 31.80% of IPM pheromone market share in 2025, and Asia-Pacific is forecast to expand at a 12.20% CAGR by 2031.
Note: Market size and forecast figures in this report are generated using Mordor Intelligence’s proprietary estimation framework, updated with the latest available data and insights as of 2026.
Market Trends and Insights
Drivers Impact Analysis of IPM Pheromone Market*
| Driver | (~) % Impact on CAGR Forecast | Geographic Relevance | Impact Timeline |
|---|---|---|---|
| Shrinking agricultural land | +2.5% | Global, strongest in Asia-Pacific and Europe | Long term (≥ 4 years) |
| Growing awareness of sustainable pest management | +2.8% | North America and European Union leading, Asia-Pacific rising | Medium term (2-4 years) |
| Increasing demand for crop-protection solutions | +2.3% | Global, yield-intensive regions | Medium term (2-4 years) |
| Government incentive programs for pheromone-based IPM | +2.0% | North America, European Union, India, and China | Short term (≤ 2 years) |
| Advances in microencapsulation for controlled release | +1.8% | Global, R&D hubs in North America and Japan | Long term (≥ 4 years) |
| Carbon-credit-linked adoption of low-emission pest control | +1.2% | European Union and North America, pilots in South America | Long term (≥ 4 years) |
| Source: Mordor Intelligence | |||
Shrinking Agricultural Land
Global arable land per capita contracted 20% between 2000 and 2020, prompting growers to extract higher yields from fixed acreage while keeping pest pressure in check [1]Source: European Commission, “Farm to Fork Strategy,” ec.europa.eu. Pheromone-based integrated pest management (IPM) offers precision targeting of pests without disrupting beneficial insects that provide 30% to 40% of natural suppression. The European Union’s Farm to Fork Strategy mandates a 50% cut in chemical pesticide use by 2030, accelerating pheromone uptake in high-value crops. Asia-Pacific smallholders, operating on under 2 hectares, now deploy 20 to 30 traps per hectare using subsidies from India’s National Mission on Sustainable Agriculture, improving affordability. Microencapsulation stretches field life to 90 days, minimizing mid-season reapplication in labor-scarce locales.
Growing Awareness of Sustainable Pest Management
Corporate sustainability targets flow through supply chains, compelling contract growers to adopt IPM or risk delisting. Walmart’s Project Gigaton incentivises suppliers to document pesticide reductions, creating demand for agricultural pheromones among preferred vendors. The United States Department of Agriculture (USDA) National Organic Program explicitly allows pheromones, giving growers a compliant tool for the USD 63 billion organic food market [2]Source: USDA, “National Organic Program: Allowed Substances,” usda.gov. Consumer willingness to pay for residue-free produce has climbed 18% since 2020, raising farm-gate prices by USD 0.30 to USD 0.50 per kilogram for certified organic fruits and vegetables. Asia-Pacific outreach programs reached 2.3 million smallholders in 2024, underscoring that information gaps, not technology scarcity, often stall adoption.
Increasing Demand for Crop-protection Solutions
Over 600 arthropod species now resist synthetic insecticides, eroding pyrethroid and neonicotinoid efficacy. Pheromones exploit innate behavior rather than neurotoxic pathways, making resistance unlikely. Fall armyworm inflicted maize losses exceeding USD 4.6 billion across 44 African countries, prompting governments to fast-track pheromone registrations[3]Source: Food and Agriculture Organization, “Fall Armyworm Impact Assessment in Africa,” fao.org. Syngenta and Provivi introduced FAW Eco-Granules in Thailand, merging pheromone lures with biodegradable carriers to improve persistence under tropical humidity. In India and China, diamondback moth resistance pushed mating disruption adoption from 8% in 2020 to 23% in 2024 across brassica districts.
Government Incentive Programs for Pheromone-based IPM
California’s Department of Food and Agriculture allocated USD 3 million in 2024 for cost-share grants covering 50% to 75% of pheromone procurement. The United Kingdom’s Countryside Stewardship pays GBP 45 per hectare (USD 57 per hectare) annually to growers eliminate insecticides. China’s Green Development Plan offers 40% reimbursements on pheromone traps in Jiangsu, Zhejiang, and Guangdong provinces. India’s Paramparagat Krishi Vikas Yojana grants INR 50,000 per hectare (USD 600 per hectare) over three years for organic transition, explicitly listing pheromones. These incentives slash payback periods from three to four years to under 18 months.
Restraints Impact Analysis of IPM Pheromone Market*
| Restraint | (~) % Impact on CAGR Forecast | Geographic Relevance | Impact Timeline |
|---|---|---|---|
| Higher cost versus conventional pesticides | -1.5% | Global, acute for price-sensitive smallholders | Short term (≤ 2 years) |
| Lack of global standardization and fragmented regulation | -0.8% | Global, divergent rules across regions | Medium term (2-4 years) |
| Limited shelf life and humidity sensitivity | -0.9% | Tropics and subtropics with cold-chain gaps | Medium term (2-4 years) |
| Intellectual-property concentration hindering generics | -0.6% | Global, notably Asia-Pacific and South America | Long term (≥ 4 years |
| Source: Mordor Intelligence | |||
Higher Cost Versus Conventional Pesticides
Mating disruption costs USD 50 to USD 300 per acre versus USD 20 to USD 80 for pyrethroids, a 2.5-fold to 3.8-fold premium that squeezes growers with margins under USD 500 per hectare. Mass trapping adds USD 100 to USD 400 per acre when 20 to 50 traps are needed. Although California benefit-cost analyses show 3:1 to 5:1 returns over three-year horizons, payback periods longer than 18 months deter annual-crop growers prioritizing liquidity. Generic blends priced 30% to 40% below branded products often deliver inconsistent potency, diminishing trust. Performance-based financing models remain scarce, limiting adoption to capital-rich farms.
Lack of Global Standardization and Fragmented Regulation
Jurisdictions diverge on data requirements: the European Union now treats pheromones as low-risk substances, shortening approval to under 12 months, while the United States Environmental Protection Agency reviews them on a case-by-case basis. India demands efficacy trials across three agro-climatic zones over two crop cycles, adding up to USD 100,000 and two years to registration. Purity standards range from 90% in Brazil to 95% in Japan, compelling manufacturers to run region-specific batches that lift costs 12% to 15%. Absent mutual recognition agreements, dossiers must be duplicated, fragmenting R&D budgets.
*Our forecasts treat driver/restraint impacts as directional, not additive. The impact forecasts reflect baseline growth, mix effects, and variable interactions.
IPM Pheromone Market Segment Analysis
By Type:
Pheromones Anchor Revenue, Aggregation Variants Unlock NichesPheromones captured 45.40% of the IPM pheromone market share in 2025, reflecting their dominance in mating disruption for codling moth, oriental fruit moth, and pink bollworm. Aggregation pheromones, still a smaller slice, will post a 14.85% CAGR through 2031, propelled by use against stored-product pests and urban forestry beetles. The IPM pheromone market size for aggregation variants is forecast to rise faster than any other type, although absolute revenue remains lower relative to sex pheromones. Shin-Etsu Chemical scales production efficiently, cutting per-unit costs 18%-22% below fermentation alternatives. Fermentation-based synthesis from the PHERA project trims lifecycle emissions 40%-50% yet remains costlier, confining uptake to premium organic channels.
Aggregation pheromones require precise blend ratios to avoid triggering alarm behaviors, a hurdle that restricts commercial launches to fewer than 10 products worldwide. ISCA’s ACTTRA Percevejo blend combats soybean stink bugs, addressing pest losses of USD 2 billion across Brazil and Argentina. Kairomones and allomones reside in the “others” category and remain nascent, yet push-pull systems combining repellent and attractant signals demonstrate promise in African maize. Regulatory acceptance for fermented pheromones improved after the European Union’s January 2024 guidance recognized their “natural exposure,” though U.S. debates over microplastics in dispensers continue.


By Function:
Mating Disruption Leads, Mass Trapping Gains from Precision AgricultureMating disruption held 51.60% of the IPM pheromone market share in 2025, owing to its season-long protection in tree crops. Mass trapping, already important in cucurbits and brassicas, is projected to grow at a 14.10% CAGR by 2031 as remote sensing pinpoints pest hotspots, allowing selective deployment that lowers per-acre cost 25%-35%. Detection and monitoring remain essential but increasingly bundled at a minimal margin. Suterra’s CheckMate aerosol puffers cut labor 60% in high-wage markets by eliminating hand ties, while Trécé’s Cidetrak membranes assure consistent release under desert heat.
Return-on-investment modeling shows mass trapping achieves cost parity with mating disruption when pest pressure exceeds five moths per trap per week, typical in organic orchards. Provivi and Syngenta’s YSB Eco-Dispenser integrates pheromone with degradable carriers, sidestepping plastic waste in organic certification. As subscription models bundle monitoring with agronomic advice, standalone trap revenue gives way to service-based income, broadening the IPM pheromone market.
By Mode of Application:
Dispensers Dominate Through VersatilityDispensers commanded 41.10% of the IPM pheromone market share in 2025 and will maintain leadership with a 13.45% CAGR through 2031. Their versatility across monitoring, mating disruption, and trapping drives adoption. Traps transition from capital purchases to recurring consumables, while sprayers remain a niche for greenhouse crops. Suterra’s biodegradable designs meet certifier expectations and secure 10%-15% price premiums in organic channels. ISCA’s SPLAT paste halves application time against twist-tie dispensers, appealing to labor-constrained orchards.
Drone deployment in Washington reduced dispenser application from eight hours to one per hectare, resolving labor bottlenecks that left 15% of U.S. orchard acres unmanaged. Passive-release dispensers avoid batteries and cut ownership costs 20%-30% over three years. Chinese generic traps priced at USD 1.50 to USD 2.50 challenge branded units at USD 4 to USD 6, intensifying price competition. Sprayers demand specialized rigs costing USD 500 to USD 1,000 that only greenhouse tomato and cucumber growers can justify.
By Crop:
Field Crops Lead on Scale, Vegetable Crops Accelerate on Export ComplianceField crops generated 39.20% of the IPM pheromone market size in 2025, led by codling moth programs in apples and pink bollworm suppression in cotton. Vegetable crops are projected to expand at a 13.85% CAGR, the fastest among all crops, as South American and Southeast Asian exporters chase European Union residue compliance. Tree fruits account for up to 70% of field-crop pheromone revenue, justified by per-acre values exceeding USD 15,000. Cotton’s share declines where Bacillus thuringiensis (Bt) traits lower pest pressure, shifting demand toward non-Bt areas in India and Pakistan.
Greenhouse vegetables in Japan, South Korea, and the Netherlands adopt mating disruption at USD 400 to USD 600 per hectare, matching weekly spray costs when labor tops USD 15 per hour. Export-oriented growers in Kenya, Peru, and Vietnam increasingly rely on pheromones to secure Global G.A.P. and USDA organic certification, driving 18% annual demand growth since 2022. Stored-product pests inside grain silos and bark beetles in forestry represent untapped potential for aggregation pheromones, but fragmented customer bases slow scale-up.
Geography Analysis
Europe IPM Pheromone Market
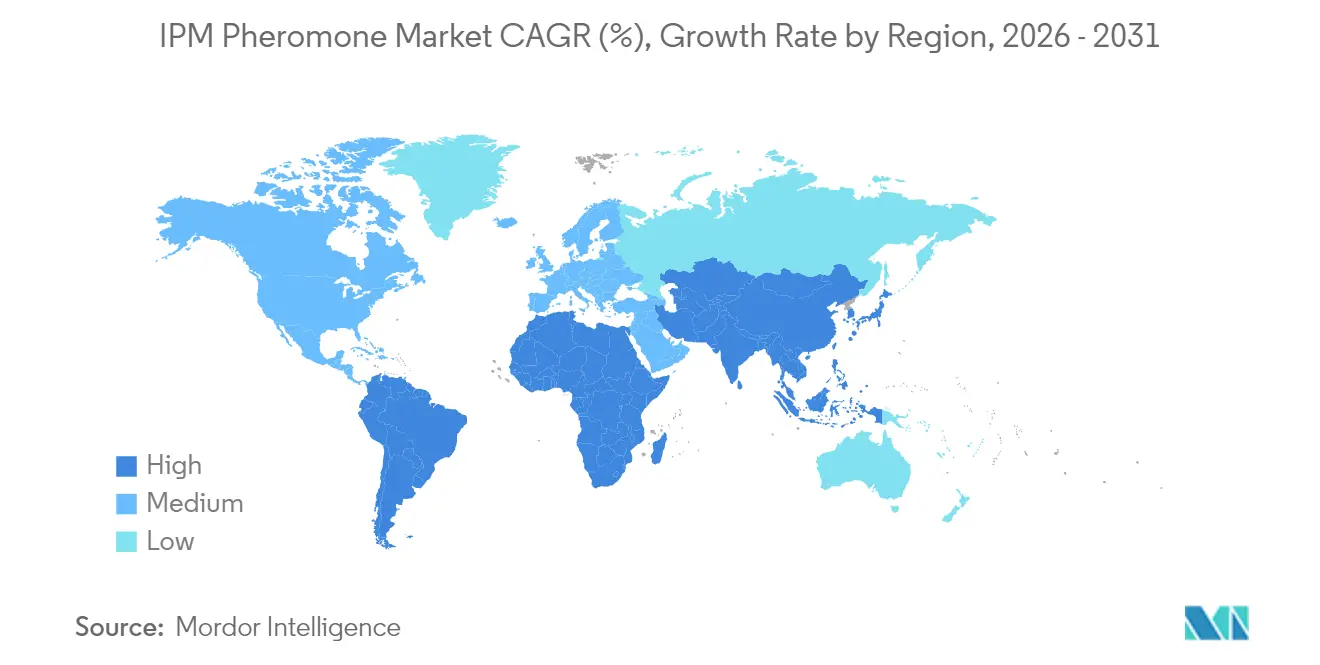
Europe retained 31.80% of the IPM pheromone market share in 2025, underpinned by the Sustainable Use of Pesticides Directive that mandates IPM for all professional users. Semiochemical guidance issued in January 2024 treats pheromones as low-risk, cutting approval timelines to under 12 months. Germany, France, and Spain spearhead adoption in vineyards and stone fruits, where organic premiums of EUR 0.40 to EUR 0.60 per kilogram (USD 0.43 to USD 0.65 per kilogram) offset costs. The United Kingdom’s Countryside Stewardship payment of GBP 45 per hectare (USD 57 per hectare) shortens payback to 18 months. Eastern Europe trails due to limited subsidies and cold-chain gaps that degrade potency during transit.
APAC IPM Pheromone Market
Asia-Pacific will record a 12.20% CAGR, the fastest worldwide. China’s Green Development Plan enforces a 50% chemical pesticide cut by 2025, and provincial subsidies refund 40% of pheromone purchases. India’s National Mission on Sustainable Agriculture subsidizes traps for farms averaging under 2 hectares, while Paramparagat Krishi Vikas Yojana supplies INR 50,000 per hectare (USD 600 per hectare) over three years for organic transition. Japan integrates rice stem-borer pheromones into satellite-guided platforms. High humidity remains a performance constraint, yet biodegradable carriers with higher loadings mitigate potency loss.

Regulatory Landscape
Regulation of pheromone-based IPM products remains fragmented across major markets, but several pathways favor low-risk semiochemicals. In the European Union, semiochemicals are treated within the plant protection framework as low-risk substances, supported by the European Commission Guidance Document on Semiochemical Active Substances (rev. 11, January 2024), which clarified technical equivalence procedures and candidate substance coverage. A key shift for demand in organic channels came via Implementing Regulation (EU) 2025/973, which expanded authorized use of semiochemicals in EU organic production and removed prior restrictions that limited applications mainly to traps or dispensers.
In the United States, pheromones fall under the US EPA biopesticide and biochemical pesticide oversight, with certain categories such as Straight Chain Lepidopteran Pheromones (SCLPs) benefiting from established exemptions from tolerance requirements under specified use limits. In January 2026, the US EPA issued draft guidance on notifications, non-notifications, and minor formulation amendments, alongside ongoing updates to biopesticide active ingredient listings, influencing how registrants manage product changes and sustain compliance. Internationally, OECD work on biological pesticides and related guidance supports convergence discussions, but differing purity thresholds and efficacy trial requirements continue to drive region-specific dossiers and manufacturing specifications.
Competitive Landscape
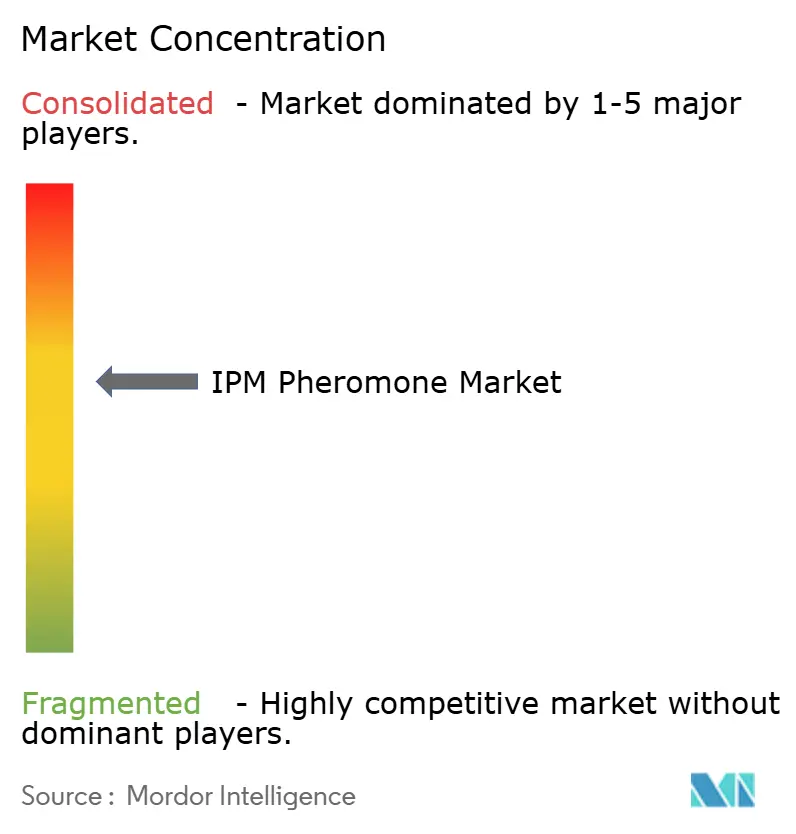
The IPM pheromone market exhibits moderate concentration: the top five companies, Suterra, Shin-Etsu Chemical, BASF, ISCA, and Provivi, held modest percentage of revenue in 2025. Regional fragmentation persists as local formulators market generic blends 30%-40% cheaper. Intellectual property around microencapsulation elevates entry barriers; challengers, therefore, pivot to fermentation, even though yields lag and costs stay high. Suterra leverages vertical integration from synthesis to dispenser fabrication, enjoying 18%-22% cost advantages and strengthening positions in North America and Europe.
Provivi’s alliance with Syngenta rolled out YSB Eco-Dispenser for rice and FAW Eco-Granules for maize, pairing pheromones with adjuvants that extend persistence under humidity. ISCA’s SPLAT carrier, a hand-applied paste, halves application labour, aligning with labour-scarce regions. Russell IPM and Koppert Biological Systems bridge monitoring and mating disruption portfolios, providing turnkey IPM packages to European greenhouses. Bedoukian Research, Pherobank, Novagrica, and Alpha Scents specialise in custom blends for niche pests, while Blue Magpie India scales low-cost traps for smallholders.
Biodegradable polymers, drone deployment, and data-linked advisory platforms serve as primary differentiation axes. Generic production expansion in China and India is anticipated to compress margins 8%-12% through 2030. Patent expirations after 2027 will intensify price pressure, but leading firms bank on advanced carriers and bundled agronomic services to defend share. The resulting landscape balances innovation among leaders with cost competition from regionals, creating a dynamic yet orderly market.
IPM Pheromone Industry Leaders
Suterra (The Wonderful Company)
Shin-Etsu Chemical Co.
Russell IPM
ISCA
BASF SE
- *Disclaimer: Major Players sorted in no particular order
IPM Pheromone Market Companies Covered in this Report
- Suterra (The Wonderful Company)
- Russell IPM
- Shin-Etsu Chemical Co.
- BASF SE
- ISCA
- Koppert Biological Systems
- Provivi
- Trece
- Pherobank
- Bedoukian Research
- Novagrica
- Hercon Environmental
- Blue Magpie India
- Certis Biologicals (Mitsui & Co.)
- Alpha Scents

Market Opportunities and Future Outlook
Opportunities concentrate where regulation and procurement systems reduce friction for low-residue pest control and where scalable deployment lowers unit economics. In the EU organic channel, Implementing Regulation (EU) 2025/973 that expanded allowable semiochemical uses creates whitespace for direct-application formats beyond traditional traps and dispensers, reinforcing demand for sprayable and advanced controlled-release formulations already being commercialized in broadacre and export crops. In the United States, the established regulatory treatment for certain pheromone classes (such as SCLPs) and USDA National Organic Program alignment with pheromone tools support broader integration of pheromones into certified supply chains and retailer-led sustainability programs.
Commercial and technology momentum points to two execution paths: (i) scaling manufacturing and portfolios via consolidation and partnerships, and (ii) bundling pheromones with digital monitoring to raise field-level precision. In March 2026, Bedoukian Research completed its acquisition of Pherobank (a collection of 500+ pheromones), strengthening end-to-end capabilities spanning specialized lure portfolios and manufacturing reach, a direct lever for faster customization across pests and geographies. In parallel, monitoring and decision support platforms are being integrated with trapping and disruption programs, as seen in recent launches of AI-enabled surveillance tools and higher-efficacy monitoring systems that improve trap performance and labor productivity, expanding service-led adoption models in greenhouse and export horticulture value chains.
Recent Industry Developments in IPM Pheromone Market
- May 2026: Suterra acquired Vestaron's R&D assets, product lines, and active ingredients, including the Spear and Basin brands. The move broadened Suterra's biological pest-control portfolio beyond semiochemicals and strengthened its ability to offer multi-modal IPM programs to growers and channel partners.
- December 2025: Provivi, in partnership with Syngenta, launched a sprayable pheromone solution in Brazil to control fall armyworm. The launch expanded pheromone delivery options for broadacre use cases and supported adoption where labor and application logistics limit traditional dispenser-based approaches.
- September 2024: Syngenta Biologicals and Provivi partnered to launch pheromone-based pest-control solutions across Asia, targeting key crops such as rice and maize. The rollout reinforced regional commercialization pathways through established distribution and agronomy networks, supporting scaled deployment in smallholder and export-oriented production systems.


IPM Pheromone Market Report Scope and Research Methodology
Market Definition and Coverage
This market covers pheromone based solutions used in integrated pest management to detect, monitor, mass trap, or disrupt mating of insect pests, mainly across crop production settings. Revenues are captured for pheromone products and the application formats used in pest control decisions.
Scope exclusions: This sizing excludes conventional chemical pesticides, biological control agents, and general trap hardware sold without pheromone lures or active pheromone formulations.
Segments Covered in This Report
- Type
- Pheromones
- Aggregation pheromones
- Others
- Function
- Mating disruption
- Detection and monitoring
- Mass trapping
- Mode of Application
- Traps
- Sprayers
- Dispensers
- Crop
- Field crops
- Vegetable crops
- Other crops
- Geography
- North America
- United States
- Canada
- Mexico
- Rest of North America
- Europe
- Germany
- United Kingdom
- France
- Russia
- Spain
- Rest of Europe
- Asia-Pacific
- India
- China
- Japan
- Rest of the Asia-Pacific
- South America
- Brazil
- Argentina
- Rest of South America
- Middle East
- United Arab Emirates
- Saudi Arabia
- Rest of Middle East
- Africa
- South Africa
- Egypt
- Rest of Africa
- North America
Data Sources, Market Sizing, and Validation
Desk Research
Desk work was used to set the market boundaries, convert volumes into value, and build a demand story by crop and region. We relied on public sources such as FAOSTAT for crop area and production, USDA and Eurostat for agriculture context and pesticide use signals, and OECD and World Bank indicators to align macro and farm income signals that can influence adoption.
To ground the pest and regulation side, sources such as EPPO guidance, national agriculture ministry notifications, and peer reviewed journals on pheromone efficacy and mating disruption helped us check where pheromones are practically used versus where they are still in trials. Company filings, product catalogs, and investor presentations were used to map product availability and pricing direction. We then used paid subscriptions focused on company financials and patent databases selectively to confirm activity levels and innovation intensity. These are illustrative sources only, and we also used other public references as cross checks and for clarification during the work.
Primary Interviews and Surveys
Primary work filled gaps that desk sources cannot answer well, especially for price ranges, typical replacement cycles for lures and dispensers, and adoption differences between high value horticulture and broad acre crops. We spoke with a mix of manufacturers, distributors, crop advisors, and large farm operators across APAC, EMEA, and the Americas. We then rechecked key assumptions when responses showed wide variance tied to pest pressure intensity and regulatory limits.
Distribution of primary research fieldwork respondents
| Company type | Respondent position | Region |
|---|---|---|
| Top tier: 26% | CXOs: 18% | APAC: 43% |
| Mid tier: 54% | Functional/Unit leaders: 28% | EMEA: 31% |
| Smaller Players: 20% | Managers: 54% | Americas: 26% |
Market-Sizing & Forecasting
Sizing starts with a top-down build that reconstructs the realistic pheromone demand pool using crop area trends, pest incidence patterns reported for key crops, and the share of acreage where monitoring, mass trapping, or mating disruption is typically applied. Those demand signals are converted into value using observed price bands for lures and dispensers, application frequency during a season, and channel markups that differ by region and crop.
After the first totals are formed, we corroborate with selective bottom-up approximations, such as roll ups from a sampled set of suppliers and distributor channel checks, plus an ASP times volume sanity check for common use cases like monitoring traps. Where product revenue is bundled or not broken out cleanly, the gap is handled through conservative allocation rules agreed in interviews, and then reviewed against known product mix by function.
For the forecast, scenario analysis was used because growth depends on a few practical levers that can move quickly, such as residue limits and registrations, expansion of high value horticulture, and the pace of IPM adoption programs. The scenarios were anchored to expected changes in crop acreage, pest pressure cycles, and pricing progression, and then filtered through expert views on how fast growers shift from chemical heavy programs to pheromone based tools.
Data Validation & Update Cycle
Checks are built into the model so that outputs are compared against independent signals like crop acreage movements, regional adoption cues, and pricing ranges observed in catalogs and interviews. If an estimate creates sharp jumps that do not match seasonality, regulation timelines, or distribution realities, we revisit the assumption and recontact sources on the specific driver that moved.
Before sign off, the work goes through a multi step review where calculations, unit conversions, and currency timing are rechecked, and then the story is aligned with what respondents see on the ground. Reports are refreshed annually, and interim updates are made when material events occur, such as major registration changes or large pricing resets. Right before delivery, a final pass is completed so clients receive the most current view possible.
Mordor Intelligence's Ipm Pheromone Market Size Compared Against Other Published Estimates
Published market values for IPM pheromones can look far apart because firms do not always count the same use cases, years, and price build ups, even when the topic name is similar. Differences also show up due to currency timing, whether non agricultural applications are included, and how quickly adoption is assumed to spread across crops.
Crop acreage signals, pheromone application frequency by function, and interview backed price bands are the evidence points that keep Mordor Intelligence tied to an agriculture led demand pool for this market, which can shift totals away from studies that mix in broader pest control settings. Another driver is the modeling horizon, since some sources publish a nearer term view and others extend further out with smoother growth curves that may not reflect registration and adoption step changes.
Benchmark comparison
| Source | Market Size | Gaps in Research Methodology |
|---|---|---|
| Mordor Intelligence | USD 1.51 B (2026) | |
| Industry Publisher A | USD 1.03 B (2024) | Uses a different base year and a broader application frame that includes non agricultural end uses like residential and commercial pest control, which changes the counted revenue pool and lowers comparability to an agriculture focused definition. |
| Global Consultancy B | USD 1.05 B (2024) | Anchors estimation to an earlier base year with a shorter forecast window and a different pricing progression approach for lures and dispensers, which can dampen the implied growth and shift the stated current value. |
The table spread is mainly explained by year alignment, what gets counted beyond crop protection, and how pricing and adoption are translated into revenue. By keeping inputs traceable to crop area, usage intensity, and validated price ranges, the estimate stays repeatable and easier to audit when new registrations or pest outbreaks change demand.


Key Questions Answered in the Report
What is the current value of the IPM pheromone market?
The IPM pheromone market size is USD 1.51 billion in 2026.
How fast will IPM pheromone adoption grow?
The market is forecast to post a 12.95% CAGR over 2026-2031 and reach USD 2.78 billion by 2031.
Which function leads pheromone usage?
Mating disruption accounts for 51.60% of market share, especially in perennial tree crops.
Which region will see the fastest growth?
Asia-Pacific is anticipated to expand at a 12.20% CAGR through 2031 on the back of Chinese and Indian subsidy programs.
Page last updated on:


 Your data is secure and never sold or shared.


