
IoT Insurance Market Size and Share
Market Overview
| Study Period | 2020 - 2031 |
|---|---|
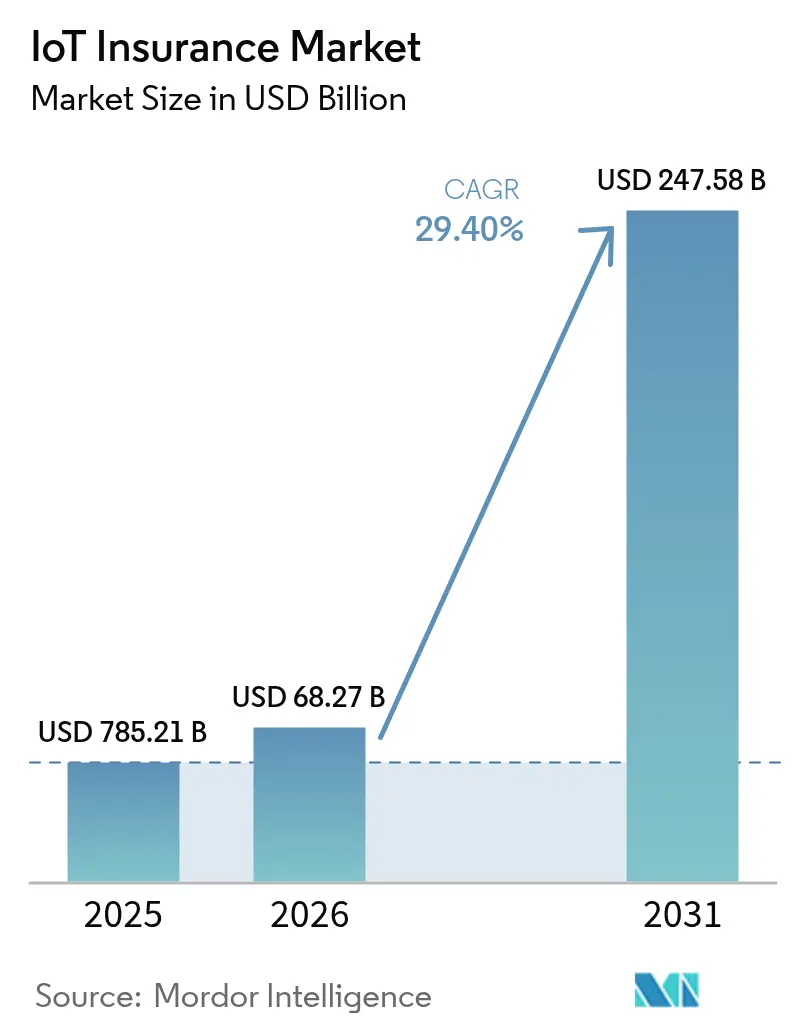
| Market Size (2026) | USD 68.27 Billion |
| Market Size (2031) | USD 247.58 Billion |
| Growth Rate (2026 - 2031) | 29.40 % |
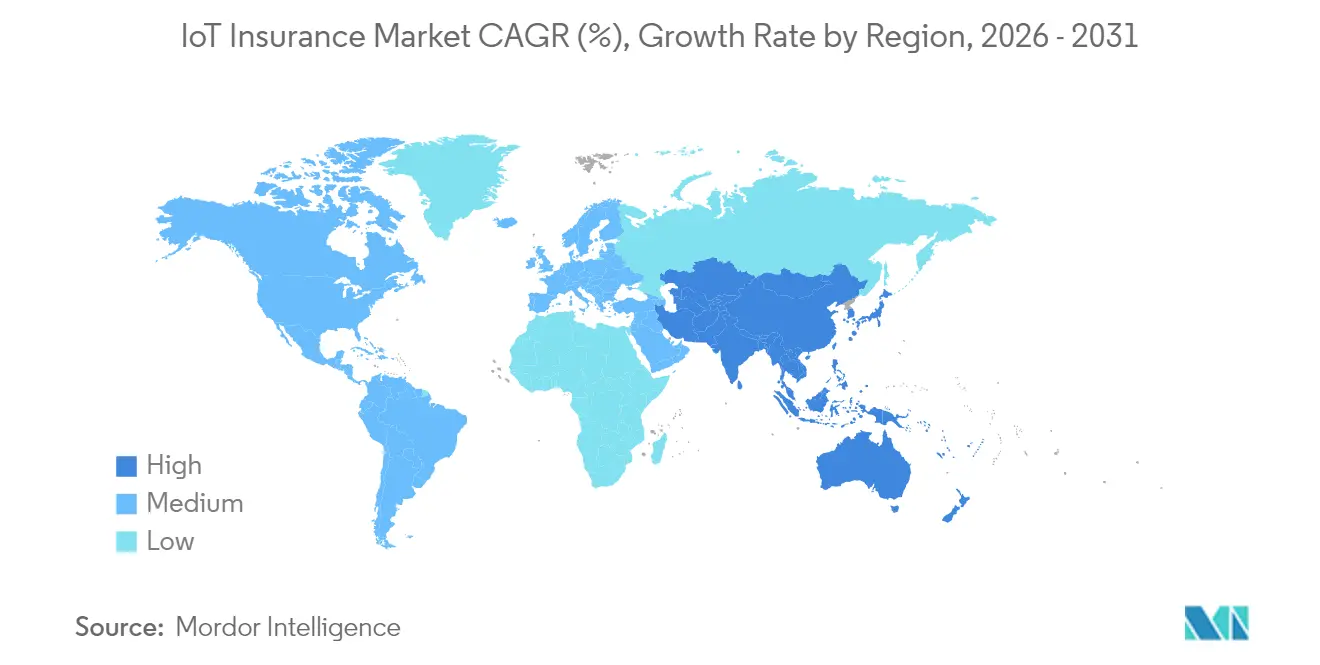
| Fastest Growing Market | Asia Pacific |
| Largest Market | North America |
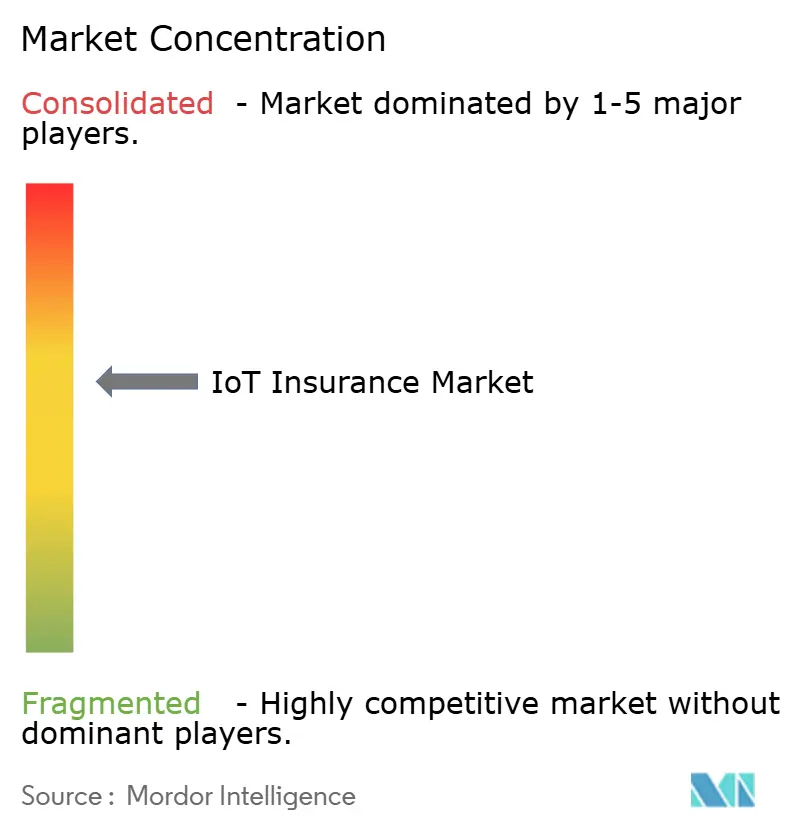
| Market Concentration | Medium |
Major Players *Disclaimer: Major Players sorted in no particular order Image © Mordor Intelligence. Reuse requires attribution under CC BY 4.0. | |
IoT Insurance Market Analysis by Mordor Intelligence
The IoT Insurance Market size was valued at USD 52.78 billion in 2025 and estimated to grow from USD 68.27 billion in 2026 to reach USD 247.58 billion by 2031, at a CAGR of 29.40% during the forecast period (2026-2031). Continuous telemetry from connected vehicles, smart-home devices, wearables, and industrial sensors is moving risk transfer away from claims reimbursement toward real-time loss prevention. Falling sensor prices, reliable cellular and LPWAN coverage, and data-driven pricing mandates in key jurisdictions jointly accelerate adoption. [1]
Cloud deployment models capture 63.7% of the IoT insurance market share in 2024 and are expanding at 33.8% CAGR as carriers prioritize elastic computing over capital-intensive on-premise data centers. Property and Casualty products still account for 48.3% of revenue, yet life underwriters are registering the fastest 35.1% CAGR by embedding wearable analytics into underwriting. Vehicle telematics holds a 44.1% share, but the surge of wearables at 34.1% growth confirms that richer biometric data is redefining actuarial models. Regionally, North America leads with 37.8% revenue, while Asia-Pacific’s 34.5% CAGR signals an imminent shift in geographic weight. Competitive intensity is moderate; incumbents such as Munich Re and Zurich are acquiring data-centric insurtechs, whereas focused entrants leverage analytics depth to serve niche verticals. Persistent headwinds include cybersecurity exposure, legacy-core integration, and sensor-data drift, yet early movers with resilient cloud and edge architectures enjoy sizeable first-mover advantages.
Key Report Takeaways
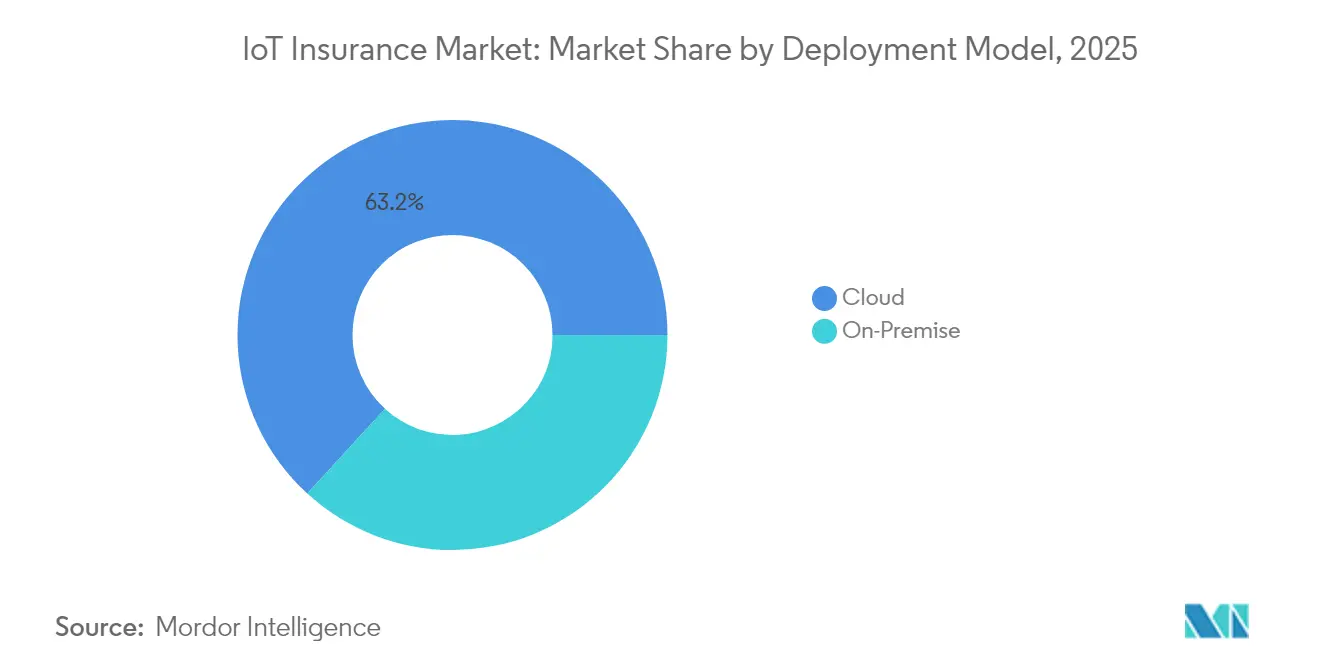
- By deployment model, cloud platforms secured 63.20% of the IoT insurance market share in 2025; hybrid cloud deployments are rising at 32.60% CAGR through 2031.
- By line of insurance, Property and Casualty dominated with 47.80% revenue in 2025, whereas life products are forecast to expand at a 33.20% CAGR to 2031.
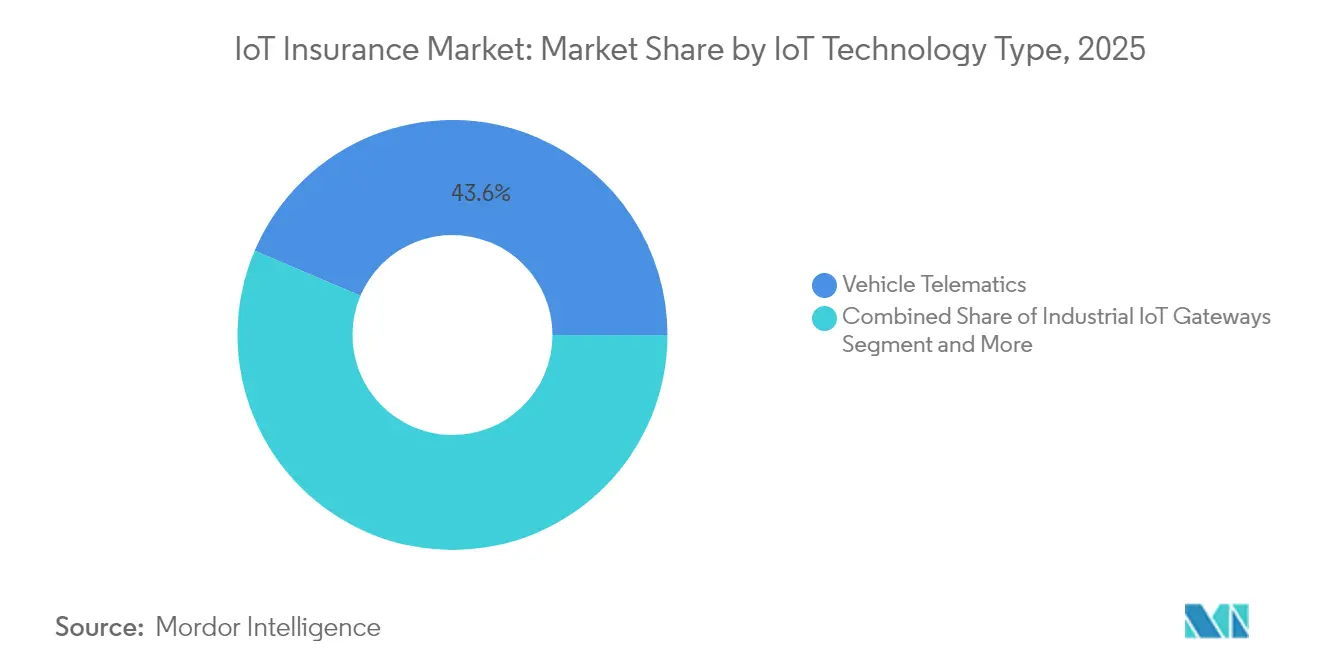
- By IoT technology, vehicle telematics accounted for 43.60% share of the IoT insurance market size in 2025 and faces the fastest growth from wearables, advancing at 32.80% CAGR.
- By end-user industry, automotive retained 33.00% revenue in 2025; healthcare is projected to grow at 31.60% CAGR owing to continuous health-metric monitoring.
- By geography, North America led with 37.20% revenue in 2025, while Asia-Pacific is poised for a 33.00% CAGR, reflecting rapid digitalization and regulatory liberalization.
Note: Market size and forecast figures in this report are generated using Mordor Intelligence’s proprietary estimation framework, updated with the latest available data and insights as of 2026.
Market Trends and Insights
Drivers Impact Analysis of IoT Insurance Market*
| Driver | (~) % Impact on CAGR Forecast | Geographic Relevance | Impact Timeline |
|---|---|---|---|
| Usage-based insurance (UBI) proliferation | +8.2% | North America and Europe | Medium term (2-4 years) |
| Smart-home and industrial sensor uptake | +6.8% | North America and EU → APAC | Long term (≥ 4 years) |
| Declining IoT hardware and connectivity cost | +5.4% | Global | Short term (≤ 2 years) |
| Regulatory pressure for data-driven pricing | +4.1% | EU and selected US states | Medium term (2-4 years) |
| Parametric, trigger-based P&C products | +3.7% | Global | Long term (≥ 4 years) |
| Reinsurers’ demand for live portfolio data | +2.8% | Major reinsurance hubs | Medium term (2-4 years) |
| Source: Mordor Intelligence | |||
Proliferation of Usage-Based Insurance (UBI)
Telematics-enabled UBI is redefining personal and commercial auto premiums as real-time driver behavior replaces static demographic factors. Progressive wrote USD 6.684 billion in net premiums during February 2025, a 17% year-over-year rise driven chiefly by telematics policies that now represent 18% of its book. Fleet operators replicate those gains; a luxury transport provider cut insurance spend by 15% after implementing Samsara’s connected-operations suite, confirming enterprise appetite for granular behavioral scoring. [2] AI-driven pattern recognition further predicts collision-prone maneuvers, enabling proactive coaching that lowers claims frequency and ultimately reduces loss ratios for carriers.
Adoption of Smart-Home and Industrial Sensors
Water escape, fire, and equipment failure account for a majority of property and industrial losses; low-cost sensors address these pain points by alerting users and insurers before damage escalates. State Farm has shipped 2 million Ting electrical-fire sensors, reporting an 80% reduction in related claims across 700,000 connected homes. In commercial settings, HSB’s Relayr analytics suite lifts revenue for elevator maintenance partners by 12% through predictive servicing that prevents business interruption. Insurers match these preventive gains with premium discounts ranging from 5% to 20% to encourage wider device adoption.
Rapid Fall in IoT Hardware and Connectivity Costs
Global cellular IoT subscriptions will surpass 3 billion by 2027 as economies of scale and specialized chipsets lower unit cost and energy consumption. Qualcomm alone generated more than USD 1 billion from IoT chips in 2024, proving the commercial maturity of purpose-built silicon. Innovations such as eSIMs streamline device onboarding, while battery-free sensors minimize field maintenance. These cost curves unlock access for SMEs that historically lacked capital to employ telemetric risk controls, expanding the addressable IoT insurance market.
Regulatory Push for Data-Driven Pricing
Legislation is mandating transparent data usage and robust cybersecurity as prerequisites for IoT-enabled underwriting. Europe’s Data Act obliges manufacturers to guarantee user-friendly data portability from January 2024, removing a long-standing barrier to multi-brand sensor ecosystems. California’s SB 354 codifies consumer consent and limits secondary data sharing, nudging carriers toward permission-based analytics. Strict timelines around breach notification and product security incentivize investment in secure-by-design hardware and cloud infrastructures, accelerating trust-led growth.
Restraints Impact Analysis of IoT Insurance Market*
| Restraint | (~) % Impact on CAGR Forecast | Geographic Relevance | Impact Timeline |
|---|---|---|---|
| Data-privacy and cyber vulnerability | -4.3% | Global, stricter in EU and CA | Short term (≤ 2 years) |
| Legacy-core system integration | -3.1% | North America and Europe | Medium term (2-4 years) |
| Sensor-data reliability drift | -2.8% | Global industrial use | Long term (≥ 4 years) |
| Antitrust scrutiny of OEM–insurer data | -1.9% | US and EU automotive | Medium term (2-4 years) |
| Source: Mordor Intelligence | |||
Data-Privacy and Cybersecurity Exposure
A global IT outage in July 2024 struck 8.5 million systems and inflicted USD 10-15 billion in economic loss, underscoring the systemic risk of interconnected devices. Zurich lists cyber threats among the top five risks facing electronics manufacturers, warning that compromised firmware can trigger cascading losses for both carriers and insureds. Compliance with Europe’s forthcoming Cyber Resilience Act can cost non-conforming vendors up to EUR 15 million in penalties, creating adoption friction yet offering a competitive moat for firms that build secure architectures upfront.
Legacy-Core Integration Complexity
Many global insurers still operate COBOL-based policy systems that cannot ingest high-velocity IoT data streams. Modernization projects often span multiple years and budgets in the hundreds of millions, producing short-term capability gaps between greenfield digital entrants and traditional carriers. Hybrid “strangler-fig” approaches that wrap legacy cores with microservices are emerging as pragmatic paths, yet the learning curve continues to delay scalable IoT roll-outs, especially within multiline incumbents.
*Our forecasts treat driver/restraint impacts as directional, not additive. The impact forecasts reflect baseline growth, mix effects, and variable interactions.
IoT Insurance Market Segment Analysis
By Deployment Model:
Cloud Infrastructure Dominates Digital TransformationCloud environments control 63.20% of the IoT insurance market and will expand at a 30.70% CAGR, lifting the IoT insurance market size for cloud platforms to USD 166.31 billion by 2031. Elastic compute, API openness, and managed security patches free carriers from maintaining capital-intensive data centers. Samsara’s connected-operations cloud reached USD 1.458 billion in ARR in Q4 2025, illustrating how scalable telemetry architectures translate into enterprise adoption.
On-premise deployments persist in heavily regulated jurisdictions or where data sovereignty statutes prohibit offshore processing. Even so, security certifications such as FedRAMP High and ISO 27018 have reduced the perceived risk of multi-tenant clouds, prompting phased migration away from local servers. Edge nodes are increasingly integrated into cloud stacks, ensuring ultra-low latency for autonomous vehicle coverage while central analytics refine pricing algorithms. As hybrid models mature, carriers gain situational flexibility without compromising centralized actuarial oversight.

By Insurance Line:
Property and Casualty Leadership Faces Life DisruptionProperty and Casualty lines hold 47.80% of 2025 revenue, representing the largest IoT insurance market size by product class. Smart-home and industrial sensors deliver tangible loss-avoidance, making P&C a natural first adopter. However, life underwriters are growing at 33.20% CAGR; they leverage continuous wearable data to refine mortality assumptions and incentivize healthy behavior through dynamic premiums.
Commercial lines increasingly embed industrial IoT into workers’ compensation, where predictive maintenance lowers injury frequency. The shift from retrospective claims adjustment to preventive analytics compresses combined ratios and appeals to reinsurers seeking demonstrable portfolio telemetry. Longer term, cross-line bundling—such as combining life, auto, and home policies around a single sensor suite—will blur historic product boundaries and reward data-centric platforms.
By IoT Technology Type:
Vehicle Telematics Maturity Meets Wearables InnovationVehicle telematics contributed 43.60% IoT insurance market share in 2025 and remains foundational to usage-based pricing. Mature ELD mandates in North America and Europe have created a robust device footprint, allowing carriers to apply risk scoring at scale. Yet wearables and health devices exhibit 32.80% CAGR, confirming a pivot toward biometric-driven underwriting where loss prevention directly correlates with sustained behavior change.
Smart-home sensors sharply reduce water escape and electrical fire claims, gaining traction among homeowners attracted by instant alerts and policy discounts. Industrial gateways funnel real-time equipment metrics into predictive maintenance models that curtail business interruption. Environmental sensors underpin parametric cover; for example, remote flood gauges automatically trigger payouts to protect SMEs against extreme weather volatility, strengthening customer trust through rapid claims settlement.
By End-user Industry:
Automotive Maturity Enables Healthcare InnovationAutomotive fleets and personal lines accounted for 33.00% revenue in 2025, underpinned by decades of telematics evolution. In 2025, Japanese carrier Aioi Nissay Dowa rolled out a tourist-focused telematics app to improve road safety while stimulating regional travel. However, healthcare is growing fastest at 31.60% CAGR as insurers harness continuous glucose, heart-rate, and sleep data to build dynamic mortality models and preventive care incentives.
Residential markets capitalize on water-leak and fire-sensor discounts, while industrial facilities deploy vibration and temperature probes to slash unscheduled downtime that often costs millions per outage. Logistics and public-infrastructure projects leverage cargo trackers and structural-health monitoring to reduce transit losses and extend asset life. The future competitive edge lies in synthesizing multi-domain signals across auto, home, health, and commercial assets to generate a holistic customer-level risk graph.
Geography Analysis
North America IoT Insurance Market
North America’s 37.20% revenue share in 2025 derives from well-established telematics regulations and widespread consumer acceptance. State Farm’s mass deployment of Ting sensors and Progressive’s 18% policy-in-force growth illustrate a broad shift toward sensor-mediated value propositions. Canadian regulators are tailoring AIDA and CPPA privacy laws to balance innovation with consumer sovereignty, fostering gradual yet steady device uptake.
Europe IoT Insurance Market
Europe experiences cohesive growth through the EU Data Act and forthcoming Cyber Resilience Act, which standardize device security and data sharing across 27 member states. EIOPA notes that 17% of carriers already offer motor insurance linked to IoT and expects penetration to climb as compliance frameworks build consumer confidence. Germany, France, and the United Kingdom spearhead adoption, while newer EU members benefit from cohesion funds that expand broadband coverage required for massive IoT roll-outs.
APAC IoT Insurance Market
Asia-Pacific records a 33.00% CAGR, driven by India’s FDI ceiling lift to 100% that invites multinational capital, and China’s NFRA guidelines that delineate AI and data-governance rules. Australian and New Zealand fleets will rise from 1.6 million telematics units in 2023 to 2.7 million by 2028, cementing regional auto dominance. Japan pursues incremental generative-AI pilots within insurers like Mitsui Sumitomo to complement meticulous risk cultures, thereby avoiding abrupt operational shifts.
LATAM and MEA IoT Insurance Market
Latin America and the Middle East and Africa remain nascent yet promising. Mexico’s improving 5G coverage and Brazil’s open-insurance regime are expected to shorten the adoption lag. Gulf Cooperation Council countries invest in smart-city megaprojects where embedded sensor grids naturally dovetail with commercial IoT coverage for infrastructure, property, and cyber lines.
Regulatory Landscape
IoT insurance operates at the intersection of insurance supervision and fast-evolving device, data, and cybersecurity rules, which increasingly shape what telemetry can be collected, shared, and relied on in underwriting. In the European Union, the Cyber Resilience Act (Regulation (EU) 2024/2847) entered into force on 10 December 2024, setting horizontal cybersecurity requirements for products with digital elements that affect the security posture of sensor-led insurance programs across auto, home, and commercial lines.
In North America and the United Kingdom, security baselines and onboarding guidance are tightening for consumer and enterprise IoT. The FCC IoT Labeling Program in the United States aligns with NIST-based security criteria for consumer IoT products, while the UK Product Security and Telecommunications Infrastructure (PSTI) regime, enforced by the Office for Product Safety and Standards (OPSS), mandates security requirements for consumer connected products. NIST continued to update implementation guidance used by IoT ecosystems that support insurance, including publishing SP 1800-36 in November 2025 (trusted onboarding at the network layer) and releasing NIST IR 8259r1 in April 2026 for foundational IoT manufacturer cybersecurity activities, increasing emphasis on documented controls that carriers can reference when validating device risk.
Value Chain Analysis
The IoT insurance value chain runs from device and sensor manufacturers (telematics, smart-home, wearables, industrial gateways), to connectivity and device-management providers, then to data ingestion and analytics platforms, and finally to insurers and reinsurers that convert telemetry into underwriting, prevention, and claims decisions. Commercial proof points indicate insurers are increasingly acting as distributors or orchestration partners for prevention hardware and embedded telemetry: Nationwide expanded its initiative with Whisker Labs in February 2026 to distribute Ting electrical fire sensors at scale, while Samsung Electronics and Hartford Steam Boiler (HSB) announced a SmartThings-linked insurance savings collaboration in January 2026 that ties connected-appliance protection capabilities to premium credits.
Downstream, underwriting and claims workflows are being retooled to consume verified, near real-time risk signals rather than periodic questionnaires. In commercial construction, Shepherd partnered with Brickeye in June 2026 to integrate BuildersRiskIQ IoT risk intelligence into autonomous underwriting, illustrating how data platforms and specialty carriers connect site telemetry to policy terms at bind. Regulatory and liability frameworks also influence participation and cost across the chain: the EU Cyber Resilience Act and the UK PSTI security requirements push security-by-design obligations upstream to product makers and importers, increasing insurer reliance on compliant devices and auditable data-handling practices for scalable programs.
Competitive Landscape
The IoT insurance market balances traditional insurer depth with venture-backed insurtech agility. Munich Re’s purchase of Next Insurance embeds digital underwriting into its ERGO subsidiary and reflects a broader reinsurer strategy to secure real-time portfolio data feeds. Travelers finalized a USD 435 million acquisition of Corvus to fortify cyber expertise, further blending telematics and cyber underwriting.
Partnerships eclipse outright M&A for many carriers. Allianz Partners joined helmet-maker Cosmo Connected to bundle micromobility coverage into connected headgear at the point of sale. Bamboo Insurance distributes Whisker Labs’ Ting sensors free of charge, illustrating how device subsidies convert risk avoidance into loyalty. Start-ups such as Descartes Underwriting focus on parametric models that transfer flood risk via dense sensor networks deployed by partners like Previsico, tackling underserved SMB segments.
Intellectual property race is intensifying around sensor-data ingestion, predictive analytics, and instant claims automation. Patent filings from carriers and chipmakers alike underscore the strategic value of controlling unique algorithms that translate raw telemetry into pricing and loss-avoidance recommendations. As the cost of telemetry hardware falls, sustainable differentiation increasingly pivots on analytic depth, ecosystem reach, and brand trust.
IoT Insurance Industry Leaders
-
Octo Telematics S.p.A.
-
Cambridge Mobile Telematics, Inc.
-
Geotab Inc.
-
CalAmp Corp.
-
Samsara Inc.
- *Disclaimer: Major Players sorted in no particular order
IoT Insurance Market Companies Covered in this Report
- Octo Telematics S.p.A.
- Cambridge Mobile Telematics, Inc.
- Geotab Inc.
- CalAmp Corp.
- Samsara Inc.
- Trak Global Group Ltd
- Zubie, Inc.
- Mojio Inc.
- Queclink Wireless Solutions Co. Ltd
- Telit Cinterion PLC
- Sensata Technologies Holding plc
- Laird Connectivity LLC
- Kuantum Pvt Ltd (Kruzr)
- Smart Things Lab Co. Ltd
- Roost Inc.
- Notion (fka Iris Inc.)
- Eddy Solutions Inc.
- HSB (“Sensor Solutions by HSB”)
- ThingCo Global Ltd
- LexisNexis Risk Solutions Group
- Flow Insurance Ltd
- Kinsa Inc.
- Metromile Enterprise Solutions
- Safehub, Inc.
- Parsyl, Inc.
Market Opportunities and Future Outlook
A clear opportunity lies in embedded, prevention-first home insurance programs, where appliance and sensor ecosystems can be linked to premium credits and automated mitigation, moving beyond limited pilots into broader distribution. Samsung Electronics and Hartford Steam Boiler (HSB) expanded Smart Home Savings in January 2026, offering premium credits tied to connected Samsung appliances that detect early indicators such as water leaks, reinforcing a model in which insurers pull verified risk-reduction signals from consumer IoT platforms rather than standalone devices. Large-scale Ting deployments by insurers also point to whitespace in bundling hardware, services, and coverage into a single customer value proposition.
Another opportunity is in richer OEM- and API-based vehicle and commercial telemetry that supports continuous underwriting and faster claims triage, especially where legacy telematics programs depended on limited scoring windows or third-party aggregators. In July 2026, State Farm and Toyota launched a crash-data sharing pipeline for eligible Toyota and Lexus vehicles via Connected Analytic Services to the State Farm app, improving the fidelity and timeliness of post-loss data used in claims and risk feedback loops. Similar patterns show up in commercial and specialty lines as IoT risk intelligence is integrated directly into underwriting platforms, including the June 2026 Shepherd and Brickeye collaboration, which supports more granular policy terms for construction and other sensor-dense industries.
Recent Industry Developments in IoT Insurance Market
- May 2026: Octo Telematics and Sedgwick announced a strategic partnership to integrate telematics-derived insights into claims and risk management workflows. The tie-up connects driving behavior and vehicle event data more directly to the claims lifecycle, supporting faster triage and more consistent liability assessment for telematics-enabled auto insurance programs.
- March 2026: Cambridge Mobile Telematics secured a USD 350 million strategic investment led by TPG and Allianz to accelerate its AI-driven road safety platform. The funding strengthens capacity to scale telematics analytics across personal and commercial auto insurers and deepens insurer alignment with smartphone-based and connected-vehicle data strategies.
- July 2024: A global IT outage disrupted 8.5 million systems and caused an estimated USD 10-15 billion in economic losses, highlighting systemic cyber exposure across interconnected technology ecosystems. For IoT insurance, the event reinforced underwriting focus on cyber resilience, vendor dependencies, and accumulation risk tied to cloud and connected-device architectures.
IoT Insurance Market Report Scope and Research Methodology
Market Definition and Coverage
The IoT insurance market covers insurance products and related platform services where connected-device data is actively used to price risk, monitor exposure, prevent losses, and support claims decisions across key insurance lines.
Scope exclusions: We exclude general digitization of insurance that does not use IoT device data as a measurable input for underwriting or risk monitoring.
Segments Covered in This Report
- By Deployment Model
- Cloud
- On-Premise
- By Insurance Line
- Property and Casualty
- Life
- Health
- Commercial Lines
- By IoT Technology Type
- Vehicle Telematics
- Smart-Home Sensors
- Wearables and Health Devices
- Industrial IoT Gateways
- Environmental and Parametric Sensors
- By End-user Industry
- Retail and Commercial
- Residential (Smart-homes)
- Automotive
- Industrial
- Healthcare
- Public Infrastructure
- Logistics and Navigation
- Other End-user Industries
- By Geography
- North America
- United States
- Canada
- Mexico
- South America
- Brazil
- Argentina
- Chile
- Rest of South America
- Europe
- Germany
- United Kingdom
- France
- Italy
- Spain
- Russia
- Rest of Europe
- Asia-Pacific
- China
- India
- Japan
- South Korea
- Singapore
- Malaysia
- Australia
- Rest of Asia-Pacific
- Middle East and Africa
- Middle East
- United Arab Emirates
- Saudi Arabia
- Turkey
- Rest of Middle East
- Africa
- South Africa
- Nigeria
- Egypt
- Rest of Africa
- Middle East
- North America
Data Sources, Market Sizing, and Validation
Desk Research
Desk research was used to map the demand pool and set realistic guardrails before interviews were run. Public sources such as OECD insurance indicators, national insurance supervisors and statistical offices, ITU connectivity statistics, and National Highway Traffic Safety Administration road safety and telematics related publications helped us connect IoT adoption with insurable exposures.
We also reviewed company annual reports, statutory filings, investor decks, and reputable press coverage to understand how insurers describe IoT driven products, pricing logic, and rollouts by geography. In addition, paid subscriptions for company financials and intelligence, news and financials, and patent databases were used selectively to cross-check product positioning, partnership activity, and the timing of technology launches. These sources are illustrative only, and many other references were used for data collection, validation, and research clarification.
Primary Interviews and Surveys
Primary work focused on interviews and short surveys with insurers, brokers, connected-device solution partners, and large enterprise buyers that influence program design. For a global market like this, inputs were balanced across APAC, EMEA, and the Americas so regional adoption patterns, pricing practices, and regulatory constraints could be checked against the model.
Distribution of primary research fieldwork respondents
| Company type | Respondent position | Region |
|---|---|---|
| Top tier: 38% | CXOs: 18% | APAC: 45% |
| Mid tier: 44% | Functional/Unit leaders: 29% | EMEA: 37% |
| Smaller Players: 18% | Managers: 53% | Americas: 18% |
Market-Sizing & Forecasting
The sizing logic starts with a top-down build where insurance premium pools and digitally distributed lines are reconstructed, then filtered through the share that is realistically influenced by connected devices (for example, telematics in auto, sensors in smart homes, and wearables in health). Once this ceiling is formed, the model is shaped using market fingerprints that typically move IoT insurance value in a consistent direction.
Key inputs used include connected vehicle parc and telematics penetration, smart home device adoption in insured households, wearable usage in insured populations, claim frequency and severity trends for IoT monitored risks, and the pace of usage-based or behavior-based pricing adoption across major regions. Forecasts were developed using scenario analysis, where a base case is built first and then sensitivity is tested around adoption rates, premium uplift or discount assumptions, and insurer roll-out speed. These scenario outputs were then aligned to expert consensus from the interviews.
To keep totals grounded, we used selective bottom-up approximations as checks, such as sampled premium per policy for IoT enabled products multiplied by estimated active policy counts in priority lines, followed by channel checks on program launches and regional scaling. Where bottom-up information was patchy, gaps were handled using regional proxy ratios, conservative ramp curves, and consistency checks against overall insurance line growth so the model does not overstate early-stage adoption.
Data Validation & Update Cycle
Validation is done through triangulation across the model, desk inputs, and interview feedback, with variance checks at region and insurance line levels. When a result breaks expected relationships, such as adoption rising faster than feasible device penetration or premium growth outpacing the parent insurance line, the assumptions are reviewed and experts are re-contacted to confirm what changed.
Before sign-off, outputs go through multi-step analyst reviews that include unit consistency checks, currency conversion timing checks, and cross-checks against independent signals such as policy adoption commentary and regulatory or partnership milestones. Reports are refreshed annually, and interim updates are made when material events occur, including regulatory shifts, major program launches, or pricing resets. Right before delivery, a fresh pass is completed so clients receive the latest updated view rather than an older snapshot.
Mordor Intelligence's IOT Insurance Market Size Compared Against Other Published Estimates
Published market values for IoT insurance can look far apart because firms do not always count the same insurance lines, technology boundaries, and revenue points, even when the title sounds identical. Timing also matters, since some estimates anchor on a historical year while others start from a forward base year where adoption is already assumed to be higher.
By tracking device penetration inputs and refreshing currency timing and base year assumptions, Mordor Intelligence keeps the IoT insurance total tied to active connected-risk programs rather than broader digital insurance revenues that may not rely on IoT data for underwriting. Another gap driver is scope creep, where some studies blend adjacent categories like general insurtech platform revenue, broader analytics services, or non-IoT digital distribution, which can inflate totals versus a device-data-driven definition.
Benchmark comparison
| Source | Market Size | Gaps in Research Methodology |
|---|---|---|
| Mordor Intelligence | USD 68.27 B (2026) | |
| Global Consultancy A | USD 19.25 B (2024) | Uses an earlier base year and often captures narrower reported revenues tied to identified IoT insurance programs, which can undercount premium value that scales after broader rollout phases. |
| Industry Publisher B | USD 21.53 B (2025) | Starts from a different base year and can apply alternative inclusion rules for insurance lines and service revenues, which shifts totals when IoT platform fees and broader digital insurance activity are blended. |
The comparison shows that year selection and what is counted as IoT driven insurance are the biggest reasons for the spread. When the scope is kept tied to connected-device-informed underwriting and validated against adoption signals, the resulting number is easier to reconcile and update as programs scale across regions.
Key Questions Answered in the Report
What is the current size of the IoT insurance market?
The IoT insurance market is valued at USD 68.27 billion in 2026 and is projected to reach USD 247.58 billion by 2031.
Which deployment model is growing fastest?
Cloud platforms lead with 63.20% share in 2025 and a 30.70% CAGR because they support real-time data processing without heavy capital expense.
Why is life insurance the fastest-growing line?
Wearable sensors supply continuous biometric data that enables personalized premiums, pushing life products to a 33.20% CAGR.
Which region offers the highest growth potential?
Asia-Pacific is advancing at 33.00% CAGR due to rapid digital adoption and liberalized foreign-investment rules in markets such as India and China.
How do connected devices reduce insurance losses?
Sensors detect anomalies—like excessive speed, water leaks, or electrical faults—in real time, allowing preventive action that lowers claim frequency and severity.
What are the main barriers to IoT insurance adoption?
Cybersecurity threats, stringent data-privacy laws, and complex integration with legacy policy-administration systems remain the top challenges.