
IoT Device Management Market Size and Share
Market Overview
| Study Period | 2020 - 2031 |
|---|---|
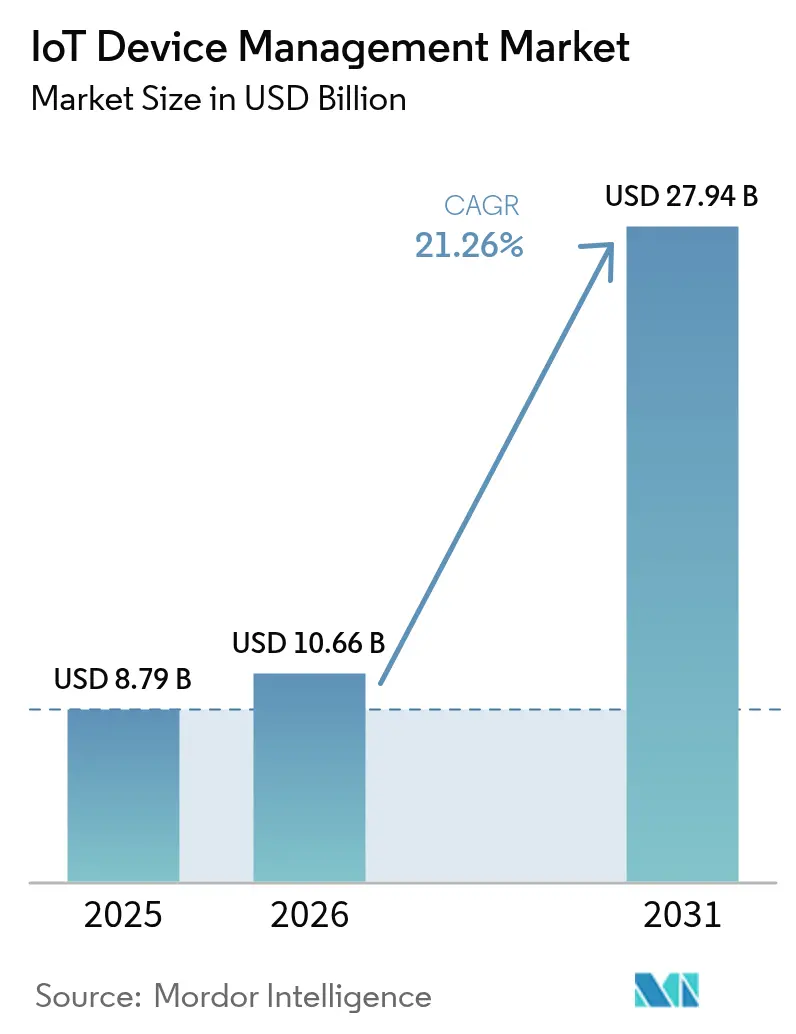
| Market Size (2026) | USD 10.66 Billion |
| Market Size (2031) | USD 27.94 Billion |
| Growth Rate (2026 - 2031) | 21.26 % |
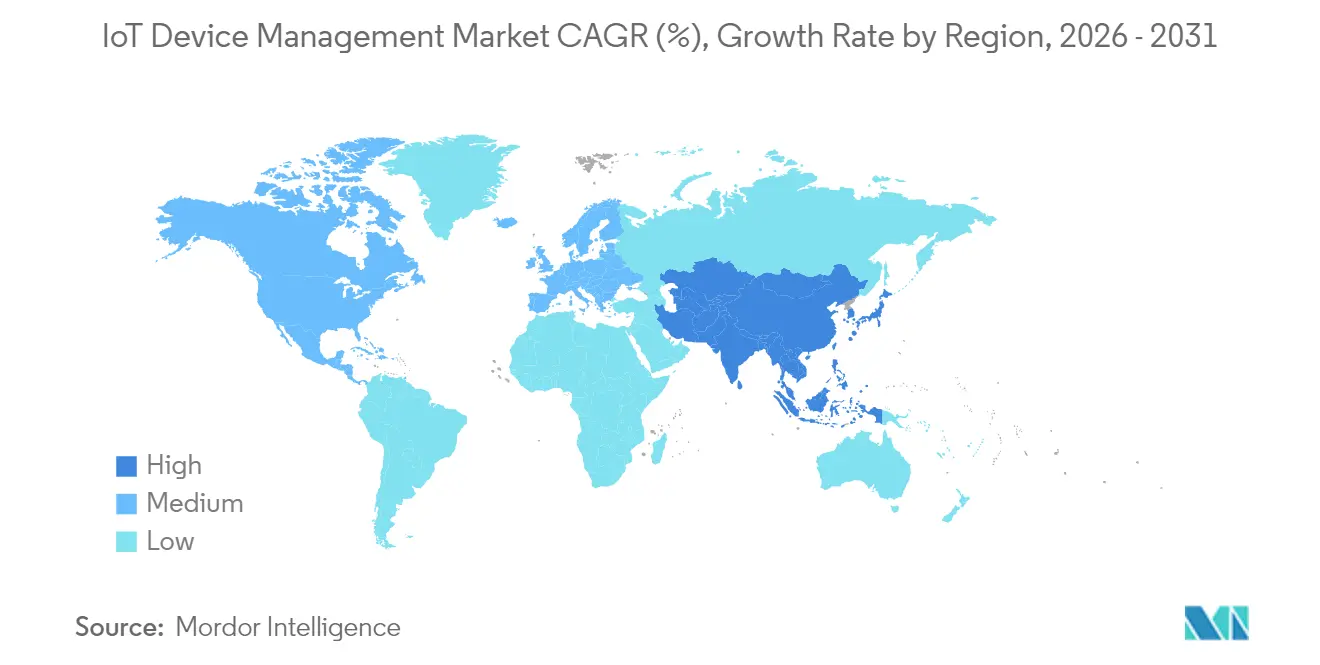
| Fastest Growing Market | Asia Pacific |
| Largest Market | North America |
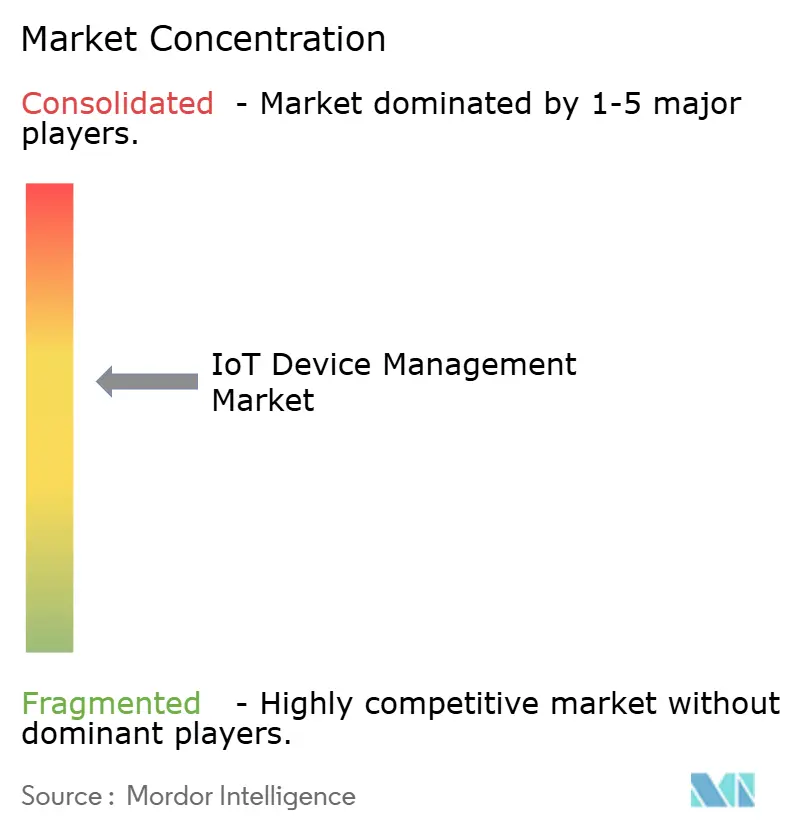
| Market Concentration | Medium |
Major Players *Disclaimer: Major Players sorted in no particular order Image © Mordor Intelligence. Reuse requires attribution under CC BY 4.0. | |
IoT Device Management Market Analysis by Mordor Intelligence
The IoT Device Management Market size was valued at USD 8.79 billion in 2025 and estimated to grow from USD 10.66 billion in 2026 to reach USD 27.94 billion by 2031, at a CAGR of 21.26% during the forecast period (2026-2031).
Device fleet expansion, 5G roll-outs, and maturing edge computing architectures are shifting enterprises from reactive break-fix approaches toward predictive, AI-orchestrated lifecycle management. Integrated security has become a decisive purchase factor as regulatory frameworks tighten, and monthly attack volumes surpass 5,000. North America leads in current deployments, yet Asia Pacific is scaling fastest as governments fund smart-city and industrial automation programs. Competitive intensity is rising as hyperscale cloud vendors, industrial specialists, and edge-native start-ups converge on unified, chip-to-cloud platforms.
Key Report Takeaways
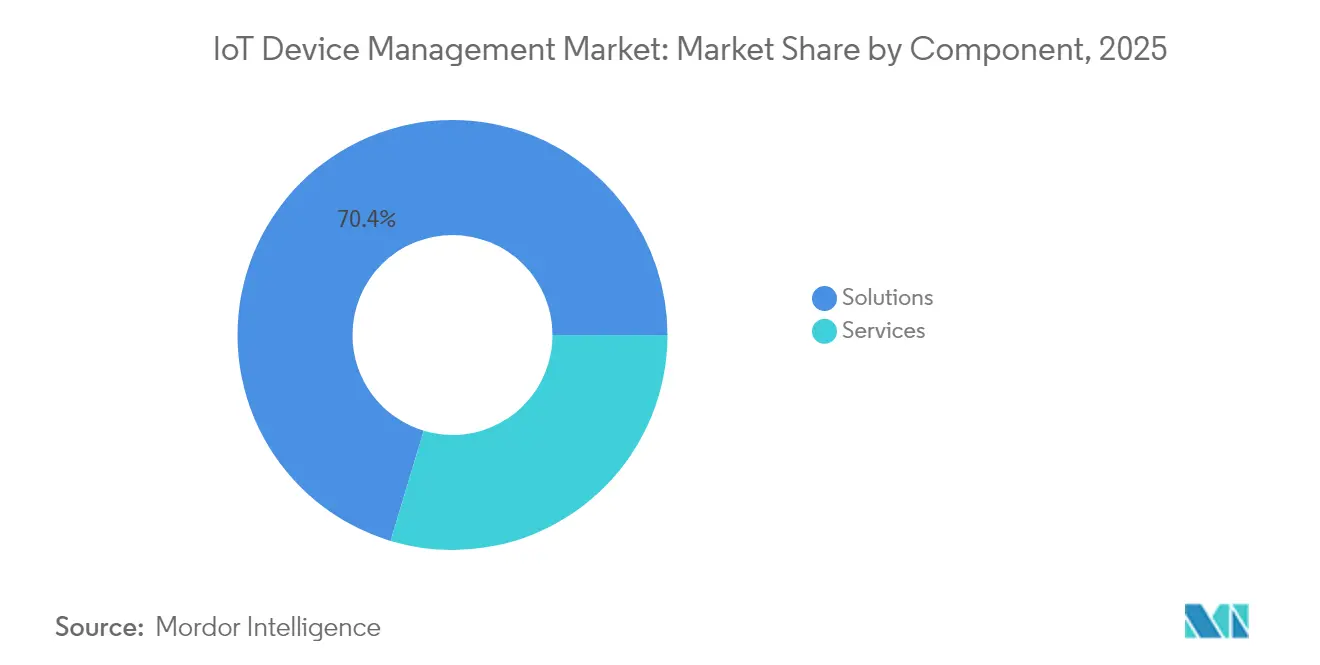
- By component, Solutions retained 70.35% revenue share in 2025, while Services are expanding at a 22.10% CAGR through 2031.
- By deployment type, Cloud held 67.85% of the IoT Device Management market share in 2025, yet Edge-native architectures are advancing at a 26% CAGR to 2031.
- By connectivity, Cellular technologies commanded 45.80% of the IoT Device Management market size in 2025; LPWAN protocols are the fastest-growing at 23.70% CAGR.
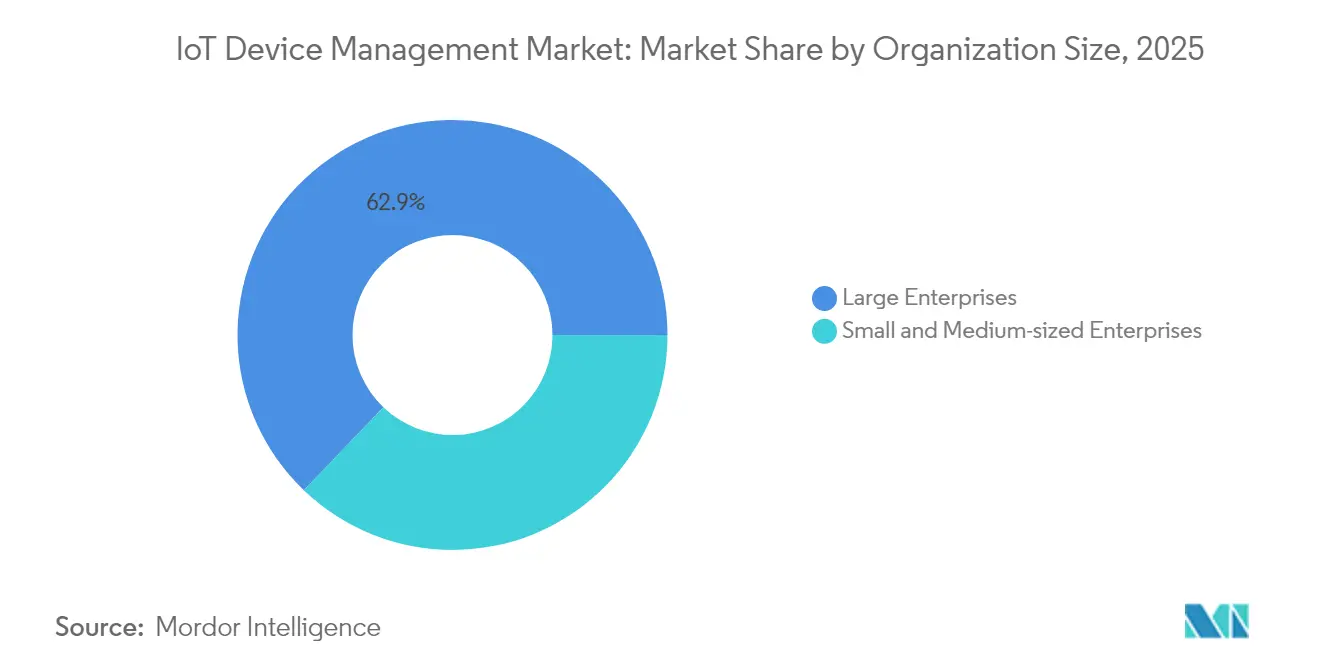
- By organization size, large enterprises led with a 62.85% share in 2025; SMEs are increasing adoption at a 22% CAGR through 2031.
- By end-user vertical, Manufacturing captured 24.35% revenue share in 2025, whereas Smart Cities and Public Safety are forecast to grow at 22.60% CAGR.
- By geography, North America accounted for 31.75% revenue share in 2025, while Asia Pacific is set to expand at a 24.10% CAGR to 2031.
Note: Market size and forecast figures in this report are generated using Mordor Intelligence’s proprietary estimation framework, updated with the latest available data and insights as of 2026.
Market Trends and Insights
Drivers Impact Analysis of IoT Device Management Market*
| Driver | (≈) % Impact on CAGR Forecast | Geographic Relevance | Impact Timeline |
|---|---|---|---|
| Proliferation of IoT endpoints | +4.20% | Global (APAC leading) | Medium term (2-4 years) |
| Security and compliance mandates | +3.80% | North America & EU | Short term (≤ 2 years) |
| Edge-cloud convergence | +3.10% | Global | Medium term (2-4 years) |
| 5G and LPWAN roll-outs | +2.90% | APAC core; MEA spill-over | Long term (≥ 4 years) |
| Source: Mordor Intelligence | |||
Proliferation of IoT Endpoints Driving Lifecycle-Management Demand
Global connected-device counts will exceed 75 billion units by 2030, overwhelming traditional IT oversight models and elevating centralized orchestration as a board-level requirement. Factory floors now deploy thousands of heterogeneous sensors that demand automated provisioning, continuous observability, and over-the-air (OTA) firmware governance. Platform engineering teams are standardizing automation templates and security baselines in order to harmonize multi-vendor fleets and ensure auditability across jurisdictions.
Heightened Security and Compliance Mandates for Device Fleets
The EU Cyber Resilience Act, enacted in 2024, mandates secure-by-design principles, software bills of materials, and continuous vulnerability management, with non-compliance fines up to EUR 15 million. Parallel directives in the United States and Japan, combined with the average 5,200 monthly attacks on IoT endpoints, are steering buyers toward platforms that embed zero-trust architectures and real-time threat detection. Thales reports that 55% of organizations now rank IoT security among their top three enterprise risks.
Edge-Cloud Shift Requiring Unified OTA and Remote Diagnostics
Latency-sensitive use cases such as collaborative robotics and autonomous guided vehicles process data locally yet still require centralized policy enforcement. Microsoft’s Azure IoT Edge allows containerized workloads to run at the equipment layer while syncing configuration, telemetry, and OTA updates with the cloud. Compact “delta” patches reduce bandwidth by up to 90%, extending battery life in remote sensors.
5G and LPWAN Roll-outs Unlocking Hyperscale Connection Volumes
5G network slicing delivers deterministic bandwidth and low latency for critical applications, whereas LPWAN variants such as LoRaWAN and NB-IoT provide low-power, wide-area reach for smart-city infrastructure. Cisco forecasts that massive machine-type communications will account for 52% of 5G traffic by 2030. LORIOT projects non-cellular LPWAN links will outnumber legacy 2G/3G M2M connections by 2026, reinforcing the need for protocol-agnostic management back-planes.
Restraints Impact Analysis of IoT Device Management Market*
| Restraint | (≈) % Impact on CAGR Forecast | Geographic Relevance | Impact Timeline |
|---|---|---|---|
| Fragmented interoperability standards | -2.10% | Global | Medium term (2-4 years) |
| Cross-border data-sovereignty constraints | -1.80% | EU-US-APAC | Short term (≤ 2 years) |
| Source: Mordor Intelligence | |||
Fragmented Interoperability Standards
Although initiatives such as Matter and OPC UA promote common schemas, the absence of universal frameworks across industrial, consumer, and municipal domains forces enterprises to juggle multiple device-management portals. An MDPI study finds that 67% of multi-vendor deployments still rely on bespoke APIs, inflating integration costs and elongating time-to-value[1].
Cross-border Data-Sovereignty Constraints
GDPR, India’s Digital Personal Data Protection Act, and China’s CSL impose residency rules that require edge gateways or in-region data lakes, complicating global fleet visibility. Multinational manufacturers must often deploy regionally segmented instances of their device-management stacks, driving up operating expenses and complicating firmware-signing workflows.
*Our forecasts treat driver/restraint impacts as directional, not additive. The impact forecasts reflect baseline growth, mix effects, and variable interactions.
IoT Device Management Market Segment Analysis
By Component:
Platform Maturation Spurs Service UptakeSolutions held a commanding 70.35% share in 2025, anchored by modules for security, provisioning, and analytics. The segment is on track for a 21.90% CAGR as enterprises re-architect brownfield assets into policy-driven, cloud-native frameworks. Security management modules are the breakout sub-category, reflecting relentless compliance pressure. Services, at 29.65%, are edging ahead in growth (22.10% CAGR) as brownfield retrofits require systems integration and as-a-service management. Managed services resonate with SMEs that lack embedded engineering teams, while professional services drive complex, multi-factory rollouts. The convergence of the two components signals commoditization at the core platform level and shifts differentiation to vertical accelerators and AI co-pilots.

By Deployment Type:
Edge-Native Architectures Gain ShareCloud continues to dominate with 67.85% share in 2025, but latency-critical workloads are pushing compute to factory floors, utility substations, and roadside cabinets. Edge-native deployments are forecast to log a 26% CAGR, propelled by 5G MEC nodes and GPU-equipped gateways. Hybrid blueprints blend global cloud scalability with deterministic local control, ensuring firmware governance and anomaly detection even during backhaul outages. AI inferencing at the edge reduces raw data backhaul up to 75%, shrinking carbon footprints and lowering carrier fees. Vendors are embedding Kubernetes-compatible runtimes, enabling DevOps-style CI/CD pipelines for OTA firmware and container updates.
By Connectivity Technology:
LPWAN Momentum AcceleratesCellular links (2G/4G/5G) constituted 45.80% of all managed endpoints in 2025, benefiting from a global footprint and SLA guarantees. However, LPWAN alternatives LoRaWAN, NB-IoT, and Sigfox are the fastest-growing cohort at 23.70% CAGR because they offer multi-kilometer reach, multi-year battery life, and sub-USD 1 modules. Netmore’s February 2025 purchase of Senet doubled its LoRa coverage footprint in North America, signaling consolidation toward nationwide public LoRaWAN grids. Device-management platforms must now auto-select optimal bearers based on power profile, data payload, and tariff.
By Organization Size:
Democratization Extends to SMEsAlthough large enterprises held 62.85% of 2025 revenue, small and medium enterprises are accelerating at 22% CAGR. Low-code orchestration dashboards, subscription-based security add-ons, and pre-certified LTE-M modules are lowering barriers. Over 40% of firms below USD 50 million revenue cite skills shortages as their main obstacle; turnkey managed services and self-service templates mitigate that constraint. The shift expands total addressable units and encourages vendors to tier pricing models by fleet size and SLA levels.
By End-user Vertical:
Smart-City Investments Outpace Industry 4.0Manufacturing led with a 24.35% share in 2025, reflecting decades of SCADA and PLC modernization. Yet municipal digitization budgets are driving a 22.60% CAGR in Smart Cities and Public Safety as urban planners deploy adaptive lighting, waste-management telemetry, and computer-vision surveillance networks. Transportation, healthcare, and energy remain robust adopters as each sector battles downtime risk and regulatory audits. Agriculture is emerging: precision-farming pilots using LoRaWAN soil sensors cut water usage 18% in 2024 field trials conducted in California’s Central Valley
Geography Analysis
North America and APAC IoT Device Management Market
North America captured 31.75% revenue in 2025, leveraging mature cloud ecosystems and early adoption in aerospace, automotive, and healthcare. Federal funding for smart-grid resilience and the National Cybersecurity Strategy further stimulates platform upgrades. Asia Pacific is the primary growth engine, expanding at a 24.10% CAGR as governments subsidize factory automation and smart-city rollouts. IDC projects 38.9 billion connected devices in the region by 2030, underpinned by widespread 5G Stand-Alone deployments that simplify SIM provisioning.
APAC and Europe IoT Device Management Market
China dominates absolute volumes, yet India and Indonesia are posting double-digit growth as carriers light up NB-IoT networks across industrial corridors. Japanese and South Korean OEMs are embedding eSIM/iSIM modules to support post-sale connectivity brokering, fueling regional demand for carrier-agnostic management consoles. Europe holds a substantial share due to GDPR and the Cyber Resilience Act, which obligate rigorous vulnerability patching regimes. These mandates favor vendors offering dependency mapping and cryptographically verifiable OTA pipelines.
MEA and South America IoT Device Management Market
Emerging regions in the Middle East and Africa are leapfrogging legacy M2M by adopting satellite-augmented LoRaWAN for oil-field telemetry and remote utility metering. South America’s adoption curve is tied to spectrum liberalization and utility modernization programs, with Brazil piloting AMI projects covering six million smart meters. Across all geographies, sovereign-cloud requirements are driving localized control planes, spurring partnerships between global hyperscalers and in-country data-center operators.
Regulatory Landscape
IoT device management deployments are increasingly shaped by horizontal cybersecurity rules and labeling programs that require provable secure-by-design controls across onboarding, identity, updates, and vulnerability handling. In the European Union, the Cyber Resilience Act (Regulation (EU) 2024/2847) entered into force on December 10, 2024, establishing baseline requirements for products with digital elements; its vulnerability and incident reporting obligations begin on September 11, 2026, pushing vendors and device owners toward continuous vulnerability management and auditable OTA patching pipelines.
In the United States, the FCC Cybersecurity Labeling for Internet of Things rule became effective on August 29, 2024, and ioXt Alliance was selected as the Lead Administrator for the U.S. Cyber Trust Mark program, effective April 13, 2026, reinforcing security labeling and assurance practices for connected products. Standards bodies are also providing compliance anchors used in procurement and assurance, including ISO/IEC 27404:2025 (published October 2025) on consumer IoT cybersecurity labeling and NIST IR 8259 Rev. 1 (finalized in April 2026) outlining foundational IoT cybersecurity activities for manufacturers that translate into device-fleet requirements such as secure credentialing, update governance, and vulnerability response workflows.
Value Chain Analysis
The IoT device management value chain spans silicon and module suppliers, OEM/ODM device manufacturers, connectivity providers, cloud and edge infrastructure, device management platform vendors, and security and identity specialists that enable device trust at scale. Partnerships show how capabilities are being bundled: T-Mobile, Thales, and SIMPL IoT launched an eSIM-based connectivity approach aligned to GSMA SGP.22/32 (March 2025), while Peridio and Keyfactor partnered to automate certificate lifecycle management alongside firmware updates (March 2025), tightening the link between device identity and OTA operations.
Downstream, solution delivery increasingly depends on integrators and managed service providers to operationalize fleet onboarding, observability, and compliance across heterogeneous environments. Collaborations such as Cumulocity with Device Authority (March 2025) and CyberArk with Device Authority and Microsoft (March 2025) show the security layer becoming a core dependency of device management, integrating authentication, privileged access controls, and policy enforcement into the management plane. For consumer and smart-home ecosystems, DigiCert and Panasonic Industry Europe aligned Device Trust Manager with PAN-MaX to accelerate Matter certification workflows (May 2025), indicating that certification and trust services are getting pulled into the device management lifecycle as part of commercialization and scale-up.
Competitive Landscape
The market remains moderately fragmented, yet consolidation is underway. Gartner’s 2024 Magic Quadrant places AWS, Microsoft, and IBM in the Leaders quadrant, each extending device management with native AI and digital-twin capabilities. Nordic Semiconductor’s USD 165 million acquisition of Memfault in June 2025 created the first silicon vendor offering an integrated chip-to-cloud lifecycle stack, pressuring MCU rivals to emulate similar vertical integration[3].
Differentiation is shifting from raw connectivity orchestration toward secure OTA, AI-based anomaly remediation, and vertical accelerators. PTC leverages its ThingWorx platform, paired with Microsoft Azure, to deliver turnkey industrial kits optimized for OEE gains[4]. Aeris introduced IoT Watchtower in February 2025, bundling cellular connectivity with on-device agent-based intrusion detection, aimed at OEMs requiring NIST compliance out of the box.
Edge-native specialists such as EdgeIQ promote “workflow-as-code” orchestration that treats devices as first-class software objects, offering coarse-grained RBAC and event-driven rule engines. Hardware incumbents Advantech and Huawei embed Kubernetes-light runtimes on gateways, enabling DevOps-style CICD within Brownfield OT estates. The competitive narrative now revolves around who can deliver seamless, policy-driven governance across heterogeneous chipsets, networks, and regulatory zones.
IoT Device Management Industry Leaders
-
Microsoft
-
Smith Micro Software
-
Advantech
-
Bosch.IO
-
IBM
- *Disclaimer: Major Players sorted in no particular order
IoT Device Management Market Companies Covered in this Report
- Microsoft
- Amazon Web Services (AWS)
- IBM
- PTC
- Software AG
- Bosch.IO
- Cisco Systems
- Oracle
- Google Cloud
- Telit Cinterion
- Advantech
- Smith Micro Software
- Aeris Communications
- AVSystem
- Samsung Knox (Samsung Electronics)
- KORE Wireless
- Eseye
- EdgeIQ
- Huawei Technologies
- Arm
- ATandT
Market Opportunities and Future Outlook
Security-driven onboarding and standardized configuration are creating whitespace for platforms that can make device identity, secure provisioning, and OTA governance repeatable across multi-vendor fleets and OT environments. IEC 62541-21:2026 (published January 2026) adds security configuration requirements for device onboarding within OPC UA, giving industrial buyers a clearer standards-based basis to request interoperable onboarding and lifecycle controls rather than bespoke integrations.
A further opportunity sits in managing resource-constrained and heterogeneous endpoints with enterprise-grade update and trust workflows, where microcontrollers and mixed RTOS/Linux fleets have historically lagged on OTA governance and compliance evidence. Northern.tech extended Mender to support microcontrollers for secure OTA updates (May 2026), signaling vendor investment in update management for constrained devices inside industrial equipment and smart infrastructure. Platform interfaces are also shifting toward agent-enabled operations, with Digi International embedding an AI agent (DANI) into Digi Remote Manager (June 2026) and Kajeet launching SentinelOS as an agent-ready operating layer (June 2026), expanding addressable use cases for device management into automated diagnostics, workflow execution, and operational decision support via APIs and modern integration patterns.
Recent Industry Developments in IoT Device Management Market
- April 2026: Microsoft refreshed the public preview for Azure IoT Hub and Azure Device Registry, strengthening standardized device identity and improving management workflows in the Azure portal. The update also expanded IoT Hub and Device Provisioning Service SDK support, including device-initiated certificate renewal, aligning device management with more automated X.509 trust operations at scale.
- June 2025: Nordic Semiconductor acquired Memfault, creating a tighter chip-to-cloud lifecycle stack that links embedded devices to fleet observability and firmware management. The deal moved silicon vendors closer to owning post-deployment device operations, raising competitive pressure on standalone platforms and MCU ecosystems to integrate crash analytics, OTA, and diagnostics.
- December 2024: Trasna acquired IoTerop, adding standards-based device management capabilities and expertise around open IoT protocols. The move supported broader interoperability and lifecycle tooling across heterogeneous device fleets, particularly where buyers prefer standards alignment over bespoke APIs.
IoT Device Management Market Report Scope and Research Methodology
Market Definition and Coverage
For this methodology, the market covers software and services used to onboard, configure, monitor, update, and secure connected IoT endpoints across their life cycle, including the tools that help keep device fleets healthy after deployment.
Scope exclusions: We exclude general IoT connectivity services and unrelated cloud infrastructure fees when they are not sold as part of device management work.
Segments Covered in This Report
- By Component
- Solutions
- Security Management
- Device Provisioning and On-boarding
- OTA Firmware and Software Updates
- Remote Monitoring and Diagnostics
- Data Management and Analytics
- Services
- Professional Services
- Managed Services
- Solutions
- By Deployment Type
- Cloud
- On-premise
- Hybrid
- Edge-native
- By Connectivity Technology
- Cellular (2G/3G/4G/5G)
- LPWAN (NB-IoT, LoRaWAN, Sigfox)
- Wi-Fi/Bluetooth
- Satellite and Others
- By Organization Size
- Small and Medium-sized Enterprises
- Large Enterprises
- By End-user Vertical
- Manufacturing
- Transportation and Logistics
- Healthcare and Life Sciences
- Retail and E-commerce
- Energy and Utilities
- Smart Cities and Public Safety
- Agriculture
- Others
- By Geography
- North America
- United States
- Canada
- Mexico
- South America
- Brazil
- Argentina
- Rest of South America
- Europe
- Germany
- United Kingdom
- France
- Italy
- Spain
- Rest of Europe
- Asia-Pacific
- China
- Japan
- India
- South Korea
- Rest of Asia-Pacific
- Middle East and Africa
- Middle East
- United Arab Emirates
- Saudi Arabia
- Turkey
- Rest of Middle East
- Africa
- South Africa
- Nigeria
- Kenya
- Rest of Africa
- Middle East
- North America
Data Sources, Market Sizing, and Validation
Desk Research
Desk research is used to set the market frame and collect measurable signals that can be checked again during interviews. We referenced public source types such as ITU indicators on connected device growth, OECD digital economy statistics, NIST publications on IoT cybersecurity practices, FCC spectrum and device authorization information, and European Commission materials on cyber resilience and device security requirements.
We also reviewed company annual reports and investor decks, product documentation, customer case studies, reputable technology press, and association websites that track IoT adoption in industries like manufacturing, utilities, and transportation. Paid subscriptions were used only where needed for standardized company financials, contract announcements, and patent lookups that help verify who is selling device management functions and how portfolios are changing. The desk research sources mentioned here are illustrative, and additional references were used to collect data, validate assumptions, and clarify open questions.
Primary Interviews and Surveys
Primary work focused on validating what buyers actually pay for, and what is counted as device management versus adjacent IoT platform or connectivity spending. We spoke with solution owners, delivery partners, enterprise IoT program teams, and channel-side implementers across APAC, EMEA, and the Americas, so the model reflects differences in device density, security needs, and preferred deployment choices.
Inputs from these discussions were used to confirm attach rates for services, typical pricing structures (per device, per site, or per tier), and the pace at which device fleets expand after pilots move to production.
Distribution of primary research fieldwork respondents
| Company type | Respondent position | Region |
|---|---|---|
| Top tier: 39% | CXOs: 18% | APAC: 41% |
| Mid tier: 41% | Functional/Unit leaders: 27% | EMEA: 34% |
| Smaller Players: 20% | Managers: 55% | Americas: 25% |
Market-Sizing & Forecasting
Sizing starts with a top-down build where IoT endpoint growth and enterprise adoption signals are used to reconstruct the addressable spend pool for device lifecycle operations, and then it is filtered by how often centralized management is used for those fleets. The total is subsequently corroborated with selective bottom-up checks, such as sample pricing per managed device, typical device counts by use case, and provider revenue exposure to device management functions.
A few inputs materially shape the model, including the installed base of managed IoT endpoints, the share of deployments that require secure provisioning and remote firmware updates, cloud versus on-premises deployment preferences, the mix between software subscriptions and service-led rollouts, and average contract duration for managed services. When vendor disclosures do not separate device management from nearby offerings, the split is estimated using product mapping, service scope descriptions, and interview-led allocation ratios, then rechecked against reported segment growth patterns.
For forecasting, scenario analysis is used so adoption curves can be adjusted based on security regulation momentum, enterprise spending cycles, and the pace of industrial IoT expansions. Assumptions are tuned using consensus ranges from interview feedback, and short-term growth is sanity-checked against announced large-scale rollouts and device fleet expansion plans shared by buyers.
Data Validation & Update Cycle
Outputs are validated through several checks that look for mismatches between model totals and independent market signals, such as device shipment momentum, enterprise IoT program activity, and subscription revenue patterns reported by suppliers. Large variances trigger follow-up calls and a second pass on pricing, service attachment, and regional mix assumptions, and the dataset is then reviewed by another analyst before sign-off.
The report is refreshed on an annual cycle, with interim updates added when there are material events like major regulation changes, sizable product shifts, or visible price moves in common contract structures. Before delivery, a final review pass is completed so the numbers reflect the latest public information and confirmed interview inputs.
Mordor Intelligence's IOT Device Management Market Size Versus Other Published Estimates
Published market sizes for IoT device management can look far apart because the same buyer budget is labeled differently across studies. The gaps usually come from what gets counted inside device management, what year is treated as the starting point, and whether pricing is tied to managed endpoints or to broader IoT software bundles.
Some estimates fold in broader IoT platform layers like application enablement, connectivity management, and analytics that sit next to device management in enterprise deployments. In Mordor Intelligence, the value is counted only for device registration, monitoring, security, configuration, and update functions (plus related professional and managed services), and then adjacent platform revenue is kept out to avoid double counting.
Benchmark comparison
| Source | Market Size | Gaps in Research Methodology |
|---|---|---|
| Mordor Intelligence | USD 10.66 B (2026) | |
| Industry Publication A | USD 3.54 B (2023) | Uses an earlier base year and appears to apply a narrower paid-scope view that emphasizes device monitoring and security modules, which can undercount service-heavy implementations and multi-year managed contracts. |
| Consultancy Brief B | USD 2.20 B (2022) | Anchors the estimate to a smaller starting year and may treat device management mainly as software licenses, which can miss implementation and managed services that buyers often bundle into the device lifecycle program. |
The table shows that most of the spread is explained by scope choices and base-year selection, followed by how recurring fees are annualized for per-device pricing. By keeping variables like managed endpoint base, software versus services mix, and deployment preference visible and easy to recheck, the final number stays traceable and practical for planning.
Key Questions Answered in the Report
What is the current value of the IoT Device Management market?
The market stands at USD 10.66 billion in 2026 and is forecast to grow to USD 27.94 billion by 2031.
Which region is growing fastest for IoT device management solutions?
Asia Pacific is set to expand at a 24.10% CAGR through 2031, propelled by smart-city funding and industrial automation rollouts.
Why are edge-native deployments gaining traction?
Latency-sensitive applications and on-premises data-sovereignty rules are pushing compute closer to devices, resulting in a 26% CAGR for edge-native architectures.
How are security regulations affecting platform demand?
Frameworks such as the EU Cyber Resilience Act require continuous vulnerability management and penalties up to EUR 15 million, prompting enterprises to favor platforms with integrated, zero-trust security features.
Which connectivity technology is rising fastest?
LPWAN protocols, particularly LoRaWAN and NB-IoT, are growing at a 23.70% CAGR owing to their long-range, low-power profile suitable for smart-city and industrial sensors.
What strategic moves are reshaping the competitive landscape?
Nordic Semiconductor’s acquisition of Memfault, Netmore’s purchase of Senet, and Aeris’ launch of IoT Watchtower exemplify consolidation toward integrated, secure chip-to-cloud stacks.