IoT Analytics Market Size and Share
Market Overview
| Study Period | 2020 - 2031 |
|---|---|
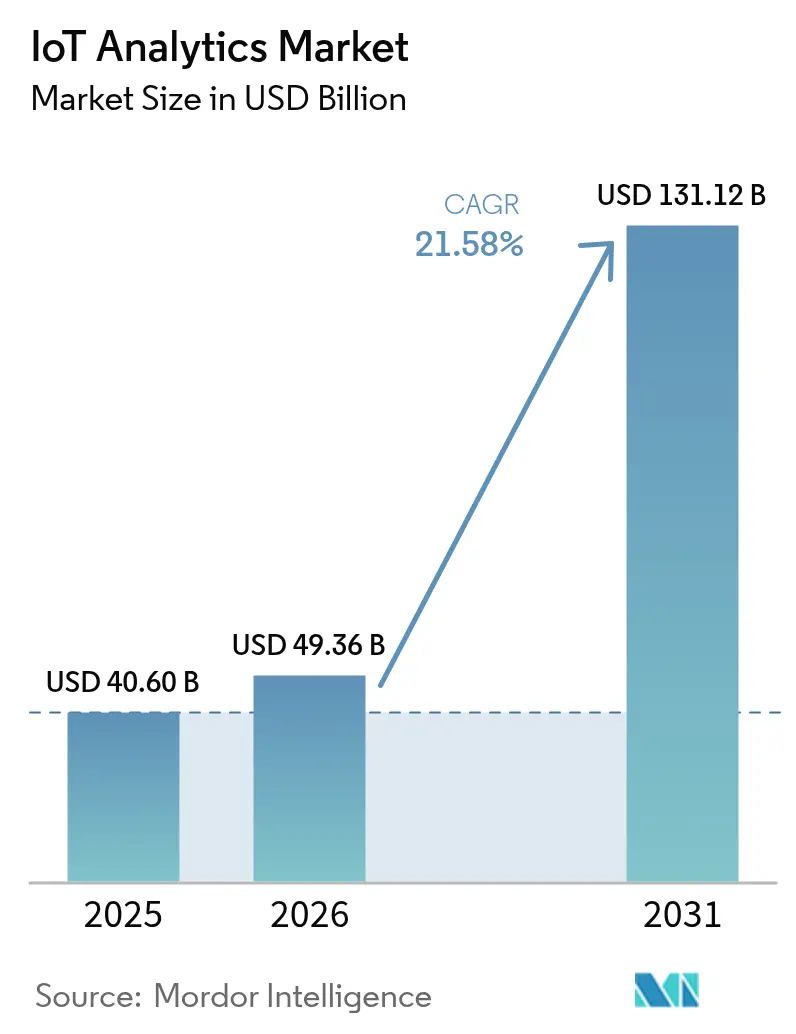
| Market Size (2026) | USD 49.36 Billion |
| Market Size (2031) | USD 131.12 Billion |
| Growth Rate (2026 - 2031) | 21.58% CAGR |
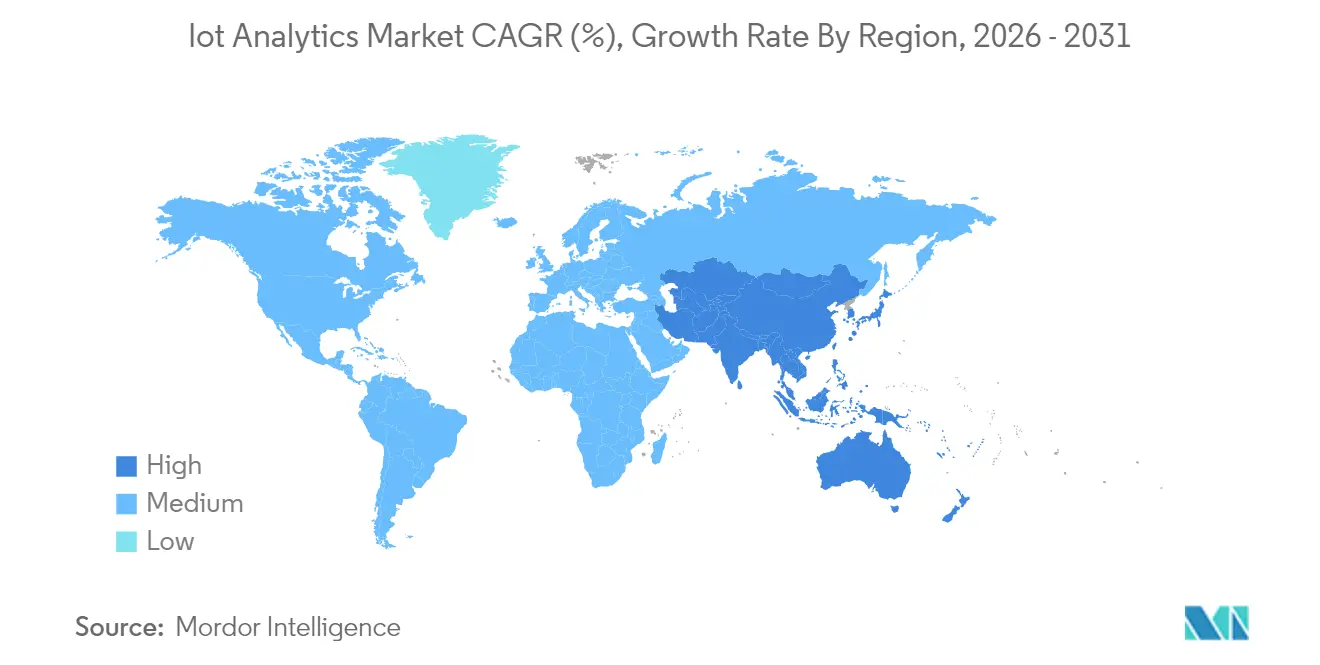
| Fastest Growing Market | Asia Pacific |
| Largest Market | Asia Pacific |
| Market Concentration | Medium |
Major Players *Disclaimer: Major Players sorted in no particular order Image © Mordor Intelligence. Reuse requires attribution under CC BY 4.0. | |
IoT Analytics Market Analysis by Mordor Intelligence
The IoT analytics market size was valued at USD 40.60 billion in 2025 and estimated to grow from USD 49.36 billion in 2026 to reach USD 131.12 billion by 2031, at a CAGR of 21.58% during the forecast period (2026-2031). Rapid device proliferation, edge–AI convergence, and enterprise digital-transformation programs underpin this expansion. Enterprises are moving analytic workloads closer to connected assets, reducing latency and bandwidth costs while improving operational decisions. Demand is reinforced by predictive-maintenance success stories in asset-intensive sectors and by sustainability mandates that call for continuous performance monitoring. Competitive intensity is strengthening as cloud hyperscalers, specialist vendors, and edge-platform providers leverage partnerships and acquisitions to secure ecosystem advantages.
Key Report Takeaways
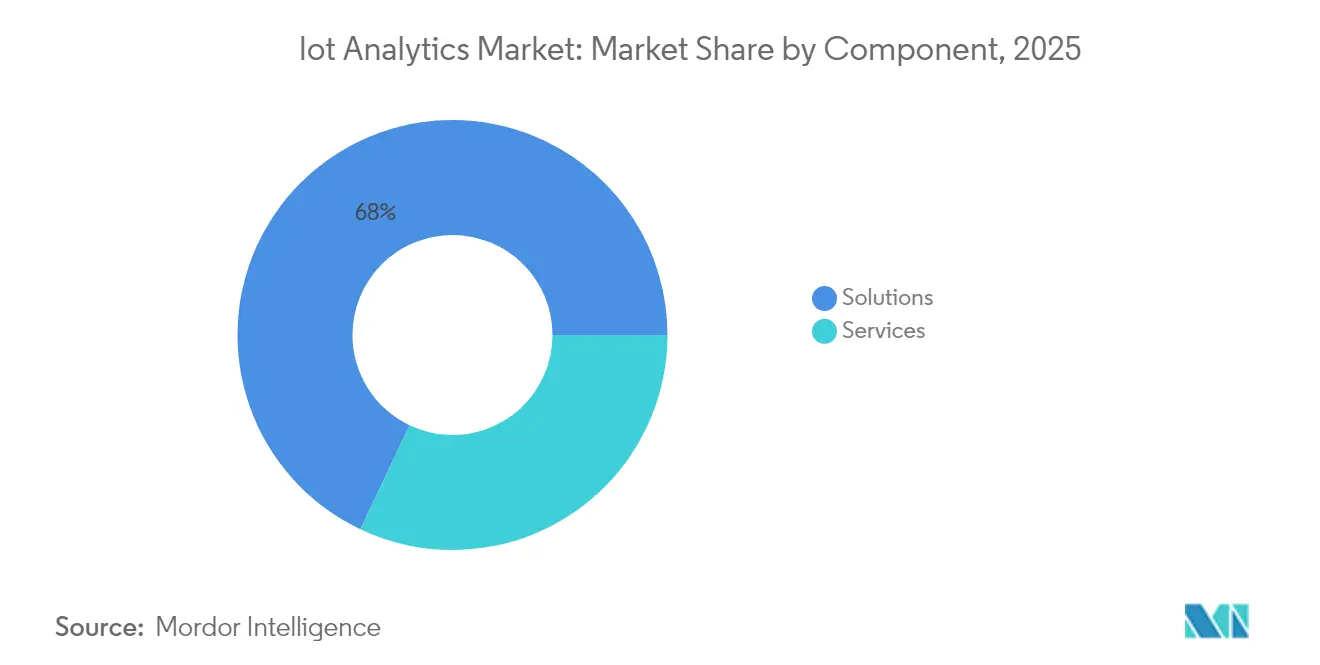
- By component, Solutions held 67.95% of IoT analytics market share in 2025; Services is projected to expand at a 23.12% CAGR through 2031.
- By deployment, on-premise dominated with 64.62% revenue share in 2025, while cloud deployment is advancing at a 23.30% CAGR to 2031.
- By organization size, Large Enterprises captured 71.28% share of the IoT analytics market size in 2025; Small and Medium Enterprises are growing fastest at 22.85% CAGR.
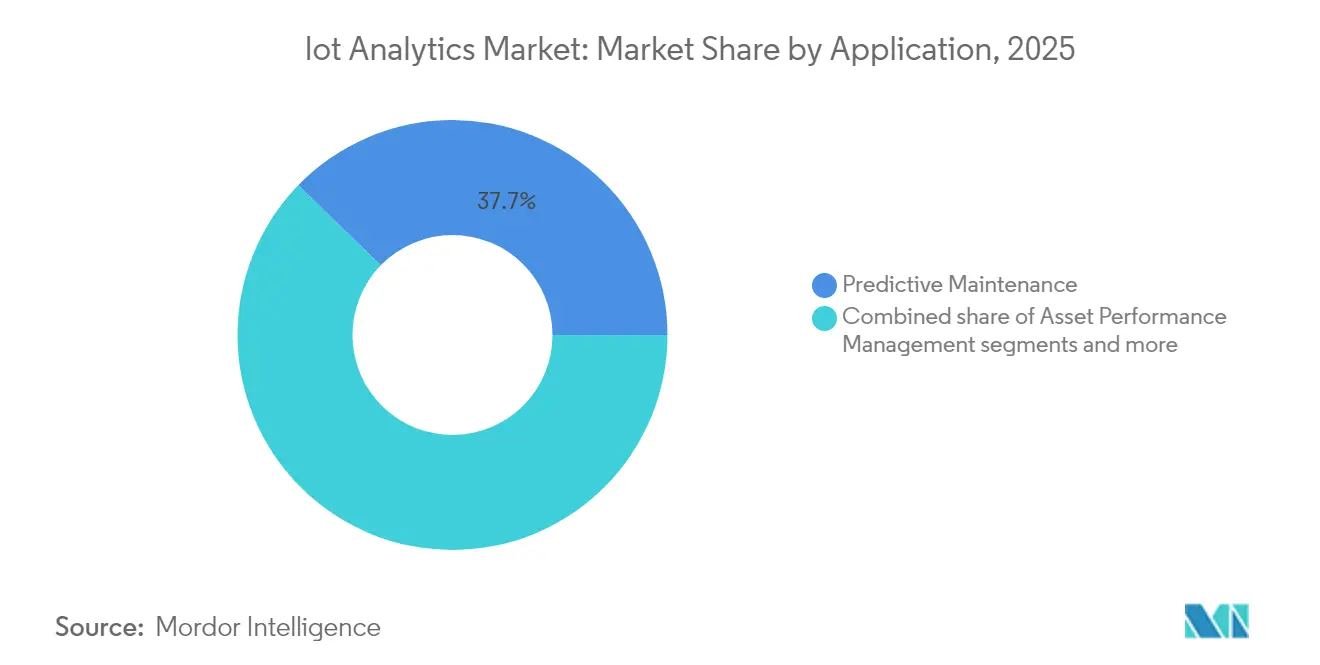
- By application, Predictive Maintenance accounted for 37.74% of the IoT analytics market size in 2025, whereas Asset Performance Management is rising at 22.15% CAGR.
- By end-user industry, Manufacturing led with 31.02% revenue share in 2025; Energy and Utilities is forecast to grow at 21.94% CAGR.
- By geography, Asia-Pacific commanded 35.86% of 2025 revenue and is expanding at a 22.84% CAGR through 2031.
Note: Market size and forecast figures in this report are generated using Mordor Intelligence’s proprietary estimation framework, updated with the latest available data and insights as of 2026.
Global IoT Analytics Market Trends and Insights
Drivers Impact Analysis*
| Driver | (~) % Impact on CAGR Forecast | Geographic Relevance | Impact Timeline |
|---|---|---|---|
| Proliferation of IoT devices generating exabyte-scale data | +6.8% | Global, APAC leading | Medium term (2-4 years) |
| Cloud-native analytics platforms gaining enterprise acceptance | +4.2% | North America & Europe core | Short term (≤ 2 years) |
| Predictive-maintenance demand across asset-intensive industries | +3.9% | Global, manufacturing hubs | Medium term (2-4 years) |
| Edge-AI accelerators enabling sub-second analytics | +2.8% | Advanced economies first | Long term (≥ 4 years) |
| Enterprise data-fabric architectures unifying siloed streams | +2.1% | North America & EU | Medium term (2-4 years) |
| ESG-driven sustainability monitoring mandates | +1.4% | EU leading | Long term (≥ 4 years) |
| Source: Mordor Intelligence | |||
Proliferation of IoT Devices Generating Exabyte-Scale Data
Connected-device counts are rising sharply, with global IoT endpoints expected to produce more than 175 zettabytes of data annually by 2025. Plant-level sensor arrays already emit terabytes each day, forcing enterprises to deploy analytics engines at the edge to avoid cloud-backhaul delays. Manufacturers adopting this edge-first model record 30% higher operational efficiency versus cloud-only setups. The data surge spans structured telemetry, unstructured video, and log files, prompting investment in multimodal analytic frameworks that can handle diverse payloads concurrently.
Cloud-Native Analytics Platforms Gaining Enterprise Acceptance
Scalable, pay-as-you-go services such as Microsoft Azure IoT Operations allow firms to ingest billions of daily messages while cutting infrastructure outlays by up to 60%[1]Sam George, “Real-Time Intelligence in Microsoft Fabric,” azure.microsoft.com. Zero-trust architectures and built-in threat analytics lessen security concerns, accelerating full-cloud adoption in manufacturing and logistics. Highly regulated verticals continue to blend cloud and local processing, but migration momentum remains strong as providers extend compliance toolkits.
Predictive-Maintenance Demand Across Asset-Intensive Industries
Machine-learning models trained on vibration, temperature, and acoustic signatures alert maintenance teams weeks before failure. Manufacturers cite 25–30% maintenance-cost reductions and 70% drops in unplanned stoppages. Utilities mirror these gains, saving millions in outage-prevention spend. Digital-twin simulations refine schedule optimization further, moving maintenance from time-based to condition-based protocols.
Edge-AI Accelerators Enabling Sub-Second Analytics
Purpose-built inference chips embedded in gateways slash response times from seconds to milliseconds. Half of global enterprises are projected to adopt edge computing by 2029 as quality-inspection, autonomous-vehicle, and smart-city scenarios require real-time reasoning. Local processing trims network traffic by 90% and ensures resilience when connectivity falters.
Restraints Impact Analysis*
| Restraint | (~) % Impact on CAGR Forecast | Geographic Relevance | Impact Timeline |
|---|---|---|---|
| Data-privacy and cross-border compliance complexity | -3.2% | EU GDPR leading | Short term (≤ 2 years) |
| Shortage of IoT data-science talent pool | -2.8% | Global, acute in emerging markets | Medium term (2-4 years) |
| Industrial-protocol fragmentation hindering interoperability | -1.9% | Manufacturing regions | Long term (≥ 4 years) |
| Rising telemetry bandwidth costs for high-frequency sensors | -1.1% | Areas lacking 5G | Medium term (2-4 years) |
| Source: Mordor Intelligence | |||
Data-Privacy and Cross-Border Compliance Complexity
GDPR imposes stringent consent, minimization, and localization rules; non-compliance can cost 4% of global turnover. Divergent national laws force firms to maintain multiple regional data stores, inflating project budgets by up to 25%. Real-time analytics crossing borders must incorporate policy-aware routing to satisfy sovereignty mandates, slowing enterprise rollouts.
Shortage of IoT Data-Science Talent Pool
Industry surveys reveal a 10-million-person gap in combined IoT and analytics expertise by 2027[2]KC Liu, “Bridging the IoT Talent Gap,” advantech.com. SMEs struggle to recruit, delaying projects or outsourcing to managed-service providers. Vendors respond with low-code tooling, yet complex industrial use cases still demand niche domain knowledge that remains scarce.
*Our forecasts treat driver/restraint impacts as directional, not additive. The impact forecasts reflect baseline growth, mix effects, and variable interactions.
Segment Analysis
By Component: Services Acceleration Outpaces Solutions Growth
Solutions continued to dominate, accounting for 67.95% revenue in 2025. The IoT analytics market size for solutions is forecast to increase steadily, yet the services category is set to expand faster at 23.12% CAGR as firms seek managed expertise. Professional services are in high demand for protocol mapping, edge-stack tuning, and multi-cloud integration.
The talent shortfall and rising architectural complexity make external partners attractive. Managed-service contracts often bundle software, infrastructure, and outcome-based SLAs, shifting risk to providers. Security-analytics sub-segments are buoyed by expanding attack surfaces tied to connected devices.


By Deployment: Cloud Momentum Challenges On-Premise Dominance
On-premise installations held 64.62% share in 2025, reflecting control, latency, and regulatory needs. Yet cloud instances are growing at 23.30% CAGR as hyperscalers couple ingestion pipelines with serverless analytic engines. Hybrid designs route time-critical workloads to edge nodes while sending aggregated data to the cloud for batch AI.
Microsoft and Amazon lead with composable offerings, enabling enterprises to spin up digital twins and large-scale model training within minutes. Supply-chain volatility and energy-price swings underline the need for elastic compute, further pushing cloud uptake.
By Organization Size: SME Adoption Accelerates Through Democratization
Large enterprises represented 71.28% of 2025 spending, but SMEs are posting the fastest 22.85% CAGR. Cloud subscriptions priced by device and message volume lower entry barriers, and sector-specific templates reduce configuration effort.
European manufacturers illustrate the shift, using low-code dashboards to visualize machine throughput and energy intensity without specialist programmers. However, resource limits still steer SMEs toward turnkey packages instead of complex bespoke stacks.
By Application: Asset Performance Management Gains Momentum
Predictive maintenance retained 37.74% share in 2025 and continues to anchor investment decisions. The IoT analytics market share for asset-performance management is smaller today yet expanding at 22.15% CAGR, reflecting growing emphasis on holistic lifecycle optimization.
Digital twins replicate asset behavior under variable loads, letting operators test interventions virtually. Energy-management suites help companies meet carbon-reduction targets, while supply-chain analytics improve fleet routing amid e-commerce surges.
By End-User Industry: Energy Sector Transformation Accelerates
Manufacturing led with 31.02% contribution in 2025, underpinned by Industry 4.0 initiatives. The IoT analytics market size serving energy and utilities is projected to climb fastest at 21.94% CAGR as grid-modernization and renewable-integration projects multiply.
Utilities deploy analytics to balance distributed generation, predict transformer failures, and optimize storage assets. Transportation players use telematics to reduce idle time and monitor driver safety, and healthcare providers expand remote-patient monitoring to ease hospital capacity strains.
Geography Analysis
Asia-Pacific delivered 35.86% of 2025 revenue, benefiting from government programs such as “Made in China 2025” and India’s Smart Cities Mission. Regional CAGR of 22.84% underscores the scale of industrial digitization, 5G rollout, and edge-AI pilots. Chinese factories deploy vision-based quality control, while Indian municipalities apply sensor networks to manage waste and traffic.
North America follows closely, with mature cloud infrastructure and early AI adoption. Enterprises integrate streaming analytics with digital-operations centers, aided by robust venture funding and university research pipelines. The region remains a test-bed for autonomous-mobility and precision-agriculture projects.
Europe posts steady growth as ESG compliance drives real-time emissions monitoring. Initiatives under the European Green Deal push utilities and manufacturers toward data-driven efficiency. Emerging markets in Latin America and the Middle East gain momentum as telecom operators extend NB-IoT and 5G coverage, enabling greenfield deployments in logistics, oil, and public safety.

Competitive Landscape
The IoT analytics market is moderately fragmented. Cloud hyperscalers—Microsoft, Amazon Web Services, IBM, and Google—bundle connectivity, storage, and advanced analytics. Their scale gives them pricing leverage and built-in AI services. Specialist vendors such as SAS, PTC, and Splunk differentiate with deep domain content and low-code model builders.
Strategic alliances accelerate innovation. Microsoft acquired CyberX to strengthen device-level security controls, while Planon’s purchase of Axonize enhances smart-building offerings. Vendors race to embed digital-twin frameworks and automated machine-learning pipelines, shortening time to insight for customers.
Emerging edge-platform providers target sub-second decision-making in robotics and autonomous transport. They promote containerized runtimes that operate on factory gateways and ruggedized servers. Market entrants focusing on vertical-specific use cases—agtech, med-tech, and municipal services—gain traction by solving regulatory and data-model challenges unique to those fields. Overall, competitive intensity is expected to rise as open-source analytics stacks mature and device makers embed onboard inference capabilities.
IoT Analytics Industry Leaders
Microsoft Corporation
Amazon Web Services, Inc.
Cisco Systems, Inc
Oracle Corporation
IBM Corporation
- *Disclaimer: Major Players sorted in no particular order

Recent Industry Developments
- March 2025: Samsara Inc. reported Q4 2025 revenue of USD 346.3 million, reflecting 25% year-over-year growth, with Annual Recurring Revenue reaching USD 1.458 billion and its customer base expanding to 2,506 organizations, underscoring rising enterprise demand for IoT analytics platforms.
- December 2024: Samsara unveiled its AI-powered Samsara Intelligence suite and Low Bridge Strike Alerting, noting that its platform processes more than 10 trillion data points annually and that Asset Tags product revenue grew by over 100% quarter on quarter.
- October 2024: Honeywell and Google Cloud formed a strategic alliance to accelerate autonomous industrial operations by combining Honeywell’s operational-technology domain expertise with Google Cloud’s artificial-intelligence services.
- May 2024: Microsoft introduced Real-Time Intelligence inside Microsoft Fabric, providing fully managed ingestion, transformation, and visualization for streaming IoT data and enabling event-driven decision-making at scale.


Research Methodology Framework and Report Scope
Market Definitions and Key Coverage
Our study defines the IoT analytics market as every software solution and related managed service that captures, stores, processes, and visualizes data generated by connected sensors, controllers, and gateways deployed across industrial, commercial, and citywide networks. Insights platforms that embed machine learning, real-time streaming engines, and domain dashboards are fully included, together with subscription-based support delivered by vendors or systems integrators.
Scope exclusion: Consumer-only mobile app analytics and stand-alone business intelligence tools that lack native IoT data connectors are not counted.
Segmentation Overview
- By Component
- Solutions
- Network Management
- Security Analytics
- Real-time Streaming Analytics
- Data Management and Storage Analytics
- Visualization and Dashboard
- Services
- Professional Services
- Managed Services
- Solutions
- By Deployment
- On-premise
- Cloud
- By Organisation Size
- Large Enterprises
- Small and Medium Enterprises (SMEs)
- By Application
- Predictive Maintenance
- Asset Performance Management
- Energy Management
- Supply-Chain and Logistics Optimisation
- Other Applications
- By End-User Industry
- Manufacturing
- Energy and Utilities
- Transportation and Logistics
- Retail and E-Commerce
- Healthcare and Life Sciences
- Other End-User Industries
- By Geography
- North America
- United States
- Canada
- Mexico
- Europe
- Germany
- United Kingdom
- France
- Italy
- Spain
- Russia
- Rest of Europe
- Asia-Pacific
- China
- Japan
- India
- South Korea
- Australia and New Zealand
- Rest of Asia-Pacific
- South America
- Brazil
- Argentina
- Rest of South America
- Middle East and Africa
- Middle East
- Saudi Arabia
- United Arab Emirates
- Turkey
- Rest of Middle East
- Africa
- South Africa
- Nigeria
- Rest of Africa
- Middle East
- North America
Detailed Research Methodology and Data Validation
Primary Research
Mordor analysts interviewed platform architects at hyperscalers, operations leaders in manufacturing, and service providers in Asia-Pacific, North America, and Europe. Dialogues clarified typical sensor density, edge-to-cloud processing ratios, pricing models, and emerging compliance pain points, which helped us adjust desk findings and tighten assumptions.
Desk Research
We began by mapping the device universe and traffic volumes reported by publicly available sources such as the International Telecommunication Union, US Energy Information Administration, European Union IoT policy briefings, and trade bodies including the Industrial Internet Consortium. Company 10-Ks, product roadmaps, and contract notices supplied granular adoption clues, while patent families accessed through Questel signaled technology trajectories.
Revenue splits and regional shipment data were cross-checked with D&B Hoovers, Dow Jones Factiva news flow, and customs datasets from Volza to ground early estimates. These references are illustrative only; many additional open-source and paid datasets informed the desk review.
Market-Sizing & Forecasting
A top-down demand pool was constructed from installed IoT device counts, average data payload per node, and prevailing analytics spend per gigabyte in each industry, which are then corroborated with selective bottom-up roll-ups of vendor revenue disclosures and channel checks. Key variables inside the model include connected device growth, cloud storage cost curves, subscription average recurring revenue, edge AI accelerator shipments, regulatory reporting mandates, and predictive maintenance penetration. Multivariate regression linked these drivers to historical market values before ARIMA smoothing projected totals through 2030. Gaps in vendor disclosures were bridged by regional price benchmarking and forecast ratios derived from primary interviews.
Data Validation & Update Cycle
Outputs pass three-layer checks: variance against independent series, peer review by a senior analyst, and final sign-off after any anomaly is resolved. The dataset refreshes annually, with interim updates whenever material events or currency shifts exceed preset thresholds.
Why Mordor's IoT Analytics Baseline Commands Decisive Confidence
Published figures often diverge because firms pick different component bundles, refresh cadences, and currency bases. Our disciplined scope, device-level variable tracking, and yearly recalibration reduce those gaps and give decision-makers a stable starting point.
Key gap drivers include some publishers counting generic BI software, others applying aggressive adoption ramps without validating device inventories, and a few locking exchange rates at announcement year rather than at constant 2025 dollars.
Benchmark comparison
| Market Size | Anonymized source | Primary gap driver |
|---|---|---|
| USD 40.60 B (2025) | Mordor Intelligence | |
| USD 42.35 B (2025) | Global Consultancy A | Uses supplier survey averages that inflate spending in emerging regions |
| USD 36.02 B (2024) | Trade Journal B | Excludes managed services and applies static sensor counts |
Taken together, the comparison shows that Mordor's balanced inclusion rules, live currency alignment, and verified device baselines deliver a dependable market view clients can trace back to clear, reproducible steps.


Key Questions Answered in the Report
What is the projected value of the IoT analytics market by 2031?
The market is expected to reach USD 131.12 billion in 2031, expanding at a 21.58% CAGR.
Which region currently leads in IoT analytics adoption?
Asia-Pacific accounts for 35.86% of global revenue and is growing the fastest at a 22.84% CAGR.
Why are services outpacing solutions in growth?
Enterprises outsource analytics to specialist providers to overcome talent shortages, driving the services segment at a 23.12% CAGR.
How much can predictive-maintenance programs reduce equipment breakdowns?
Asset-intensive firms report 70% fewer unplanned stoppages after deploying IoT-driven predictive maintenance.
What security frameworks are encouraging cloud-native analytics adoption?
Zero-trust architectures and built-in threat analytics from providers such as Microsoft Azure are alleviating data-security concerns.
What is the main regulatory hurdle for global IoT analytics deployments?
GDPR-aligned data-sovereignty rules can raise project costs by up to 25% due to localization requirements.
Page last updated on:


