
Investment Casting Market Size and Share
Market Overview
| Study Period | 2019 - 2031 |
|---|---|
| Market Size (2026) | USD 18.45 Billion |
| Market Size (2031) | USD 23.82 Billion |
| Growth Rate (2026 - 2031) | 5.24 % |
| Fastest Growing Market | North America |
| Largest Market | Asia-Pacific |
| Market Concentration | Medium |
Major Players *Disclaimer: Major Players sorted in no particular order Image © Mordor Intelligence. Reuse requires attribution under CC BY 4.0. | |
Investment Casting Market Analysis by Mordor Intelligence
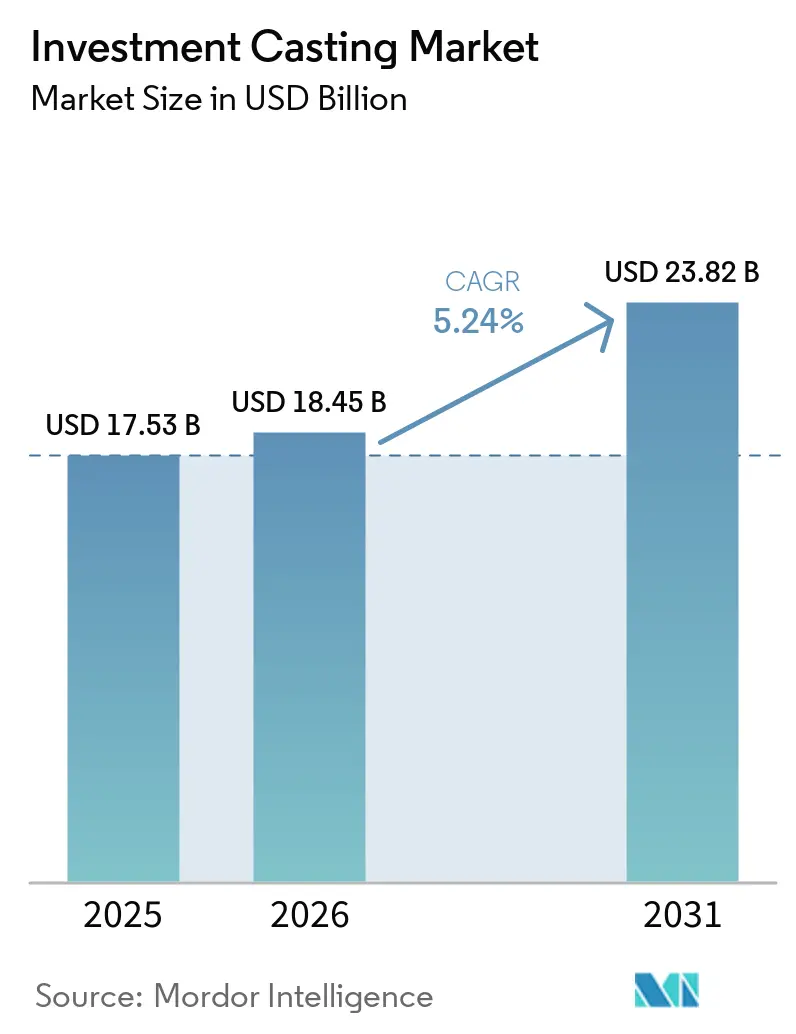
The investment casting market size was valued at USD 17.53 billion in 2025 and is expected to reach USD 18.45 billion in 2026 and USD 23.82 billion by 2031, growing at a CAGR of 5.24% over 2026-2031. The investment casting market is benefiting from steady precision manufacturing demand in aerospace, automotive, and energy applications, where complex metal parts must meet tight dimensional limits and high thermal performance. The process keeps its position because near-net-shape production reduces post-machining work, lowers scrap, and improves cost control for parts with demanding geometries. The investment casting market is also moving toward higher-value applications as silica-sol systems, hybrid shell approaches, and digital pattern workflows improve surface finish, repeatability, and qualification readiness for critical programs. Competitive behavior in the investment casting market remains split between aerospace-focused foundries that depend on certifications, process control, and alloy capability, and larger-volume suppliers that compete on cost, scale, and delivery. Raw material volatility, refractory supply pressure, skilled labor shortages, and emissions compliance remain real constraints, but re-localization programs in the United States and Europe continue to support fresh capital spending and medium-term capacity additions.
Key Report Takeaways
- By process type, silica-sol led with a 50.78% share in 2025, while hybrid and other processes are forecast to expand at 5.30% CAGR through 2031.
- By material, stainless steel held a 32.98% share in 2025, while superalloys are projected to grow at 5.76% CAGR through 2031.
- By end-user, aerospace and defense accounted for a 36.07% share in 2025, while energy and power are expected to record the fastest CAGR at 5.58% through 2031.
- By pattern technology, conventional wax patterns captured 86.47% share in 2025, while 3D-printed and rapid prototype patterns are expected to advance at 5.74% CAGR through 2031.
- By component weight, the 1-10 kg range held a 51.94% share in 2025, while the up-to-1 kg range is forecast to grow at 5.32% CAGR through 2031.
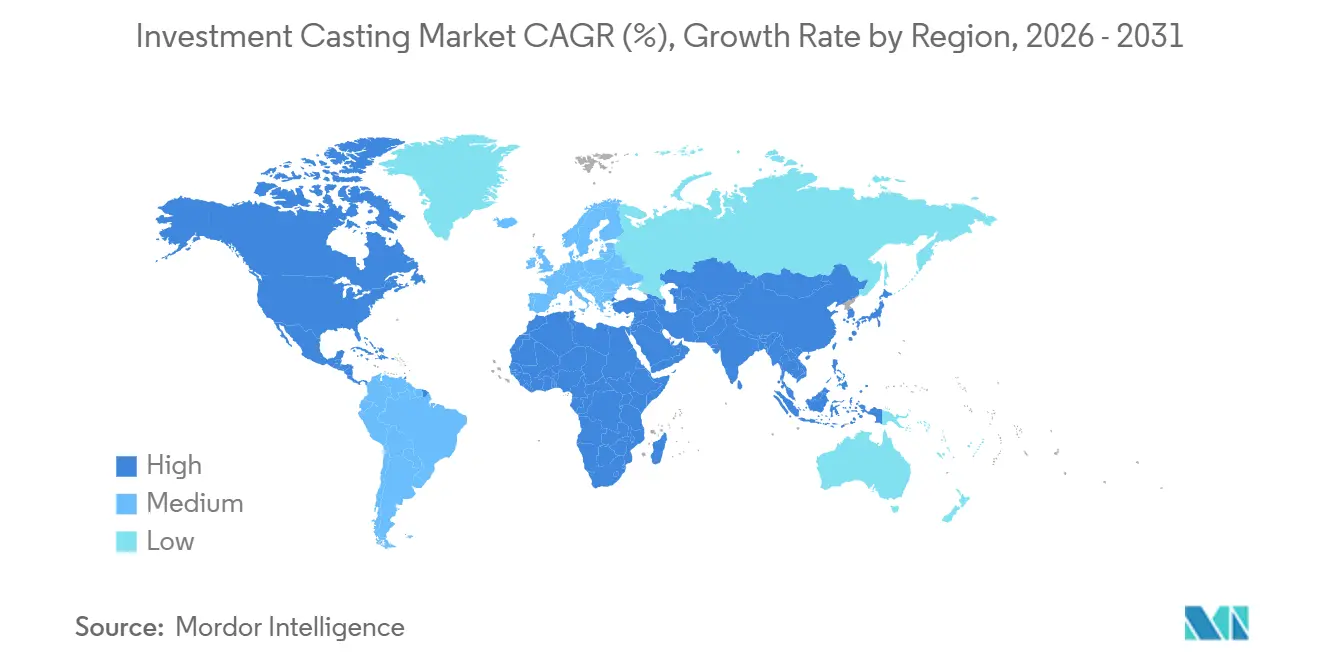
- By geography, Asia-Pacific held a 43.97% share in 2025, while North America is projected to expand at 5.36% CAGR through 2031.
Note: Market size and forecast figures in this report are generated using Mordor Intelligence’s proprietary estimation framework, updated with the latest available data and insights as of 2026.
Market Trends and Insights
Drivers Impact Analysis of Investment Casting Market*
| Driver | (~) % Impact on CAGR Forecast | Geographic Relevance | Impact Timeline |
|---|---|---|---|
| Fleet-Renewal Programs | +1.5% | Global, strongest in North America, Europe, and Asia-Pacific aerospace corridors | Medium term (2-4 years) |
| Lightweighting in Automotive Components | +0.8% | Asia-Pacific, North America, and Europe | Medium term (2-4 years) |
| Hydrogen and E-Fuel Turbines | +0.7% | Europe and North America, with early spillover to Asia-Pacific | Long term (≥ 4 years) |
| Supply-Chain Re-Localization Incentives | +0.6% | North America and Europe, with spillover to India | Medium term (2-4 years) |
| Near-Net-Shape Casting | +0.5% | Global | Short term (≤ 2 years) |
| Prototyping Boosts Casting Demand | +0.4% | Global, with early gains in North America and Western Europe | Short term (≤ 2 years) to Medium term (2-4 years) |
| Source: Mordor Intelligence | |||


Fleet-Renewal Programs in Commercial and Defense Aviation
Commercial and military aviation continues to be the largest structural demand base for the investment casting market. Fleet renewal programs support demand for turbine blades, structural nodes, and complex airfoil parts that must perform under high heat and stress. The investment casting market also benefits when OEMs consolidate multiple aerofoil parts into a single casting, because part count can fall by up to 60% and assembly complexity declines at the same time. This matters because fewer joints improve weight, simplify inspection, and reduce supply chain handoffs for aerospace customers. Defense aviation adds another layer of support because high-temperature castings remain essential in propulsion systems and other critical platforms. As a result, the investment casting market continues to see aerospace as the segment where technical entry barriers, qualification cycles, and long program lives create the most durable demand base.
Lightweighting Push in Automotive Components
While automotive lightweighting bolsters the investment casting market, demand isn't uniformly spreading across all part categories. A peer-reviewed study highlighted that in 2019, European vehicles saw significant aluminum content, projected to increase by 2026, with casting leading as the dominant forming route. However, in the investment casting realm, this doesn't spell widespread growth for every drivetrain component, as electric platforms curtail some traditional cast content. Another peer-reviewed study pointed out that while battery electric vehicles reduce cast aluminum in drivetrains, mega-casting boosts the share in body structures and shifts precision casting demand towards structural nodes and thermal management components. Essentially, the investment casting market thrives where geometry, tolerance, and material demands outstrip simpler forming methods. Consequently, automotive opportunities have become more discerning, favoring EV motor housings, suspension parts, turbocharger wheels, and heat-management assemblies over generic commodity volumes.
Shift to Hydrogen and E-Fuel Turbines Needing Complex Hot-Section Parts
Hydrogen co-firing and e-fuel turbine platforms are widening the technical role of the investment casting market. These applications push combustion temperatures higher and increase the need for blades and hot-section parts with complex internal cooling paths that conventional machining cannot deliver at the same level. ZEISS reported that Doncasters improved inspection throughput by 2 to 3 times through optical 3D scanning for next-generation turbine components, which shows how process control is moving closer to the part design stage [1]“Fueling The Future,” ZEISS, zeiss.com . The investment casting market is well placed here because directional solidification and single-crystal structures are often required when thermal loads rise beyond the comfort range of standard alloys. A peer-reviewed review also notes that mold-metal reactions in nickel superalloy casting remain the main yield-limiting factor, which makes shell chemistry and process know-how a real competitive advantage. This keeps the investment casting market tied not only to turbine growth, but also to inspection systems, ceramic shell design, and premium alloy processing capability.
Supply-Chain Re-Localization Incentives in U.S./EU Foundry Sectors
Re-localization programs are becoming a structural support for the investment casting market in North America and Europe. In early 2026, the American Foundry Society reported that U.S. foundries experienced an increase in reshored order activity. Additionally, many of these foundries planned capital spending in 2026, with a strong focus on automation, robotics, sensors, and environmental controls. These investments matter because the investment casting market in higher-cost regions cannot expand on labor economics alone and needs higher productivity to stay competitive. In the United States, Build America, Buy America requirements are increasing the pull for domestic melt-and-pour capacity in federally funded projects and are improving visibility for qualifying foundries[2]“Navigating BABA Compliance,” IPC Foundry Group, ipcfoundry.com. Europe is following a similar path through industrial policy and supply chain diversification goals, which adds support for regional sourcing of precision parts. The effect is that the investment casting market is seeing a capex cycle shaped by policy, compliance, and security of supply rather than by pure cyclical demand alone.
Restraints Impact Analysis of Investment Casting Market*
| Restraint | (~) % Impact on CAGR Forecast | Geographic Relevance | Impact Timeline |
|---|---|---|---|
| Automation and Inspection Equipment | -0.5% | Global, with stronger pressure in North America and Europe | Medium term (2-4 years) |
| Nickel and Ceramic Price Volatility | -0.4% | Global, strongest in Asia-Pacific foundries, reliant on Chinese magnesia supply | Short term (≤ 2 years) to Medium term (2-4 years) |
| Shortage of Metallurgical Talent | -0.3% | Global, especially North America and Europe | Long term (≥ 4 years) |
| Norms on Emissions and Waste Wax | -0.2% | Europe and North America, with a rising burden in China | Medium term (2-4 years) to Long term (≥ 4 years) |
| Source: Mordor Intelligence | |||
Capital-Intensive Automation and Inspection Equipment
The investment casting market faces a clear barrier in the cost of automation and advanced inspection systems. Robotic shell handling, thermal imaging, industrial monitoring systems, and CT-based inspection demand large upfront spending that many mid-sized foundries cannot absorb easily. This matters because the investment casting market is moving toward tighter quality control at the same time that aerospace and medical customers expect more traceability and repeatability. Qualification lag adds to the challenge, since automated process lines can take 12 to 18 months to clear customer approval in aerospace programs, which delays revenue and extends payback periods. Private equity-backed groups and larger platforms can spread this cost over multiple plants, but smaller independents remain at a disadvantage. The result is that the investment casting market may keep consolidating at the high-specification end because capital intensity now affects access to programs as much as technical skill does.
Volatility in Nickel and Refractory Ceramic Prices
Raw material volatility remains one of the most immediate risks for the investment casting market. Nickel pricing affects superalloy castings directly, while refractory inputs such as magnesia influence shell cost, lead time, and process stability. Because the investment casting market depends on both premium alloys and reliable ceramic systems, foundries face margin pressure when price changes hit fixed contracts or move faster than customer pass-through terms. Many suppliers are responding by qualifying alternate refractory sources and signing multi-year volume agreements, but these strategies increase procurement complexity and tie up working capital. This challenge is more acute in high-temperature applications, where material substitution is limited, and quality risk from input changes can be severe. The investment casting market, therefore, remains sensitive not only to metal prices but also to concentration in the refractory supply base.
*Our forecasts treat driver/restraint impacts as directional, not additive. The impact forecasts reflect baseline growth, mix effects, and variable interactions.
Investment Casting Market Segment Analysis
By Process Type:
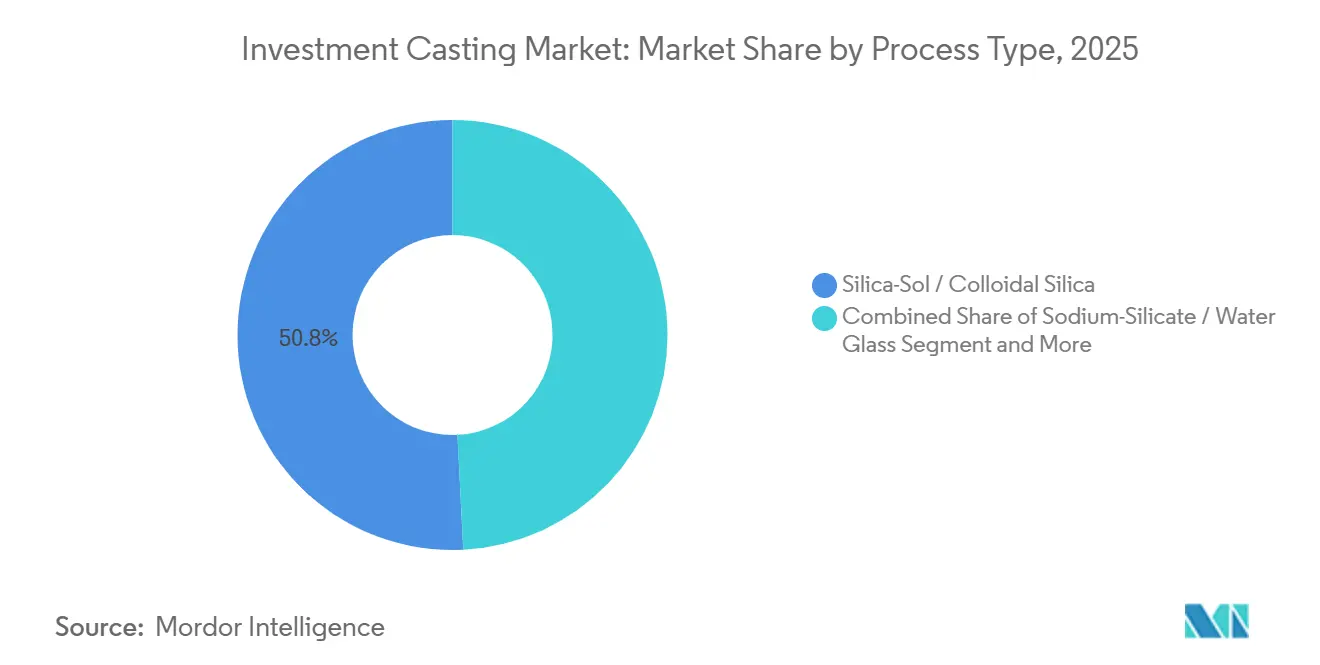
Silica-Sol Dominates While Hybrid Processes Gain GroundSilica-sol held 50.78% of the investment casting market share in 2025, which kept it clearly ahead of other process routes in high-precision applications. This lead reflects its strong fit with aerospace, medical, and energy parts that require surface roughness below Ra 1.6 µm and tight dimensional control. Silica-sol shell systems remain more stable at mold firing temperatures above 1,000°C, and they avoid some of the slurry limitations seen in water-glass systems [3]Besser Casting, “Silica Sol Investment Casting,” Besser Casting, bessercasting.com. The investment casting market continues to favor this route where customers prioritize consistency, better surface finish, and traceable process control over minimum unit cost. Sodium-silicate processes still retain demand in industrial machinery, agricultural equipment, and other price-sensitive programs where finish requirements are less demanding and throughput economics matter more than extreme precision.
The investment casting market is also seeing process improvement in silica-sol chemistry, rather than only a shift between process families. Organically enhanced composite silica-sol variants now extend slurry shelf life beyond 60 days and reduce surface defect rates significantly, which improves both usable output and production scheduling. Hybrid and other processes are forecast to grow at 5.30% CAGR through 2031, which makes them the fastest-growing process category in the investment casting market. Printed Investment Casting Shell methods are central to that shift because they allow direct ceramic mold creation and remove some of the limits tied to wax pattern preparation. This opens room for geometries that were previously difficult to produce at a competitive cost. Over time, the investment casting market is likely to keep silica-sol as the scale leader while hybrid methods expand in development work, difficult geometries, and high-value niche production.


By Material:
Super-Alloys Redefine the Value CeilingStainless steel held 32.98% share in 2025 and remained the broadest material base in the investment casting market because it serves pumps, valves, medical tools, food-processing equipment, and industrial hardware with one established material family. Grades such as 316L and 17-4PH continue to anchor demand where corrosion resistance, moderate heat performance, and machinability must be balanced. Carbon steel and low-alloy steel still hold a practical position in heavy equipment and mining applications where part economics matter more than extreme precision. Aluminum and magnesium alloys are gaining relevance in lighter automotive and thermal management parts, especially where OEMs want lower weight and improved heat transfer. In that sense, the investment casting industry still depends on stainless steel for broad volume, but value creation is moving more quickly into premium alloy systems.
Superalloys are projected to grow at 5.76% CAGR through 2031, which makes them the fastest-growing material class in the investment casting market. Nickel-based superalloys already account for more than 60% of total material weight in modern advanced aircraft engines, which explains why turbine applications remain central to long-term demand. Single-crystal CMSX-4 turbine blade castings can achieve tolerances within ±0.02 mm and surface finish at Ra ≤ 1.2 µm, which confirms how far the investment casting market has moved into applications that competing processes struggle to qualify. Research showed that René 77 investment castings sustained significant load-bearing capacity at high temperatures even after years of creep life, reinforcing the material case for next-generation aero engines. This is why the value ceiling in the investment casting market increasingly depends on alloy capability, not just casting volume.
By End-User:
Aerospace Anchors Demand While Energy RisesAerospace and defense accounted for 36.07% share of the investment casting market size in 2025, which made it the largest end-user segment by value. That position reflects the high price of complex turbine blades, structural nodes, and integrally cast airfoils compared with more standard industrial cast parts. The segment is also shaped by qualification barriers, because Nadcap readiness, AS9100 systems, and OEM audits influence supplier access as much as melt capability does. Industrial machinery remains a stable volume base through pumps, valves, compressors, and construction equipment. Medical and dental applications stay smaller in tonnage, but they support strong margins through cobalt-chromium implants, titanium tools, and the traceability standards that healthcare suppliers must meet.
Automotive remains important in the investment casting market, but the mix is changing as electric platforms reduce demand for some internal combustion components and shift interest toward lighter, more complex parts. Energy and power are forecast to grow at 5.58% CAGR through 2031, which gives it the strongest expansion rate among end-users in the investment casting market. Gas turbine buildout for data-center power and hydrogen co-firing projects is a major reason for that momentum. A multi-year Siemens Energy and Doncasters agreement for complex precision castings shows the commercial scale now forming in industrial gas turbine demand. As turbine inlet temperatures rise, the investment casting market becomes harder to replace because directional solidification and premium superalloys remain central to hot-section performance.
By Pattern Technology:
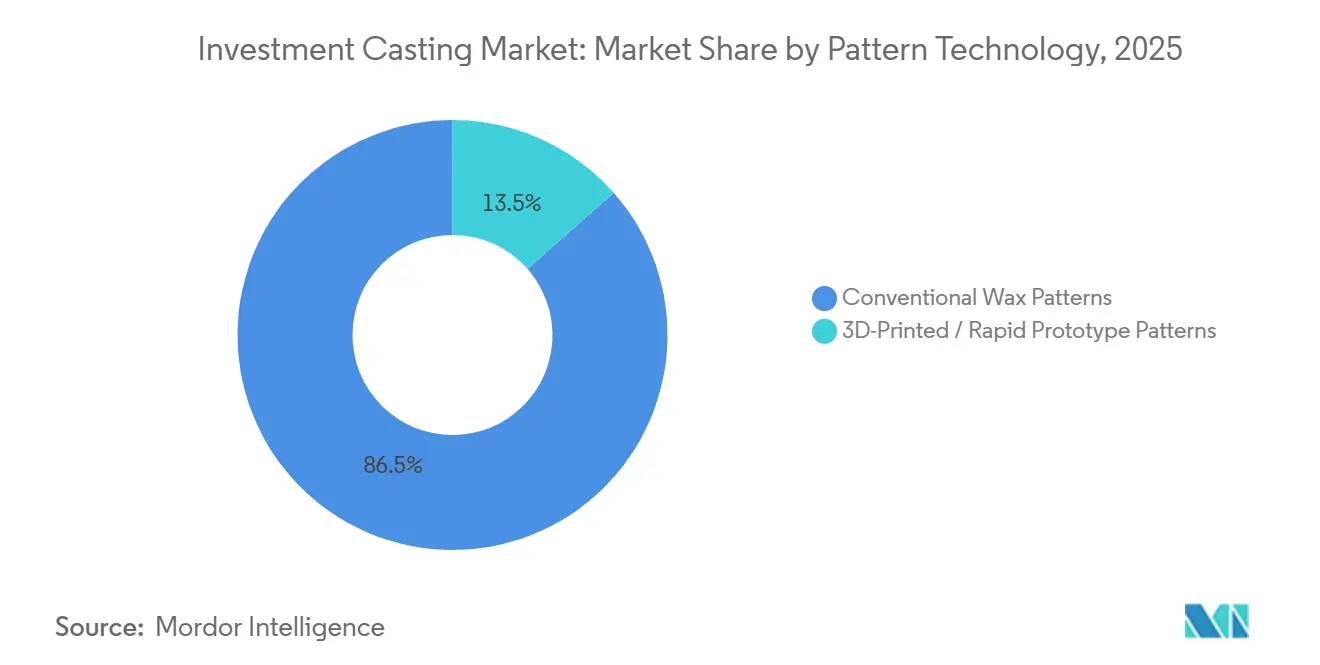
Conventional Wax Retains Scale Advantage as 3D Printing Reshapes EconomicsConventional wax patterns accounted for 86.47% share in 2025 and remained the dominant pattern route in the investment casting market because they still offer the best economics for large production runs. When volumes exceed 1,000 units, injection tooling can be amortized efficiently, and per-part cost remains difficult for additive patterns to match. Conventional wax methods also produce smooth pattern surfaces, and mold finish from injection dies can approach Ra 3.2 to 6.3 µm in established workflows. Improvements in fast-drying silica-sol have also helped this process stay competitive by cutting inter-layer drying time and supporting higher shell-building throughput. This means the investment casting market still depends on conventional wax for repeat programs, stable part families, and customers that need predictable unit economics.
At the same time, the investment casting market size for 3D-printed and rapid prototype patterns is projected to expand at 5.74% CAGR through 2031, which makes it the fastest-growing pattern segment. The main trigger is tooling elimination, since a part that could require USD 35,000 to USD 36,000 in die fabrication and 8 to 10 weeks of lead time can be produced for USD 1,500 in 3 to 5 days through digital pattern workflows. Lestercast installed a next-generation 3D wax printing system in 2025 and reduced ceramic mold manufacturing time by 70% through a new drying chamber, which shows that adoption is moving from trial use into operating practice [4]“Slashing Lead Times with the Best Rapid Prototyping Technology for Investment Casting,” Lestercast, lestercast.co.uk . Surface stepping and burnout behavior still limit some high-volume use cases, but resin chemistry is improving steadily. The investment casting market is therefore likely to keep conventional wax as the scale leader while digital patterns expand in low-volume, urgent, and design-intensive work.
By Component Weight:
Mid-Range Parts Anchor Volume While Small Parts Drive GrowthThe 1-10 kg band held 51.94% share in 2025 and formed the broadest volume center in the investment casting market. This range fits many aircraft engine parts, pump casings, valves, structural automotive parts, and industrial assemblies that are complex enough to justify investment casting but still manageable in standard foundry operations. Parts in this band support a useful balance of geometric complexity, shell handling, and melt practice, which is why they remain the most common fit for general precision casting programs. The above-10 kg category still matters for larger aerospace structures, industrial turbine casings, and oil and gas components that require oversized shells and more specialized melting setups. Even so, production in heavier categories tends to be more selective because handling, yield management, and tooling become more demanding as part size increases.
The up-to-1 kg category is forecast to grow at 5.32% CAGR through 2031, making it the fastest-growing weight band in the investment casting market. Growth is being supported by patient-specific implants, dental hardware, surgical tools, UAV engine parts, sensor housings, and precision brackets for defense electronics. These parts often have lower metal weight but higher value density because traceability, tolerance, and material performance are all tightly specified. The segment also fits well with 3D-printed pattern workflows, since short runs and frequent design changes make hard tooling less attractive. For many foundries, small high-complexity parts are becoming a practical path to higher margin work without the capital intensity of very large structural castings. That keeps this weight class strategically important within the investment casting market even if it remains smaller than the mid-range segment in overall revenue.
Geography Analysis
APAC Investment Casting Market
Asia-Pacific accounted for 43.97% of the investment casting market share in 2025, which kept it as the largest regional base for production and demand. The region benefits from China's large foundry base, India's rising aerospace-grade capability, and the broad manufacturing depth that supports automotive, machinery, and energy demand. China continues to anchor the regional scale because it combines dense supplier networks with strong domestic consumption of cast components in industrial and transport applications. India is gaining attention as a nearshore option for Western OEMs that want supply diversification with international quality systems and full material traceability. Japan and South Korea also support the regional position through advanced process control, vacuum casting capability, and close links to aerospace and high-precision manufacturing programs.
North America Investment Casting Market
North America is projected to grow at 5.36% CAGR through 2031, which makes it the fastest-growing regional segment in the investment casting market. The regional story is less about simple recovery and more about deliberate reinvestment in domestic precision manufacturing, automation, and qualification-ready capacity. American Foundry Society data already showed stronger reshoring activity and broad capital spending plans in early 2026, which supports this view. FAA certification and Nadcap requirements further strengthen premium domestic suppliers because they create barriers that low-cost imports cannot overcome quickly in aerospace applications.
EMEA and South America Investment Casting Market
Europe held a significant position in 2025, supported by its aerospace base, precision engineering strengths, and strict process standards. The region also remains important because customers in aerospace, defense, and industrial gas turbines value supplier traceability, binder compliance, and environmental management systems. Doncasters' USD 52 million expansion at Bochum in November 2025 showed that suppliers still see room for new aerospace and turbine casting capacity in Europe. Producers across the region are also adapting to REACH requirements, ISO 14001 expectations, and broader pressure for closed-loop wax recovery and cleaner shell systems. South America, the Middle East, and Africa remain smaller in scale, but Brazil's aerospace MRO activity, Saudi Arabia's energy investments, and Turkey's defense programs continue to create localized demand pockets for the investment casting market.

Regulatory Landscape
Environmental compliance and customer-mandated quality systems increasingly shape investment casting operations for automotive and aerospace-grade parts. In the United States, the EPA Metal Molding and Casting Effluent Guidelines apply across 28 process segments and push larger foundries (including those melting above 20,000 tons annually) toward filtration, wax-reclamation, and closed-loop water systems. In the United Kingdom, the Climate Change Agreement framework similarly links energy and emissions performance to phased targets and buy-out fees.
Automotive supply chains also face tighter standards and trade-compliance scrutiny. IATF 16949 remains a core quality benchmark for automotive casting suppliers, with 2026 revisions highlighted in industry coverage emphasizing stronger traceability, sub-supplier monitoring, and electronic quality-data control aligned to customer-specific requirements. In China, the China Foundry Association issued the T/CFA 0501-2026 Green Casting evaluation standard (effective March 20, 2026), and the State Administration for Market Regulation published GB/T 26653-2026 for internal combustion engine exhaust manifold castings (effective from September 1, 2026), reinforcing documentation, process control, and product conformance expectations for qualifying suppliers.
Value Chain Analysis
The investment casting value chain starts with alloy inputs (including stainless steel, aluminum and magnesium alloys, and super-alloys) and consumables such as waxes, ceramic flour, binders, and refractory materials used for shell systems (silica-sol, sodium-silicate, and hybrid variants). Upstream dependencies include nickel and specialty refractory ceramics, where price volatility can affect quoting and contract structures. Qualification standards such as AS 9100 and NADCAP for aerospace-grade work also influence supplier selection and audit cadence.
Midstream, foundries execute pattern making (conventional wax tooling and growing use of 3D-printed patterns), shell building, dewax, firing, melt and pour, followed by finishing steps such as cut-off, heat treatment, and inspection (including CT scanning for tight-tolerance components). Downstream, parts move either directly to OEMs or through Tier-1s that bundle machining, assembly, and logistics to meet JIT delivery needs for automotive, and program-driven delivery windows for aerospace and energy. Distribution and customer integration increasingly depend on digital traceability and documentation (PPAP, lot genealogy, and customer-specific requirements matrices), favoring suppliers that combine casting with finishing and compliance reporting.
Competitive Landscape
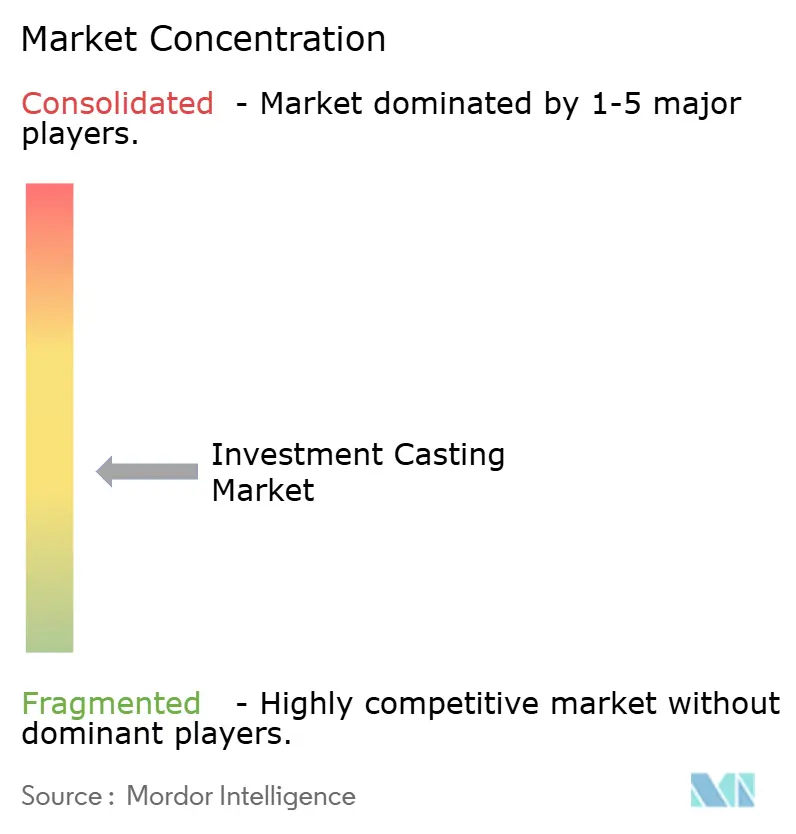
The investment casting market remains moderately concentrated at the aerospace-grade end and far more fragmented in the broader industrial base. Precision Castparts Corp. and Howmet Aerospace continue to set the tone in high-value airfoils and structural aerospace castings because they combine long customer relationships, alloy know-how, and certification depth that new entrants cannot build quickly. Their position is strongest where sole-source qualification, flight-critical approval, and proprietary process experience all matter at the same time. Outside that premium tier, the investment casting market is split across many regional foundries that compete on delivery, process range, alloy availability, and customer proximity. This leaves the overall structure mixed, with high concentration in the most demanding applications and a much looser field in industrial machinery, automotive, and general engineering programs.
Strategic moves in 2025 and 2026 show how suppliers are trying to strengthen capability rather than chase volume alone. In April 2026, Barron Industries acquired the titanium casting assets of TriTech Titanium Parts in Detroit, which expanded Barron's position in vacuum-melt alloys and titanium investment castings. In November 2025, PTC Industries started a significant expansion at its investment casting facility in Mehsana, Gujarat, to align with global supply chain diversification and India's rising role in precision manufacturing. In November 2025, Doncasters announced a USD 52 million investment at Bochum to expand large industrial gas turbine casting capability and support future aerospace-grade work. These moves show that the investment casting market is rewarding capacity additions that deepen technical capability, material range, and customer access in certified segments.
Competition is also shifting at the edge of the market as digital tools change cost and speed expectations. Foundries that combine automation, digital inspection, printed patterns, and better shell chemistry are closing the gap with established leaders in selected niches. The strongest white-space areas remain hydrogen-ready turbine parts, patient-specific medical castings, and defense programs that require regional supply resilience. At the same time, the investment casting market still favors companies that can prove repeatability over many production cycles, because customers in critical applications care as much about qualification history as they do about innovation. That balance between process innovation and qualification discipline is likely to define competitive outcomes over the forecast period.
Investment Casting Industry Leaders
Precision Castparts Corp.
Howmet Aerospace Inc.
Impro Precision Industries
Signicast (Form Technologies)
Proterial, Ltd.
- *Disclaimer: Major Players sorted in no particular order
Investment Casting Market Companies Covered in this Report
- Precision Castparts Corp.
- Howmet Aerospace Inc.
- Impro Precision Industries
- Signicast (Form Technologies)
- MetalTek International
- Milwaukee Precision Casting
- Zollern GmbH & Co. KG
- Georg Fischer Ltd
- CIREX Holding B.V.
- Dongying Giayoung Precision Metal Co. Ltd.
- Taizhou Xinyu Precision Manufacture Co., Ltd.
- Proterial, Ltd.
- Texmo Precision Castings
- RLM Industries Inc.
- Arconic Inc.
- Thompson Investment Casting
- Barron Industries
- Aero Metals Inc.

Market Opportunities and Future Outlook
EV and lightweighting programs are creating whitespace for investment cast components that complement megacasting and high-pressure die casting, especially for complex brackets, suspension nodes, and thermal-management parts where near-net-shape geometries and surface-finish requirements favor investment casting. Industry examples include Tesla scaling integrated casting strategies, while Ford and Volvo committing EUR 855 million to megacasting at the Torslanda plant. In response, investment casting suppliers are positioning around parts that are still difficult to produce via high-pressure die casting.
A second opportunity cluster centers on digitized manufacturing and traceability. Rapid prototyping and tool-less pattern workflows (3D-printed patterns and printed-shell techniques) shorten iteration cycles for low-volume and bridge production, which is relevant for aerospace spares, motorsport, and early-stage EV programs. In parallel, 2026 standard and compliance actions, including tighter IATF 16949 expectations around traceability and sub-supplier control, and China’s T/CFA 0501-2026 Green Casting standard emphasizing carbon footprint tracking and recycled metal usage, are pushing foundries to invest in data systems, recycled feedstock integration, and process controls. This supports differentiation for suppliers that can document both quality and sustainability attributes at part and lot level.
Recent Industry Developments in Investment Casting Market
- May 2026: Alcoa Corporation announced a USD 65 million investment to expand and upgrade the casthouse at its Mosjoen smelter in Norway, including new open-mold foundry casting lines and greater recycled aluminum processing capability. The program targets an additional 75,000 metric tons of capacity with commissioning and ramp-up progressing through 2028, supporting higher availability of foundry alloys with recycled content for casting supply chains.
- May 2026: Impro Precision Industries Limited announced a placing of up to 60,000,000 existing shares and a top-up subscription of new shares, with net proceeds of approximately HKD 539 million. The funding is earmarked for production capacity expansion, development across process categories, and preparations to deepen participation in high-complexity aerospace programs that use precision casting.
- April 2024: Versevo added 3D sand-printing technology for molds and cores to expand rapid-prototyping capability for complex geometries. The move supports faster iteration cycles and can reduce lead times for customers needing low-volume development parts before transferring designs into serial production routes.


Investment Casting Market Report Scope and Research Methodology
Market Definition and Coverage
This market covers revenue generated from investment casting services and products, where wax patterns and ceramic shells are used to produce near-net-shape metal components for industrial and engineered applications.
Scope exclusions: We exclude downstream machining-only work, heat-treatment-only services, and finished-part assembly value that is not directly tied to investment casting output.
Segments Covered in This Report
- By Process Type
- Sodium-Silicate / Water Glass
- Silica-Sol / Colloidal Silica
- Hybrid and Other Processes
- By Material
- Carbon and Alloy Steel
- Stainless Steel
- Aluminum and Magnesium Alloys
- Super-alloys (Ni, Co)
- Others
- By End-User
- Automotive
- Aerospace and Defense
- Industrial Machinery
- Energy and Power
- Medical and Dental
- Others
- By Pattern Technology
- Conventional Wax Patterns
- 3D-Printed / Rapid Prototype Patterns
- By Component Weight
- Up to 1 kg
- 1-10 kg
- Above 10 kg
- By Geography
- North America
- United States
- Canada
- Rest of North America
- South America
- Brazil
- Argentina
- Rest of South America
- Europe
- Germany
- United Kingdom
- France
- Spain
- Russia
- Rest of Europe
- Asia-Pacific
- China
- India
- Japan
- South Korea
- Rest of Asia-Pacific
- Middle East and Africa
- Saudi Arabia
- United Arab Emirates
- Egypt
- Turkey
- South Africa
- Rest of Middle East and Africa
- North America
Data Sources, Market Sizing, and Validation
Desk Research
Desk research builds the basic structure of the model and helps us set realistic ranges before discussing the market. We review public manufacturing and trade signals, such as US Census Bureau manufacturing statistics, USITC and UN Comtrade trade tables, and industrial production series published by sources such as the Federal Reserve.
To ground end-use demand, we also scan aerospace delivery and engine shipment indicators from sources such as FAA publications, EASA materials where relevant, and trade associations, followed by public technical references from organizations such as ASTM for investment casting related standards. Company annual reports, investor presentations, and credible industry press are used to track capacity moves, utilization comments, and mix shifts. We also use paid subscriptions for company financials and patent databases when ownership structures or technology moves are hard to verify from public sources. The desk research sources listed here are illustrative, and many other public and paid sources were used for collection, cross-checking, and clarification.
Primary Interviews and Surveys
Primary interviews and surveys are used to validate what drives pricing and volumes in purchase decisions, and then to correct desk assumptions that do not match shop-floor reality. We speak with foundry executives, sales leaders, manufacturing managers, and procurement teams at end users, plus industry specialists across APAC, EMEA, and the Americas, to test utilization, yield loss, alloy mix, and typical contract terms (including surcharge behavior tied to metals).
Distribution of primary research fieldwork respondents
| Company type | Respondent position | Region |
|---|---|---|
| Top tier: 35% | CXOs: 13% | APAC: 48% |
| Mid tier: 47% | Functional/Unit leaders: 42% | EMEA: 31% |
| Smaller Players: 18% | Managers: 45% | Americas: 21% |
Market-Sizing & Forecasting
The core sizing starts with a top-down build that reconstructs demand from end-use output indicators and casting intensity assumptions, which are then translated into investment casting revenue by applying realistic price and mix factors. To keep it grounded, we corroborate the results with selective bottom-up checks, such as rolling up a sample set of supplier revenues, and then using sampled average selling prices multiplied by estimated production volumes to see if totals sit in a reasonable band.
Key inputs used in the model include aircraft and engine production trends for aerospace demand, automotive and industrial production indexes for general engineering pull, alloy mix split (steel versus high-temperature alloys) because it shifts both yield and pricing, average component weight ranges that influence throughput, and scrap and rework rates that affect effective output. For forecasting, we lean on scenario analysis supported by simple multivariate regression on the strongest macro drivers, and then adjust the path based on what primary respondents signal on capacity additions, debottlenecking, and order book visibility. Where company-level revenue is not disclosed, gaps are handled through peer benchmarking on capacity, product mix, and regional footprint, followed by consistency checks against end-use demand signals.
Data Validation & Update Cycle
Outputs are validated through triangulation across independent signals, including end-use production indicators, trade flows for relevant cast components, and a reasonableness check on implied utilization and pricing. If a region or end-use estimate moves outside expected ranges, the assumptions are reviewed again, and follow-up outreach is triggered to re-check the driver behind the variance.
Before sign-off, the model goes through multi-step analyst review, where calculations, unit consistency, currency conversions, and year alignment are rechecked. Reports are refreshed annually, and interim updates are made when material events occur, such as major capacity announcements, sharp alloy price movements, or visible demand shocks. Right before delivery, a final pass is completed so clients receive the latest updated view.
Mordor Intelligence's Investment Casting Market Sizing Compared With Other Published Estimates
Published market values for investment casting can vary, even when the topic name looks identical, because the scope and counting rules are not always the same. Differences usually come from whether the estimate is for foundry revenue only or also includes downstream value add, which end uses are counted, and how current-year pricing is normalized.
Some published figures describe consolidated sales totals for investment casting in a given year, and in a few cases they mix in adjacent processing and value-added steps. For Mordor Intelligence, the market is counted as investment casting revenue across process types and end uses, and it is kept consistent by aligning the base year to the study window and validating implied volumes and pricing through primary checks.
Benchmark comparison
| Source | Market Size | Gaps in Research Methodology |
|---|---|---|
| Mordor Intelligence | USD 18.45 B (2026) | |
| Trade Journal A | USD 17.20 B (2024) | Reported as consolidated global investment casting sales for a single year, with different treatment of end-use mix and limited visibility on how pricing and currency timing are normalized to a common base. |
| Industry Tracker B | USD 19.10 B (2025) | Often reflects a more aggressive demand path and uses a different base year, which can lift the current value if alloy price pass-through and mix shifts are not cross-checked against utilization and output indicators. |
The table shows that the spread is mostly explained by year alignment and what is counted inside the revenue number, rather than a true disagreement on demand direction. By keeping inputs tied to repeatable demand indicators and then pressure-testing prices and utilization through field feedback, the final value stays transparent and easier to recreate.


Key Questions Answered in the Report
What is the current outlook for the investment casting market?
The investment casting market size is expected to rise from USD 18.45 billion in 2026 to USD 23.82 billion by 2031 at a 5.24% CAGR, supported by aerospace, energy, and precision manufacturing demand.
Which end-user segment leads demand for investment casting?
Aerospace and defense led with 36.07% share in 2025, driven by turbine blades, structural nodes, and flight-critical parts that require strict quality control and certification.
Which process type dominates investment casting production?
Silica-sol led with 50.78% share in 2025 because it supports higher surface quality, better dimensional control, and stronger process stability in demanding applications.
What is driving growth in superalloy castings?
Superalloys are forecast to grow at 5.76% CAGR through 2031 as hotter aircraft engines and gas turbines require materials that can handle extreme thermal stress and long service life.
Why is North America growing faster than other regions?
North America is projected to grow at 5.36% CAGR through 2031 as reshoring, policy support, and fresh capital investment improve local precision manufacturing capacity.
Page last updated on:


 Your data is secure and never sold or shared.


