
Global Intravenous Immunoglobulin Market Size and Share
Market Overview
| Study Period | 2020 - 2031 |
|---|---|
| Market Size (2026) | USD 17.51 Billion |
| Market Size (2031) | USD 24.98 Billion |
| Growth Rate (2026 - 2031) | 7.36 % |
| Fastest Growing Market | Asia Pacific |
| Largest Market | North America |
| Market Concentration | Medium |
Major Players
*Disclaimer: Major Players sorted in no particular order Image © Mordor Intelligence. Reuse requires attribution under CC BY 4.0. |
|
Global Intravenous Immunoglobulin Market Analysis by Mordor Intelligence
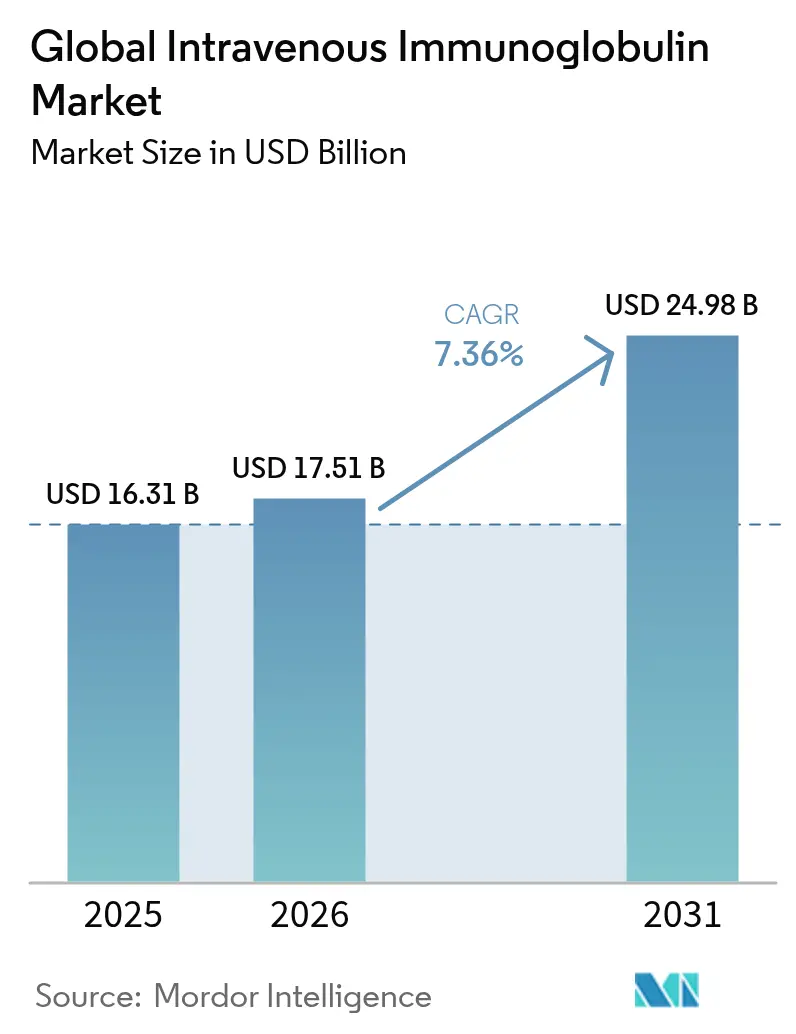
The intravenous immunoglobulin market size is expected to grow from USD 16.31 billion in 2025 to USD 17.51 billion in 2026 and is forecast to reach USD 24.98 billion by 2031 at 7.36% CAGR over 2026-2031. Rising clinical use beyond primary immunodeficiency, demographic ageing, and sustained capacity investments by fractionators all reinforce demand fundamentals. North America leads the intravenous immunoglobulin market because of well-established reimbursement pathways and high per-capita spending, whereas rapid healthcare access gains and policy reform propel Asia-Pacific. IgG retains dominant status, and expanding neurological indications such as chronic inflammatory demyelinating polyneuropathy broaden the intravenous immunoglobulin market opportunity landscape[2]Octapharma USA, “IVIG Specialty Clinic Trends,” octapharmausa.com.
Key Report Takeaways
- By immunoglobulin class, IgG captured 74.12% of the intravenous immunoglobulin market share in 2025; it is also projected to expand at an 8.17% CAGR through 2031.
- By application, hypogammaglobulinemia accounted for 32.05% share of the intravenous immunoglobulin market size in 2025, while myasthenia gravis is advancing at an 7.89% CAGR to 2031.
- By end user, hospitals held 43.88% revenue share in 2025; specialty clinics and neurology centers are forecast to grow fastest at an 8.12% CAGR through 2031.
- By geography, North America led with 41.92% revenue share in 2025, whereas Asia-Pacific is projected to accelerate at an 8.03% CAGR to 2031.
Note: Market size and forecast figures in this report are generated using Mordor Intelligence’s proprietary estimation framework, updated with the latest available data and insights as of 2026.
Market Trends and Insights
Drivers Impact Analysis of Global Intravenous Immunoglobulin Market*
| Driver | % Impact on CAGR Forecast | Geographic Relevance | Impact Timeline |
|---|---|---|---|
| Rise in geriatric population | +1.8% | Global, with highest impact in Asia-Pacific and Europe | Long term (≥ 4 years) |
| Increased adoption of immunoglobulin therapy | +1.5% | Global, led by North America and Europe | Medium term (2-4 years) |
| Rising prevalence of immunodeficiency & bleeding disorders | +1.2% | Global, with emerging market acceleration | Medium term (2-4 years) |
| Advancements in plasma-fractionation technology | +0.9% | North America & EU manufacturing hubs | Short term (≤ 2 years) |
| Off-label neurological use & relaxed reimbursement in Asia | +0.8% | APAC core, spill-over to MEA | Medium term (2-4 years) |
| Regional plasma-collection hubs driving supply security | +0.6% | Global, with focus on US and EU collection centers | Long term (≥ 4 years) |
| Source: Mordor Intelligence | |||
Rise in Geriatric Population
Age-related immune decline increases susceptibility to infections and autoimmune disorders, which sustains long-term demand within the intravenous immunoglobulin market. Asia-Pacific feels the effect most, as rapid population ageing aligns with broader diagnostic reach and insurance coverage. The demographic trend also amplifies secondary immunodeficiencies linked with cancer therapies, further lifting usage. Japan’s medical technology spending trajectory underscores how ageing catalyzes specialty-therapy consumption. Together these factors form a predictable volume pipeline for fractionators over the next decade.
Increased Adoption of Immunoglobulin Therapy
Regulatory approvals such as Takeda’s GAMMAGARD LIQUID for chronic inflammatory demyelinating polyneuropathy have validated broader immunomodulatory utility and accelerated clinician acceptance. Emerging data in autoimmune encephalitis and sepsis reinforce confidence, encouraging off-label prescribing as reimbursement loosens in several high-income markets. The evidence base unlocks new patient pools and extends dosing durations, thereby raising overall consumption inside the intravenous immunoglobulin market.
Rising Prevalence of Immunodeficiency & Bleeding Disorders
Enhanced screening and heightened awareness uncover more primary and secondary immunodeficiency cases. In hematological malignancies, intravenous immunoglobulin therapy cut severe bacterial infection hospitalizations from 2.3 to 0.9 per person-year, illustrating clear clinical benefit. COVID-19 experience further spotlighted immunoglobulin for immunocompromised patients, solidifying its place in treatment algorithms and supporting repeat utilization patterns globally.
Advancements in Plasma-Fractionation Technology
Continuous chromatography, multicolumn systems, and automation shorten production cycles while raising yields, which expands effective supply without proportional increases in plasma collection volumes. Higher purity and better pathogen reduction also support premium positioning. Cost savings re-invested into new centers create a reinforcing loop that increases resilience of the intravenous immunoglobulin market supply chain.
Restraints Impact Analysis of Global Intravenous Immunoglobulin Market*
| Restraint | % Impact on CAGR Forecast | Geographic Relevance | Impact Timeline |
|---|---|---|---|
| Stringent regulatory approval & donor-screening norms | -1.1% | Global, with highest impact in EU and US | Long term (≥ 4 years) |
| High therapy & cold-chain costs | -0.9% | Global, with emerging market sensitivity | Medium term (2-4 years) |
| Shift toward subcutaneous Ig (SCIG) reducing IVIG volumes | -0.7% | North America & EU, spreading globally | Medium term (2-4 years) |
| ESG scrutiny of plasma sourcing raising compliance costs | -0.5% | Global, led by EU regulatory frameworks | Long term (≥ 4 years) |
| Source: Mordor Intelligence | |||
Stringent Regulatory Approval & Donor-Screening Norms
Tight donor eligibility rules and exhaustive validation steps lengthen lead times and add overhead, especially in the European Union and United States, where regulatory scrutiny remains intense. Batch-release requirements and viral safety benchmarks impose capital and documentation burdens that may decelerate new-entrant progress inside the intravenous immunoglobulin market.
High Therapy & Cold-Chain Costs
A single IVIG course can run USD 5,000–10,000, and uninterrupted 2-8 °C logistics add financial weight, which restricts uptake in resource-constrained regions. Insurance prior authorization hurdles further delay initiation, keeping penetration below potential and trimming short-term volume growth projections.
*Our forecasts treat driver/restraint impacts as directional, not additive. The impact forecasts reflect baseline growth, mix effects, and variable interactions.
Global Intravenous Immunoglobulin Market Segment Analysis
By Immunoglobulin Class:
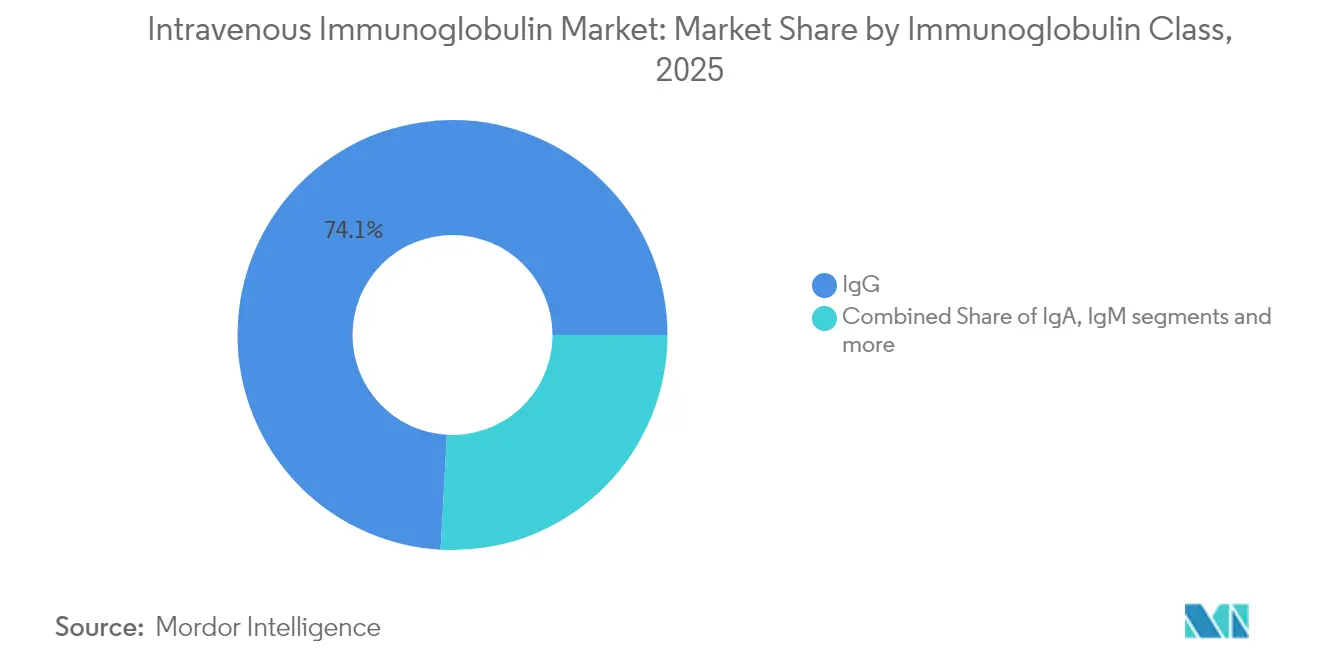
IgG Dominance Drives InnovationIgG commanded 74.12% of the intravenous immunoglobulin market in 2025, and the segment is growing at an 8.17% CAGR to 2031, which underlines how indispensable IgG remains for both replacement and immunomodulation. Grifols’ purification process consistently delivers ≥98% IgG purity, strengthening brand differentiation. High-strength formulations now shorten infusion time, easing hospital scheduling pressures and improving patient comfort.
Manufacturers have prioritized continuous chromatography to boost yield and lower cost, which further bolsters margins across the intravenous immunoglobulin market. Regulatory clearances for new brands such as Yimmugo and ALYGLO increase competitive dynamics yet simultaneously assure broader supply security. IgA and IgM retain niche status focused on mucosal and complement-mediated disorders.


By Application:
Neurological Indications Accelerate GrowthHypogammaglobulinemia retained the largest share at 32.05% of the intravenous immunoglobulin market size in 2025, reflecting entrenched prescribing habits and clear guidelines. Nevertheless, myasthenia gravis is charting an 7.89% CAGR, the quickest among tracked indications, as neurologists adopt IVIG earlier in the disease course.
Chronic inflammatory demyelinating polyneuropathy and multifocal motor neuropathy also post solid gains, benefiting from recent label expansions. Off-label niches such as autoimmune encephalitis imply additional upside for the intravenous immunoglobulin market as clinical evidence accumulates and payers refine reimbursement conditions.
By End User:
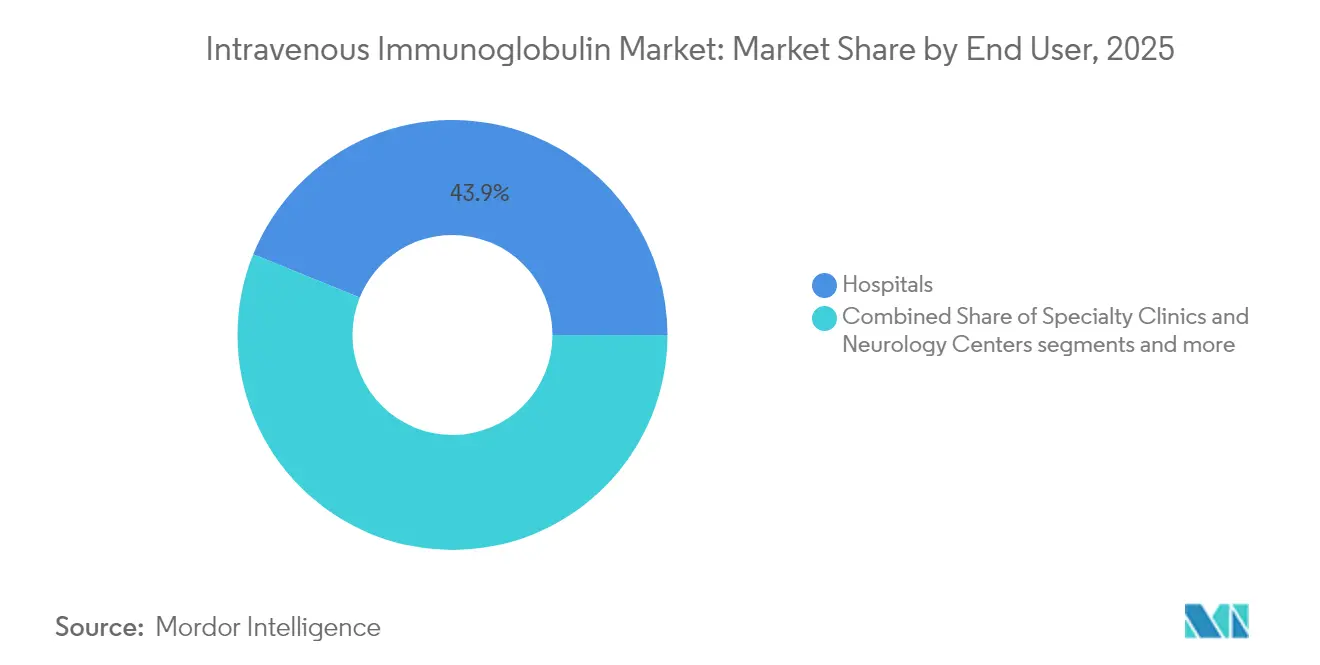
Specialty Care TransformationHospitals delivered 43.88% of revenue in 2025, preserving leadership within the intravenous immunoglobulin market because most first infusions still happen in acute settings. However, specialty clinics and neurology centers are accelerating fastest, posting an 8.12% CAGR as payers and patients value dedicated infusion expertise.
Specialist sites streamline dosing adjustments, manage adverse events, and integrate electronic monitoring, which lifts adherence and outcome metrics. Home-care programs, while smaller, continue to emerge, encouraged by device advances and telehealth support that reduce facility visits and total cost of care.
Geography Analysis
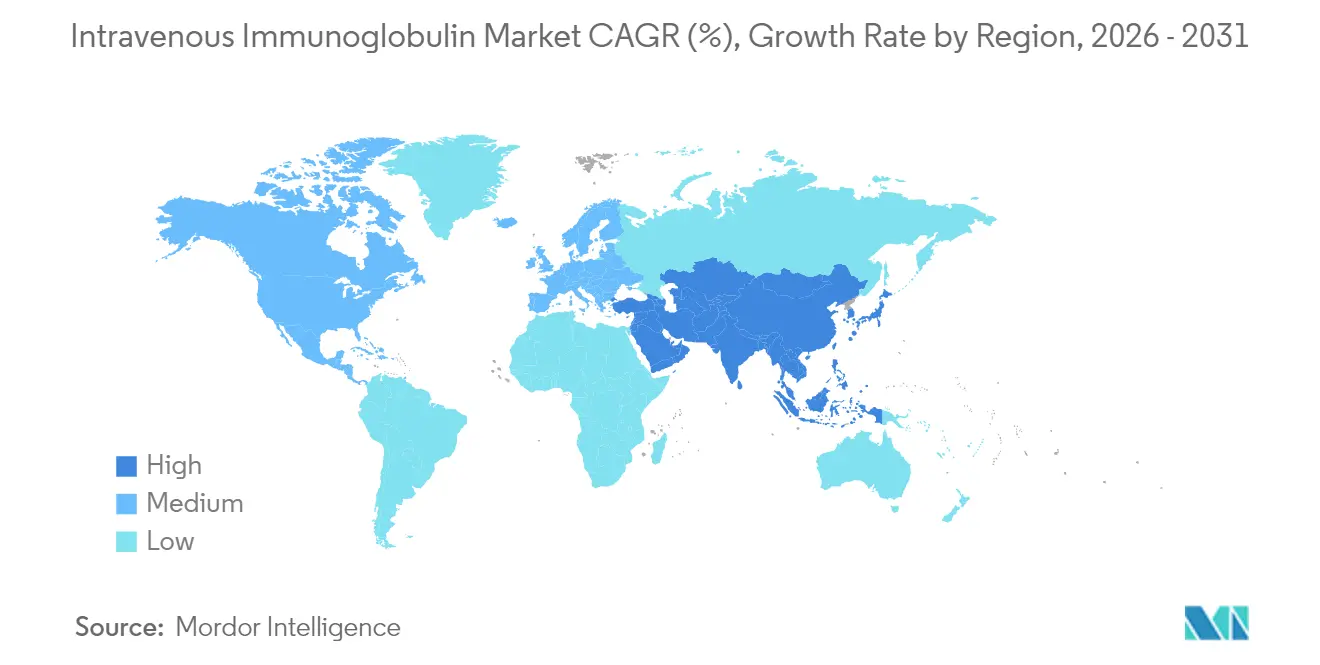
North America Intravenous Immunoglobulin Market
North America kept 41.92% of the intravenous immunoglobulin market in 2025 due to long-standing insurer coverage and extensive plasma collection infrastructure. Medicare policies outline usage criteria that commercial payers largely mirror, facilitating predictable demand and rapid adoption of new formulations. Specialized infusion networks and maturing home-based services advance patient convenience and operational efficiency.
APAC Intravenous Immunoglobulin Market
Asia-Pacific is growing fastest at an 8.03% CAGR through 2031. China’s National Reimbursement Drug List negotiations produced average IVIG price reductions of 63% in 2024, opening therapy to previously unreachable cohorts. Japan’s revised health technology assessments uphold funding for innovative biologics, while India’s production-linked incentives stimulate local fractionation capacity, all of which enlarge the intravenous immunoglobulin market base.
Europe Intravenous Immunoglobulin Market
Europe shows stable progression, yet supply dependence on United States plasma highlights vulnerability. ESG-driven self-sufficiency policies and centralized procurement place pressure on manufacturers to diversify donor pools and enhance transparency. Gradual shifts toward outpatient infusions aim to reduce hospitalization costs and maintain quality benchmarks across the intravenous immunoglobulin market.

Regulatory Landscape
Intravenous immunoglobulin (IVIG) is regulated as a plasma-derived biologic and is subject to donor eligibility requirements, validated viral safety steps, lot release, and post-approval change control. In the United States, the FDA maintains product-specific oversight through Biologics License Applications and ongoing supplements, illustrated by the September 2025 FDA approval enabling US commercialization of Kedrion's QIVIGY and a December 2025 FDA-approved BLA supplement for GC Biopharma that revised lot release specifications for IgA to <= 20 ug/mL.
In Europe, the EMA framework uses a common regulatory baseline for human normal immunoglobulin IV administration, including the EMA Guideline on core SmPC (EMA/CHMP/BPWP/94038/2007 Rev. 6, in effect since January 1, 2022), and ongoing lifecycle updates via marketing authorisation variations. This is reflected by the CHMP positive opinion on April 23, 2026 for a variation to CSL Behring's Privigen, which keeps product maintenance and labeling/specification updates as a recurring compliance workload for established brands. National access governance can also shape utilization, such as in Australia where the National Blood Authority manages government-funded IVIg using the BloodSTAR system to enforce criteria-based prescribing.
Value Chain Analysis
The IVIG value chain starts with source plasma collection (donor recruitment, screening, and apheresis operations), followed by fractionation and purification (Cohn fractionation and/or chromatography), virus inactivation and removal steps, fill-finish, and batch/lot release under regulator oversight. Plasma collection is typically the primary throughput constraint, given the time and infrastructure required to add centers while maintaining donor safety and traceability. Fractionation capacity, validated viral safety, and cold-chain handling (2-8 C) add additional cost and complexity.
Downstream, manufacturers depend on specialized distributors, group purchasing relationships, and temperature-controlled logistics to reach hospitals, specialty clinics, and home-care channels. As an example of distribution-layer scaling, Kedrion's March 2026 activation of a nationwide US distribution network for QIVIGY used specialty distributors (including CuraScript SD, Cencora, Cardinal Health, McKesson Plasma and Biologics, and BioCare) alongside GPO relationships, underscoring how commercial reach and channel readiness can improve product availability once supply and approvals are in place. Voluntary industry standards, including Plasma Protein Therapeutics Association programs such as IQPP and QSEAL, further support quality and consistency expectations across collection and manufacturing nodes.
Competitive Landscape
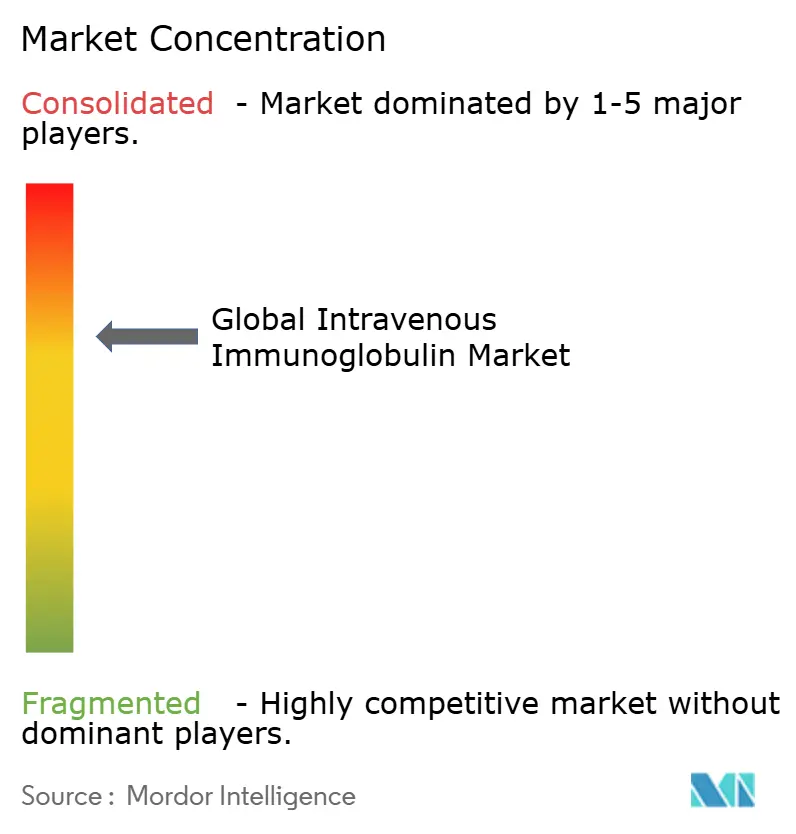
The intravenous immunoglobulin market is moderately concentrated, as Takeda, CSL Behring, and Grifols control integrated collection-to-product chains that protect margins and secure supply. Each invests in continuous processing technology to lift yields and deploy digital twins for predictive maintenance. Strategic moves include CSL’s rollout of a novel nomogram-based plasma collection system that increases volume per donation by about 10% while maintaining safety[3]CSL Limited, “Rika Plasma Donation System,” csl.com.
Joint ventures broaden reach and hedge capacity risk. ICU Medical and Otsuka’s USD 200 million partnership builds one of the largest IV solutions plants in North America, supporting downstream bottling for immunoglobulins. Grifols seeks optionality through recombinant polyclonal platforms after winning BARDA funding, an approach that could Eventually reshape supply economics and lessen plasma reliance.
Emerging regional firms leverage government incentives to establish fractionation hubs close to high-growth patient pools. Nonetheless, high capital commitments, donor access hurdles, and complex regulatory files form substantial entry barriers, sustaining existing leadership within the intravenous immunoglobulin market.
Global Intravenous Immunoglobulin Industry Leaders
-
Biotest AG
-
Kedrion S.p.A
-
Grifols, S.A.
-
Bio Products Laboratory Limited
-
Takeda Pharmaceutical Company Limited
- *Disclaimer: Major Players sorted in no particular order
Global Intravenous Immunoglobulin Market Companies Covered in this Report
- Takeda Pharmaceutical Co.
- CSL Behring
- Grifols
- Octapharma
- Baxter
- Kedrion Biopharma
- Biotest
- Bio Products Laboratory
- LFB Group
- China Biologic Products Holdings
- Shanghai RAAS Blood Products
- Hualan Biological Engineering
- ADMA Biologics
- Emergent Bio Solutions
- Kamada Ltd
- GC Biopharma
- Intas Pharmaceuticals (Lonza Tie-up)
- BioTest Pharma (US)
- South African National Blood Service
- Sanquin Plasma Products
Read Analysis of Global Intravenous Immunoglobulin Companies

Market Opportunities and Future Outlook
Supply security and domestic fractionation expansion are key whitespace themes where demand growth intersects with constrained plasma collection and high regulatory friction. Several large, disclosed investments suggest where capacity and yield improvements are being targeted: CSL Behring announced a USD 1.5 billion expansion of its Kankakee, Illinois plasma therapy manufacturing facility in March 2026 (including its Horizon 2 manufacturing process), and Kedrion announced a EUR 150 million Bolognana X3 program in May 2026 to triple annual plasma fractionation capacity at its Italy hub from 1.1 million to 3.3 million liters. These programs create practical sourcing and contracting opportunities for suppliers of validated chromatography systems, pathogen-reduction and QC analytics, fill-finish capacity, and cold-chain services that can meet biologics-grade compliance requirements.
Market access and route-to-market execution also create opportunity, particularly in the United States where payer and provider networks can accelerate uptake when product supply is reliable. Kedrion's March 2026 rollout of a nationwide US distribution footprint for QIVIGY through established specialty distributors and GPO relationships offers a specific pathway to expand availability beyond major hospital systems into specialty clinics and infusion networks, reflecting the broader market shift toward non-hospital infusion settings. In Asia-Pacific, policy-driven affordability levers are an access catalyst, including China's 2024 National Reimbursement Drug List negotiations that produced average IVIG price reductions of 63%, which creates incentives for manufacturers and local partners to strengthen compliant distribution and pharmacovigilance capabilities in price-sensitive, higher-volume channels.
Recent Industry Developments in Global Intravenous Immunoglobulin Market
- March 2026: Kedrion activated a nationwide US distribution network for QIVIGY 10% IVIG therapy through specialty distributors including CuraScript SD, Cencora, Cardinal Health, McKesson Plasma and Biologics, and BioCare, alongside GPO relationships. The move expanded channel access beyond direct supply pathways and supported scalable fulfillment into hospitals and specialty infusion settings. It also strengthened Kedrion's ability to compete on availability and service levels in a market where supply continuity is a key purchasing criterion.
- September 2025: The US FDA approved Kedrion's Biologics License Application for QIVIGY (immune globulin intravenous, human-kthm) 10% solution for treatment of adults with primary humoral immunodeficiency. The approval enabled US commercialization and added another branded IVIG option in a supply-constrained category with high compliance and manufacturing barriers. It also reinforced the importance of regulatory readiness and validated manufacturing controls for market entry.
- October 2024: Kedrion and Biotest finalized a long-term, seven-year exclusive distribution agreement for Biotest's Yimmugo in the United States. The agreement aligned a newly approved IVIG brand with an established US commercial and distribution infrastructure, accelerating market penetration without requiring Biotest to build a standalone channel. It also signaled increasing use of partnership-led route-to-market models to broaden IVIG availability.


Global Intravenous Immunoglobulin Market Report Scope and Research Methodology
Market Definition and Coverage
This market covers revenue generated from intravenous immunoglobulin (IVIG) therapies, which are human plasma derived IgG products administered by IV infusion for replacement and immunomodulation use across healthcare settings.
Scope exclusions: Excludes subcutaneous immunoglobulin formats, hyperimmune specialty fractions, and non-human or veterinary immunoglobulin products.
Segments Covered in This Report
-
By Immunoglobulin Class
- IgG
- IgA
- IgM
- Others
-
By Application
- Hypogammaglobulinemia
- Chronic Inflammatory Demyelinating Polyneuropathy (CIDP)
- Primary Immunodeficiency Diseases (PID)
- Myasthenia Gravis
- Multifocal Motor Neuropathy
- Other Applications
-
By End User
- Hospitals
- Specialty Clinics & Neurology Centers
- Home-Care Settings
-
Geography
-
North America
- United States
- Canada
- Mexico
-
Europe
- Germany
- United Kingdom
- France
- Italy
- Spain
- Rest of Europe
-
Asia-pacific
- China
- Japan
- India
- Australia
- South Korea
- Rest of Asia-pacific
-
Middle East and Africa
- GCC
- South Africa
- Rest of Middle East and Africa
-
South America
- Brazil
- Argentina
- Rest of South America
-
North America
Data Sources, Market Sizing, and Validation
Desk Research
Desk work starts with building the disease and treatment context for IVIG so we are not modeling in a vacuum. We reference public sources such as the US FDA approvals and labeling updates, CDC and WHO disease burden materials, and OECD health statistics to understand treated pools and care pathways that drive demand.
On the supply and availability side, we look at sources such as national blood and plasma collection agencies, industry association publications on plasma collection, and peer reviewed journal literature on IVIG utilization and shortages. We also review company filings, investor presentations, and reputable press to track capacity expansions, fractionation trends, and demand signals by region. Where helpful, paid subscriptions for company financials and intelligence, patent databases, and shipment level import and export databases were used to cross-check directionally. These examples are not exhaustive, and many other public references were used for data collection, validation, and clarification.
Primary Interviews and Surveys
Primary work was used to pressure test the desk assumptions and to fill the gaps that are common in IVIG, such as shortage driven allocation, indication mix shifts, and regional reimbursement effects. We spoke with a balanced set of stakeholders across plasma fractionation, distribution, hospital pharmacy and infusion settings, and specialist clinicians, and we took feedback across APAC, EMEA, and the Americas so regional practice differences were not averaged away.
Distribution of primary research fieldwork respondents
| Company type | Respondent position | Region |
|---|---|---|
| Top tier: 38% | CXOs: 16% | APAC: 47% |
| Mid tier: 46% | Functional/Unit leaders: 31% | EMEA: 30% |
| Smaller Players: 16% | Managers: 53% | Americas: 23% |
Market-Sizing & Forecasting
Sizing is built using a top-down approach where epidemiology and treated-patient pools by major IVIG-using conditions are converted into demand, which is then reconciled to supply availability and channel pricing. In practice, we model variables such as diagnosed prevalence for key immune and neurology uses, average grams per patient per course, retreatment frequency, infusion setting mix (hospital versus home), and regional access factors like reimbursement coverage and shortage allocation rules.
To keep the totals realistic, the output is corroborated through selective bottom-up approximations, such as rolling up sampled volumes through major channels, using published capacity and utilization signals from plasma collection and fractionation, and applying observed ASP ranges by region and concentration. When gaps exist, they are handled by conservative interpolation from comparable countries and then corrected after expert checks, instead of assuming uniform uptake across regions.
For forecasting, scenario analysis is used and anchored to a few drivers that experts can react to, including plasma collection growth, fractionation capacity additions, indication expansion pace, and expected price progression under constrained supply. The scenario paths are then converted into a single forecast after cross-checking with near-term procurement behavior and guideline driven demand trends.
Data Validation & Update Cycle
Validation is done in layers so the model does not depend on one data stream. Analysts compare the market totals and growth rates against independent signals such as plasma collection trends, fractionation capacity announcements, utilization patterns in key indications, and regional access and reimbursement changes, followed by checks for outliers in price and volume assumptions.
If a major variance shows up, we re-check the input logic and may re-contact select experts to confirm whether the change is real or only a reporting artifact. Before sign-off, a separate analyst review is performed to test calculations and narrative consistency, and the report is refreshed annually with interim updates when material events occur. Right before delivery, a final pass is completed so clients receive the latest updated view.
Mordor Intelligence's Intravenous Immunoglobulin Market Size Measured Against Other Published Estimates
Different publications often show different IVIG market values because they do not always count the same product set, years, or geographic coverage, and they also handle shortages and pricing changes differently. In IVIG, small differences in what is included can move the total a lot because supply constraints and allocation policies can shift volumes between indications and regions.
The biggest gap drivers usually come from whether subcutaneous immunoglobulin and hyperimmune fractions are mixed into the same bucket, whether the estimate is global or limited to a set of major markets, and how price is escalated when products are in short supply. Another common reason is the base year choice and currency conversion timing, since healthcare prices can shift quickly and reported values can be refreshed at different times.
Benchmark comparison
| Source | Market Size | Gaps in Research Methodology |
|---|---|---|
| Mordor Intelligence | USD 17.51 B (2026) | |
| Global Consultancy A | USD 15.88 B (2024) | Uses an earlier base year and may apply a broader IVIG definition without explicitly separating shortage allocation effects and near-term ASP shifts, which can compress the measured value versus later-year snapshots. |
| Industry Research House B | USD 14.40 B (2024) | Tends to emphasize selected indications and a longer-dated horizon, and the sizing year is earlier, which can understate the impact of capacity additions, reimbursement expansion, and pricing changes visible in later years. |
The table shows that timing and scope choices explain most of the spread, especially for a supply constrained therapy where volumes and prices do not move smoothly year to year. By excluding SCIG and hyperimmune categories and tying demand to grams per treated patient before reconciling to supply availability checks, the sizing stays traceable to real clinical use and capacity signals, a pattern followed here by Mordor Intelligence.


Key Questions Answered in the Report
What is the current value of the intravenous immunoglobulin market?
The intravenous immunoglobulin market size is USD 17.51 billion in 2026 and is projected to reach USD 24.98 billion by 2031.
Which immunoglobulin class dominates sales?
IgG accounts for 74.12% of revenue because its pharmacology suits both replacement and immunomodulatory therapy.
Which region is growing fastest for IVIG?
Asia-Pacific posts the quickest growth at an 8.03% CAGR, driven by ageing populations, policy reform, and larger reimbursement pools.
Why are specialty clinics gaining share in IVIG delivery?
Clinics focused on neurology and immunology streamline infusion protocols, improve monitoring, and deliver better patient experience, supporting an 8.12% CAGR.
How does SCIG adoption affect IVIG demand?
Subcutaneous products offer convenience and fewer systemic side effects, which moderates IVIG volume growth, especially in North America and Europe.
What are key restraints for market expansion?
High therapy costs, cold-chain logistics, and stringent donor-screening rules increase operational overhead and can limit patient access in price-sensitive regions.
Page last updated on:


 Your data is secure and never sold or shared.


