
Intraoral Scanners Market Size and Share
Market Overview
| Study Period | 2020 - 2031 |
|---|---|
| Market Size (2026) | USD 0.91 Billion |
| Market Size (2031) | USD 1.55 Billion |
| Growth Rate (2026 - 2031) | 11.10 % |
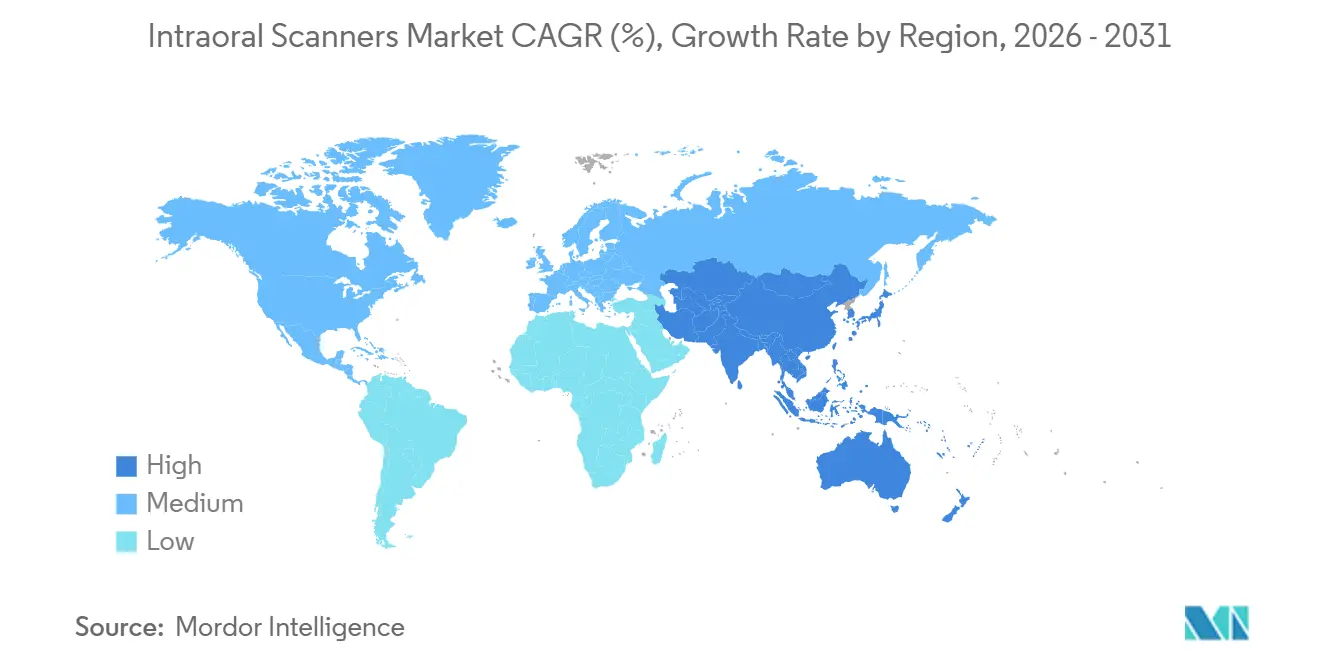
| Fastest Growing Market | Asia-Pacific |
| Largest Market | North America |
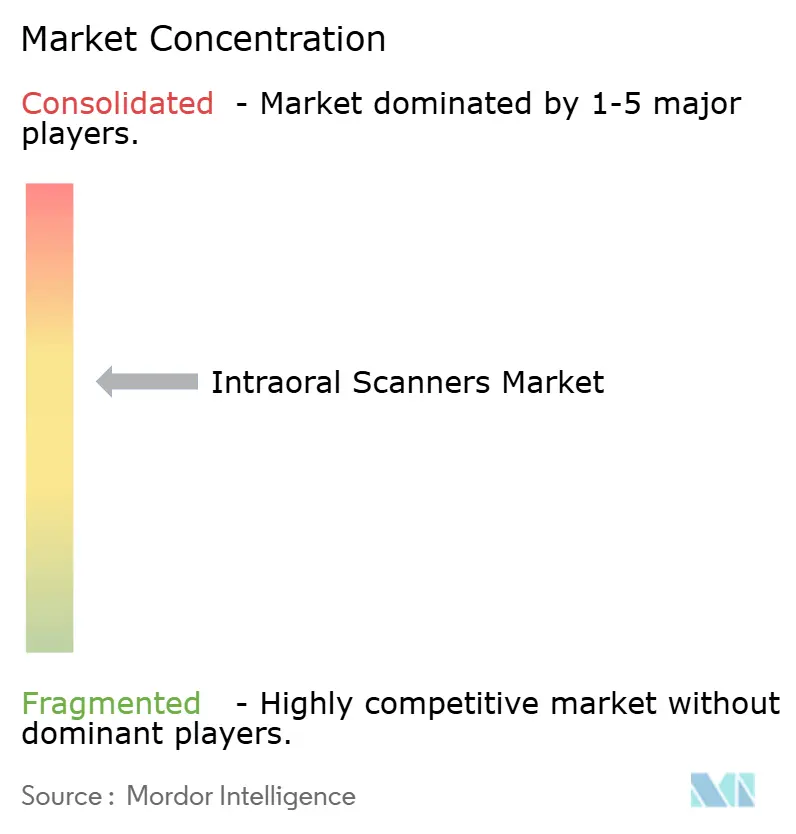
| Market Concentration | Medium |
Major Players *Disclaimer: Major Players sorted in no particular order Image © Mordor Intelligence. Reuse requires attribution under CC BY 4.0. | |
Intraoral Scanners Market Analysis by Mordor Intelligence
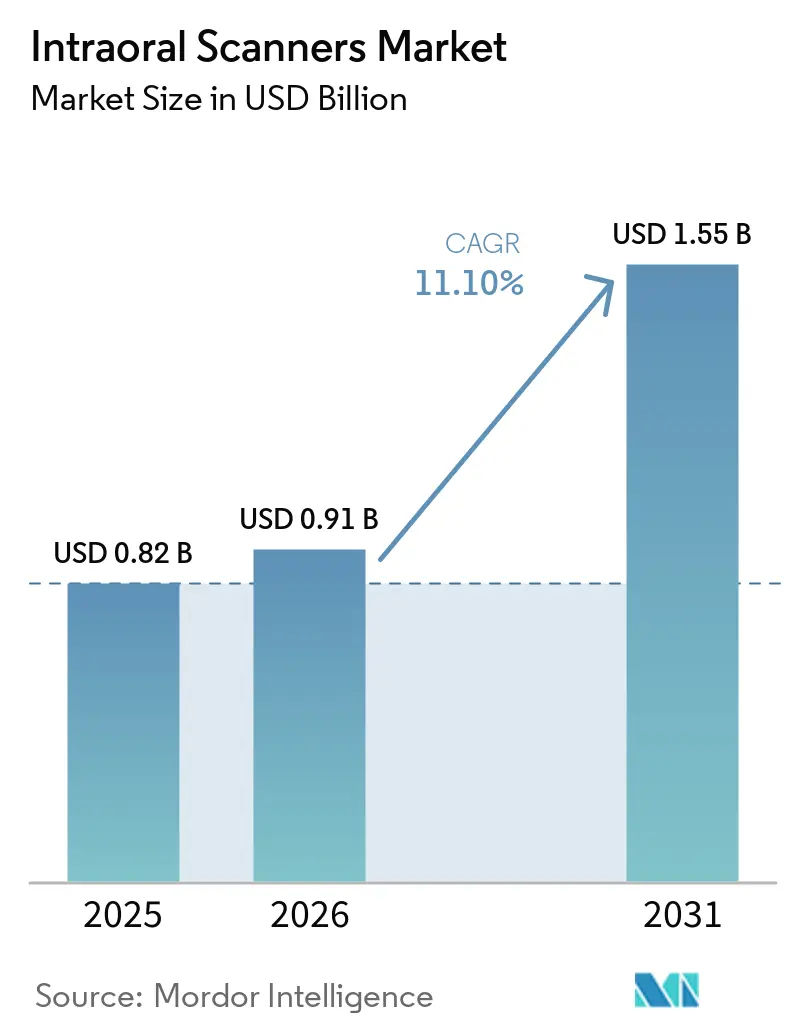
The intraoral scanners market size is projected to be USD 0.82 billion in 2025, USD 0.91 billion in 2026, and reach USD 1.55 billion by 2031, growing at a CAGR of 11.10% from 2026 to 2031. Dental practices are shifting from analog trays to digital impression capture that feeds directly into CAD/CAM milling, clear-aligner workflows, and guided surgery, streamlining treatment and opening new revenue channels. Powder-free optics dominate current demand because they shorten chair time, improve patient comfort, and integrate seamlessly with advanced AI stitching algorithms. Portable wireless units are gaining traction among solo practitioners and mobile clinics, while hospitals and large DSOs continue to favor stand-alone carts that support high scan throughput. Regionally, North America leads in reimbursement clarity and early adoption; however, the Asia-Pacific region offers the steepest growth trajectory, as China and India accelerate investment in digital health infrastructure.
Key Report Takeaways
- By type, powder-free systems captured an 85.00% revenue share of the intraoral scanners market in 2025 and are projected to advance at an 11.00% CAGR through 2031.
- By modality, cart-based scanners held a 60.00% market share of the intraoral scanners market in 2025, while portable handheld units are projected to grow at a 13.00% CAGR through 2031.
- By application, orthodontics led the intraoral scanners market, accounting for 43.00% of the market size in 2025; implantology is forecast to expand at a 14.30% CAGR through 2031.
- By end user, hospitals accounted for a 55.00% share of the intraoral scanners market size in 2025, whereas dental clinics are expected to record the fastest CAGR of 13.80% from 2026 to 2031.
- By geography, North America retained a 42.20% share of the intraoral scanners market in 2025, and the Asia-Pacific region is expected to grow at a 12.80% CAGR from 2065 to 2031.
Note: Market size and forecast figures in this report are generated using Mordor Intelligence’s proprietary estimation framework, updated with the latest available data and insights as of January 2026.
Market Trends and Insights
Drivers Impact Analysis of Intraoral Scanners Market*
| Driver | (~) % Impact on CAGR Forecast | Geographic Relevance | Impact Timeline |
|---|---|---|---|
| Digital dentistry and CAD/CAM workflows | +3.2% | Global, strongest in North America and Western Europe | Medium term (2-4 years) |
| Demand for cosmetic and aesthetic procedures | +2.1% | Urban centers in North America, Europe, Asia-Pacific | Short term (≤ 2 years) |
| Improvements in scan speed, accuracy, AI | +2.8% | Global | Medium term (2-4 years) |
| Expansion of teledentistry | +1.9% | North America, Europe, Australia, emerging Asia-Pacific | Short term (≤ 2 years) |
| Flexible financing and subscription models | +2.4% | Global, most impactful in Asia-Pacific and Latin America | Short term (≤ 2 years) |
| Source: Mordor Intelligence | |||
Adoption of Digital Dentistry and CAD/CAM Workflows
The turnaround time for crown delivery has dropped from weeks to same-day service, enabling high-volume clinics to capture incremental revenue and reduce patient attrition.[1] United States scanner penetration reached 62% of practices in 2024, driven by lab mandates that now require STL submissions and by orthodontic simulation software that operates exclusively on digital impressions. Global laboratories, such as Glidewell, received 78% of the 2025 crown orders as STL files, forcing late adopters to digitize or risk losing key lab relationships. Clear-aligner ecosystems also make scanners a virtual prerequisite, further integrating devices into routine workflows.
Increasing Demand for Cosmetic and Aesthetic Dental Procedures
Urban clinics report a surge in veneer and bonding cases as patients expect rapid visualizations of smile outcomes. Digital mock-ups generated directly from intraoral scans increase elective consultations at higher rates and enable providers to command fee premiums of more than 20%. Social-media-driven image consciousness drives younger demographics to seek minimally invasive restorations, pressuring practices to invest in scanners that deliver chairside previews within a single visit. Growth remains skewed towards high-income metros, while rural demand remains nascent.
Technological Improvements in Scan Speed, Accuracy, and AI Automation
Next-generation hardware reduced full-arch capture times to below 40 seconds, while real-time AI stitching cuts rescans to single-digit percentages with Intraoral Cameras complementing scanners by providing detailed chairside views of teeth and soft tissues. Integrated near-infrared imaging enhances diagnostic capabilities for caries detection, creating new billing codes and accelerating the return on investment. Performance convergence between entry-level and flagship models is narrowing hardware differentiation, making bundled software ecosystems the primary battleground among vendors.
Growth of Teledentistry and Remote Treatment Planning
Government reimbursement extensions for virtual care ensure that remote consultations remain billable when accompanied by encrypted scan uploads. In Australia and parts of the United States, regulators now require calibrated intraoral scans for orthodontic treatment plans submitted remotely, thereby increasing demand for cemented devices in rural outreach programs. Connectivity constraints persist in low-bandwidth regions, but portable scanners are helping mobile units reach underserved populations.
Restraints Impact Analysis of Intraoral Scanners Market*
| Restraint | (~) % Impact on CAGR Forecast | Geographic Relevance | Impact Timeline |
|---|---|---|---|
| High capital expenditure and ownership cost | −2.1% | Global, most acute in emerging markets and small practices | Short term (≤ 2 years) |
| Proprietary file formats and interoperability | −1.4% | Global | Medium term (2-4 years) |
| Cybersecurity and bandwidth limitations | −0.9% | Rural areas worldwide, low-infrastructure markets | Medium term (2-4 years) |
| Limited reimbursement outside mature regions | −1.6% | Asia-Pacific (ex-Japan, Korea), Latin America, Middle East & Africa | Long term (≥ 4 years) |
| Source: Mordor Intelligence | |||
High Initial Capital Expenditure and Total Cost of Ownership
Entry pricing starts at around USD 15,000 and can exceed USD 50,000 when bundled with advanced diagnostics, representing up to 100% of a median U.S. dentist’s net income[2]. Add-on software, disposable tips, and service contracts lift total ownership costs, lengthening payback periods for low-volume clinics. Tariffs and financing rates raise effective prices in lower-income markets, further deterring adoption.
Limited Interoperability and Proprietary File Formats Across Scanner Ecosystems
Despite common STL exports, embedded metadata often degrades outside native platforms, forcing users to adopt multiple subscriptions or accept reduced functionality. File-conversion errors lengthen chair time and erode workflow gains. Open-format alliances exist, but they remain voluntary, and market leaders hesitate to dilute their ecosystem lock-in advantages.
*Our forecasts treat driver/restraint impacts as directional, not additive. The impact forecasts reflect baseline growth, mix effects, and variable interactions.
Intraoral Scanners Market Segment Analysis
By Modality:
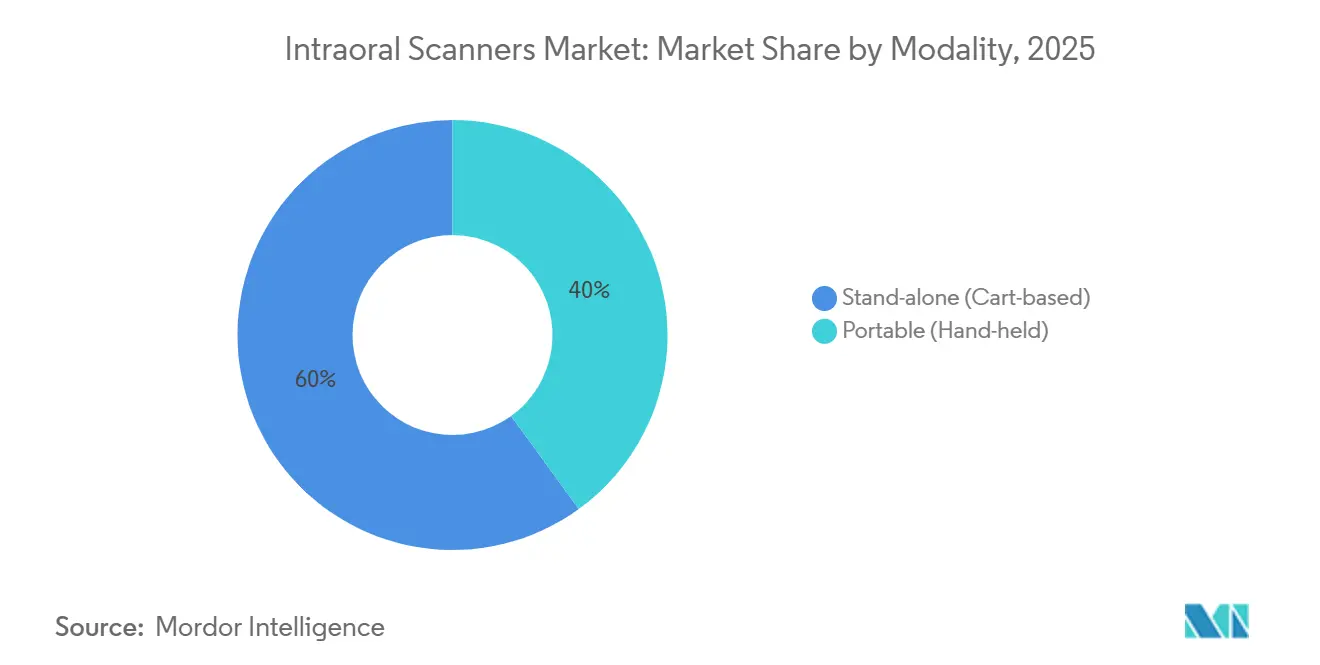
Portability Gains Ground Despite Cart DominanceCart systems controlled 60.00% of the intraoral scanners market in 2025 because centralized stations lower per-chair capital cost in multi-operatory settings. Portable hand-held units are forecast to rise at a 13.00% CAGR as mobile dentistry and tight urban real estate prioritize space savings. The intraoral scanners market size tied to portable models is projected to reach USD 0.73 billion by 2031, driven by wireless operation times exceeding 90 minutes per charge. Yet implantologists still favor carts for superior thermal management and higher scan fidelity, thereby maintaining modality diversity.
Hybrid designs blur the line: detachable handpieces that shift between wired and wireless modes help practices optimize for case complexity without making duplicate purchases. Hospitals and teaching institutions still prefer tethers for network security, indicating a stable dual-modality landscape through the forecast horizon.

By Type:
Powder-Free Dominance Reflects Workflow EfficiencyPowder-free optics accounted for 85.00% of the revenue in 2025 and mirrored overall growth with an 11.00% CAGR. Eliminating titanium dioxide dust reduces scan times, enhances patient comfort, and eliminates the inhalation risk flagged under European chemical regulations. Powder-based devices primarily reside on resold secondary markets and in specialty use cases that require reflective-surface compensation. As AI-controlled exposure improves, even those niches are shrinking. By 2030, analysts expect powder-based share to dip below 5%, effectively consolidating the category into a single dominant technology.
By Connectivity:
Wireless Adoption AcceleratesWired units still comprise 90% of the installed base, yet wireless scanners are growing at a 14.50% CAGR, driven by Wi-Fi 6E and 5G. Construction savings of up to USD 1,200 per operatory attract new clinics, while cable-free ergonomics enhance infection control. Hospital IT policies that block Wi-Fi devices slow uptake in institutional settings, so wired models will remain relevant for the foreseeable future. Vendors now bundle dedicated routers that operate on isolated channels, mitigating interference and security worries for smaller clinics.
By Application:
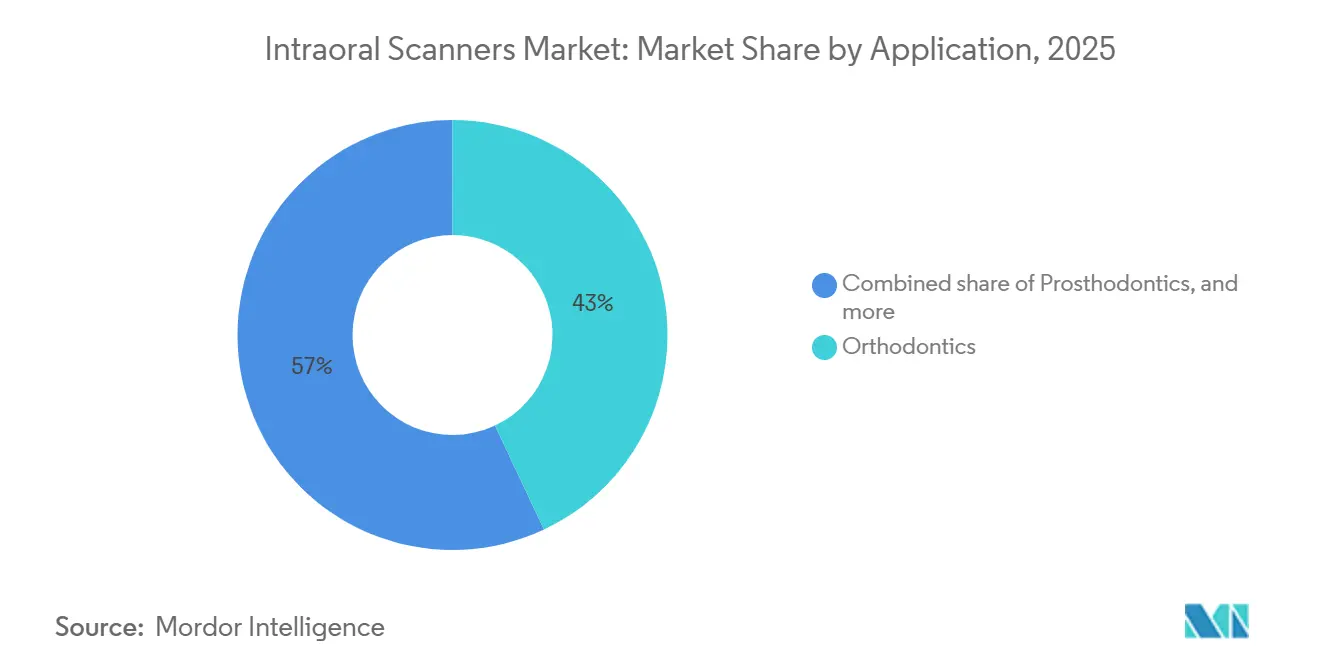
Implantology Outpaces OrthodonticsOrthodontics contributed 43.00% of the intraoral scanners market share in 2025 as clear-aligner workflows rely exclusively on digital impressions. Implantology is projected to grow at a faster rate of 14.30% CAGR to 2031, as merging real-time scan data with CBCT enables flapless placement and surgical guide fabrication, which reduces chair time by up to 40%. Growth is contingent upon complementary CBCT investment; however, high implant volumes in aging populations support strong demand.
By End User:
Dental Clinics Gain ShareHospitals retained 55.00% of the intraoral scanner market share in 2025 due to centralized capital budgets and higher reimbursement rates. Dental clinics, however, are accelerating at a 13.80% CAGR as DSOs standardize scanners across extensive networks, leveraging subscription pricing to reduce upfront cash outlay. The shift will elevate clinics to nearly match hospitals in absolute unit demand by 2031, although hospitals will continue to command premium configurations tied to complex cases.
Geography Analysis
North America Intraoral Scanners Market
North America captured 42.20% of 2025 revenue, propelled by FDA 510(k) regulatory clarity and private insurance codes that reimburse digital impressions. Market penetration surpassed 60%, transitioning regional focus from first-time purchases to replacement cycles and AI-powered software upgrades. Canada trails the United States but is narrowing the gap as provincial insurers pilot digital-impression reimbursement schemes.
APAC Intraoral Scanners Market
The Asia-Pacific region is the fastest-growing, with a 12.80% CAGR. China’s State Council is expanding the dental base and mandating modern diagnostic capabilities, while India’s private chains deploy a scanner network-wide to capture in-house lab fees[3]. Penetration is over 50% in Japan and South Korea, thanks to national health insurance support. Price sensitivity and fragmented regulation continue to limit uptake in Southeast Asia; however, targeted financing and subscription models are helping to close the affordability gap.
Europe Intraoral Scanners Market
Europe holds a roughly 30% share with strong adoption in Germany, the U.K., and Scandinavia. The EU Medical Device Regulation has raised compliance costs, but cross-border dental tourism motivates Central European clinics to invest in scanners and improve signal quality to attract incoming patients. Southern Europe remains slower due to lower spending power, though targeted subsidies in Italy and Spain are starting to encourage digital upgrades.
MEA and South America Intraoral Scanners Market
Middle East & Africa and South America each represent under 8% of sales but feature high-growth urban clusters. Government-backed clinics in the UAE and Saudi Arabia are adopting scanners to align with global best practices. In contrast, the Latin American uptake is centered in Brazil’s private sector, despite tariff-driven price premiums.
Regulatory Landscape
Intraoral scanners are regulated as medical devices in major markets, which shapes requirements around documentation, quality-system controls, and software lifecycle management for manufacturers, with downstream effects for clinic and lab users. In the United States, intraoral scanners are covered under the FDA category of Optical Impression Systems for CAD/CAM dental restorations (21 CFR 872.3661). They are generally treated as Class II and commonly referenced as 510(k)-exempt, which typically supports faster commercialization for established device types, while still requiring compliance with general controls and applicable labeling and safety expectations.
In Europe, intraoral scanners fall under Regulation (EU) 2017/745 (MDR), and classification is commonly assessed under MDR rules for active devices and their intended use. CE marking remains central to EU commercialization. A broader compliance anchor is quality management system alignment to ISO 13485:2016, reinforced in the United States by the FDA transition to the Quality Management System Regulation (QMSR), effective February 2, 2026, which incorporates ISO 13485:2016 by reference and increases the importance of harmonized quality documentation for vendors operating across regions.
Value Chain Analysis
The intraoral scanner value chain starts with specialized components, including CMOS image sensors and semiconductors, precision micro-optics, illumination modules, and mechanical parts designed for handheld ergonomics and infection-control workflows. These inputs feed midstream steps such as optical assembly under controlled conditions, device calibration and metrology, and embedded and cloud software integration, where vendors compete on AI-driven stitching, diagnostic add-ons, and connectivity to CAD/CAM and orthodontic ecosystems.
Downstream, manufacturers sell through direct channels, dental distributors, and partnerships with laboratories and clear-aligner platforms that bundle scanners with case submission and design services. Clinics and DSOs drive procurement decisions through standardization, training, and subscription financing, while labs sustain demand through digital file requirements, including routine STL-based submissions. Ongoing compliance obligations, such as MDR technical documentation and quality-system controls aligned with ISO 13485 and the FDA QMSR (effective February 2, 2026), increase process cost and tend to favor suppliers with mature manufacturing, validation, and post-market support capabilities.
Competitive Landscape
The top three players, 3Shape, Align Technology, and Dentsply Sirona, collectively held approximately 55.00% of the intraoral scanners market share in 2025, indicating moderate market concentration. Each leverages proprietary software to lock in customers: TRIOS 5 bundles Implant Studio, iTero integrates with Invisalign, and Primescan requires DS Core for full functionality. Challenger brands MEDIT and Shining 3D undercut incumbents on price and promote open STL exports, winning share in cost-sensitive segments. Subscription models reduce switching friction, intensifying performance-based rivalry and prompting vendors to expand their training and support offerings.
Patent filings highlight a pivot from hardware innovation to AI-driven software. In 2024, the top three firms filed 47 U.S. patents on machine-learning algorithms for automatic margin detection and artifact correction. White space remains in the pediatric and geriatric niches, where smaller tips and ruggedized housings can open up new demand.
Intraoral Scanners Industry Leaders
-
3Shape A/S
-
Align Technology, Inc.
-
Dentsply Sirona Inc.
-
Planmeca Oy
-
MEDIT Corp.
- *Disclaimer: Major Players sorted in no particular order
Intraoral Scanners Market Companies Covered in this Report
- 3 Shape
- Align Technology
- Condor Technologies NV
- Densys Ltd.
- Dentsply Sirona
- GC Corporation
- Guangdong Launca Medical Device Tech Co., Ltd.
- Straumann Group
- Ivoclar Vivadent
- MEDIT Corp.
- Owandy Radiology
- Planmeca
- Shining 3D Tech Co., Ltd.
- Vatech Co., Ltd.
- Zimmer Biomet
Market Opportunities and Future Outlook
Regulatory streamlining and interoperability-focused integrations are creating room for scanner vendors to broaden adoption beyond early adopter clinics. The FDA QMSR effective February 2, 2026, combined with ongoing reliance on ISO 13485-aligned quality systems, strengthens the position of manufacturers that already run audit-ready processes across regions. That footing supports faster portfolio refreshes and wider distribution. On the workflow side, practice software connectivity is increasingly part of the purchase decision: in February 2026, Henry Schein One connected Align Technology iTero scanners with Dentrix, Dentrix Ascend, and Dentally to support automated data transfer and reduce friction for multi-site clinics building standardized capture-to-treatment pathways.
Product and ecosystem moves in 2026 point to opportunities around scanners as diagnostic and treatment-planning hubs rather than stand-alone capture tools. Align Technology previewed iTero Lumina advancements in April 2026, and Medit created a Global Orthodontic Business Division after acquiring Progressive Orthodontics in May 2026, indicating a push to pair scanning hardware with education and orthodontic workflow tooling. In parallel, faster registration pathways announced in 2026 for digital dental systems in markets including Mexico (COFEPRIS) and Japan (PMDA) provide another commercialization lever for compliant platforms. Demand for open, interoperable data exports, including STL/PLY/OBJ and linkages to CBCT and CAD/CAM, continues to function as a practical adoption driver in orthodontics, implantology, and restorative workflows.
Recent Industry Developments in Intraoral Scanners Market
- February 2026: Henry Schein One integrated Align Technology iTero scanners with Dentrix, Dentrix Ascend, and Dentally practice management platforms to automate data transfer. This linkage reduces operational friction for clinics scaling digital impressions across multiple chairs and locations. It also reinforces scanner-led workflows that carry through scheduling, case submission, and documentation.
- June 2025: Nobel Biocare and 3Shape announced a strategic distribution partnership for TRIOS intraoral scanners. The partnership expands reach through an implant-focused channel where scan quality and restorative planning integration affect case throughput. It also tightens alignment between scanning, implant planning, and downstream restorative workflows.
- June 2024: 3Shape launched the TRIOS Core intraoral scanner alongside a refreshed TRIOS 3 and TRIOS Ready Tips. The release broadened the vendor’s lineup with a more accessible scanner option while maintaining continuity for existing TRIOS users. Expanding tip and device options supports standardization for DSOs and clinics balancing upfront cost with throughput and hygiene needs.
Intraoral Scanners Market Report Scope and Research Methodology
Market Definition and Coverage
This market covers revenues from intraoral scanners used in dental settings to capture digital impressions of teeth and soft tissue and convert them into 3D files for restorative, orthodontic, and implant workflows.
Scope exclusions: Excludes intraoral cameras, radiographic sensors, traditional impression materials, and refurbished or rental scanner units.
Segments Covered in This Report
- By Modality
- Stand-Alone (Cart-Based)
- Portable (Hand-Held)
- By Type
- Powder-Free
- Powder-Based
- By Connectivity
- Wired
- Wireless
- By Application
- Orthodontics
- Prosthodontics
- Implantology
- Other Applications
- By End User
- Dental Clinics
- Hospitals
- Other End Users
- Geography
- North America
- United States
- Canada
- Mexico
- Europe
- Germany
- United Kingdom
- France
- Italy
- Spain
- Rest of Europe
- Asia-Pacific
- China
- Japan
- India
- South Korea
- Australia
- Rest of Asia-Pacific
- Middle-East and Africa
- GCC
- South Africa
- Rest of Middle East and Africa
- South America
- Brazil
- Argentina
- Rest of South America
- North America
Data Sources, Market Sizing, and Validation
Desk Research
Desk research starts with building the demand pool and adoption context for digital impressions inside dentistry. We refer to public sources such as the American Dental Association (practice and procedure indicators), the US FDA (device clearances and technology directions), the World Health Organization (oral health burden signals), and OECD health statistics (health spend and access trends) to shape realistic adoption ceilings and timing.
We then triangulate market-facing signals using sources such as company annual reports and investor presentations, dental association websites, reputable press coverage, and peer-reviewed clinical studies that compare scan accuracy, chair time, and remake rates. Where needed, we also use paid subscriptions for company financials and intelligence, import and export shipment level checks, and patent databases to sanity-check product launches and pricing movement. These are illustrative sources only, and additional public and paid references were used to collect, validate, and clarify data points.
Primary Interviews and Surveys
Primary work was used to stress-test adoption assumptions and pricing, especially where public data is limited. We spoke with a mix of dental clinic decision-makers, lab-side users, distributors, and device industry experts across key regions so the model reflects how scanners are actually purchased, upgraded, and used in daily workflows.
Responses were used to validate the share of new installs versus replacements, typical discounting versus list price, and how connectivity and software bundles affect realized revenue. We then ran targeted follow-ups when inputs did not line up across regions.
Distribution of primary research fieldwork respondents
| Company type | Respondent position | Region |
|---|---|---|
| Top tier: 33% | CXOs: 12% | APAC: 39% |
| Mid tier: 51% | Functional/Unit leaders: 37% | EMEA: 36% |
| Smaller Players: 16% | Managers: 51% | Americas: 25% |
Market-Sizing & Forecasting
Sizing starts with a top-down build where dental procedure volumes and clinic and lab footprints are converted into a scanner demand pool through penetration and replacement cycles, and then translated into value using region-level average selling prices at the manufacturer level. To keep the totals grounded, selective bottom-up checks are run using supplier revenue disclosures where available, channel feedback on unit shipments, and sampled ASP times unit volumes by major use cases.
Inputs that matter in this market include scanner installed base growth, replacement timing driven by accuracy and workflow speed, average selling price movement as wireless and software bundles expand, the share of cases shifting to digital impressions for crowns and aligners, and the lab versus clinic workflow split that changes utilization. When a bottom-up signal is missing for smaller geographies, gaps are handled through proxy adoption curves tied to dentist density and procedure intensity, and then normalized through interview feedback.
For forecasting, scenario analysis is used because adoption can move quickly with financing, training, and clear-aligner case growth, and then slow when clinics delay upgrades. Assumptions for each scenario are anchored to expert inputs on expected penetration, price erosion, and replacement cadence, which are then applied consistently across regions.
Data Validation & Update Cycle
Validation is done through triangulation across independent checks, such as implied unit shipments versus installed base expansion, price bands seen in channel discussions, and whether regional growth lines up with clinic demand indicators. Outliers are flagged, and the underlying assumptions are re-checked, followed by an internal review cycle where another analyst tests the math and the logic before sign-off.
Reports are refreshed annually, and interim updates are made when material events occur, such as major regulatory actions, large product launches, or sharp pricing moves. Before delivery, we do a final pass to confirm the latest public filings and news are reflected so the client receives an updated view.
Mordor Intelligence's Intraoral Scanners Market Size Measured Against Other Published Estimates
Published numbers for intraoral scanners can vary because the market is defined differently and then priced differently, even when the product sounds identical. Differences also come from how fast adoption is assumed to rise in clinics versus labs, and whether revenue is counted at manufacturer selling price or at a downstream, marked-up level.
Intraoral cameras and dental imaging accessories sit outside Mordor Intelligence scope here, which reduces the total versus estimates that bundle adjacent dental imaging hardware into the same revenue line. Gaps also show up when some publications use list prices without typical discounting, apply aggressive replacement cycles, or convert currencies using a single point-in-time rate rather than the average timing of sales recognition.
Benchmark comparison
| Source | Market Size | Gaps in Research Methodology |
|---|---|---|
| Mordor Intelligence | USD 0.82 B (2025) | |
| Industry Research Publisher A | USD 0.69 B (2025) | Uses a narrower counted revenue pool by treating bundled software and service elements as non-device spend, and assumes slower clinic-side penetration outside North America, which pulls down the 2025 total. |
| Industry Research Publisher B | USD 0.79 B (2024) | Reports an earlier base year and appears to apply a more conservative price and replacement curve, which keeps the 2024 value lower and makes the step-up into 2025 look smaller than in models that reflect faster upgrade cycles. |
The spread in published values mainly tracks to what is counted as a scanner sale versus adjacent items, plus how quickly practices are assumed to switch from conventional impressions. By keeping the revenue line tied to scanner hardware at manufacturer pricing and then checking adoption and pricing with primary inputs, the final number stays traceable to clear variables and repeatable steps.
Key Questions Answered in the Report
What was the intraoral scanners market size in 2026?
It reached USD 0.91 billion and is projected to grow to USD 1.55 billion by 2031.
Which application area is expanding fastest?
Implantology leads with a 14.30% CAGR through 2031 due to integration with guided surgery systems.
How quickly are wireless intraoral scanners being adopted?
Wireless units are forecast to rise at a 14.50% CAGR as Wi-Fi 6E and 5G reduce latency and cabling costs.
Which region is growing the fastest for intraoral scanners?
Asia-Pacific is the fastest, advancing at a 12.80% CAGR thanks to China and India's investment in digital dentistry.
Why do dental clinics increasingly invest in intraoral scanners?
Subscription pricing removes large upfront costs and DSOs use bulk procurement to standardize equipment, driving a 13.80% CAGR among clinics.