
Intraoperative Radiation Therapy Market Size and Share
Market Overview
| Study Period | 2020 - 2031 |
|---|---|
| Market Size (2026) | USD 132.93 Million |
| Market Size (2031) | USD 192.79 Million |
| Growth Rate (2026 - 2031) | 7.72 % |
| Fastest Growing Market | Asia-Pacific |
| Largest Market | North America |
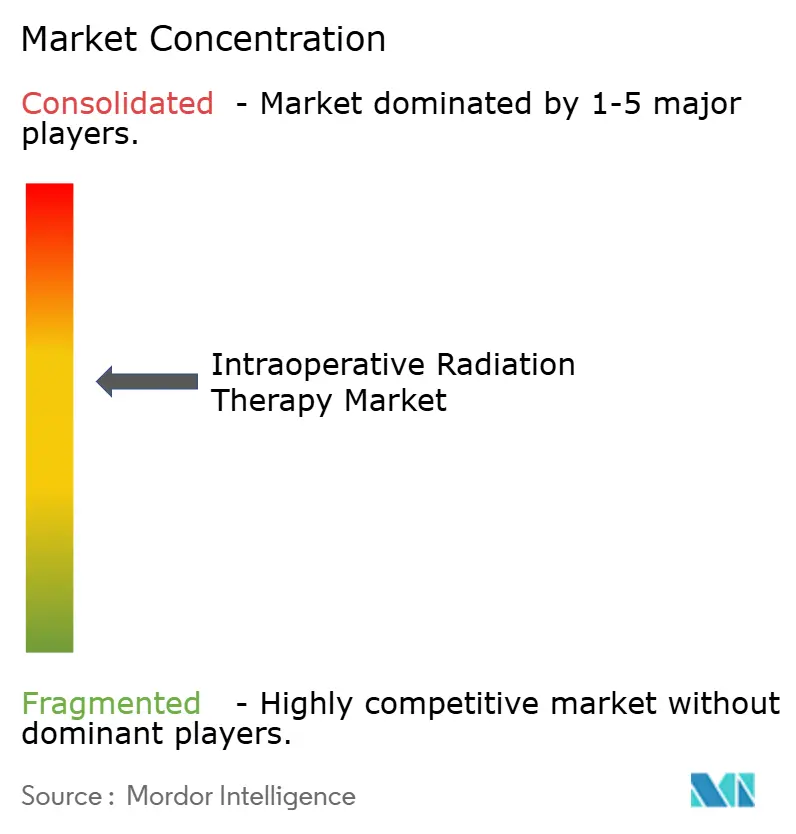
| Market Concentration | Medium |
Major Players
*Disclaimer: Major Players sorted in no particular order Image © Mordor Intelligence. Reuse requires attribution under CC BY 4.0. |
|
Intraoperative Radiation Therapy Market Analysis by Mordor Intelligence
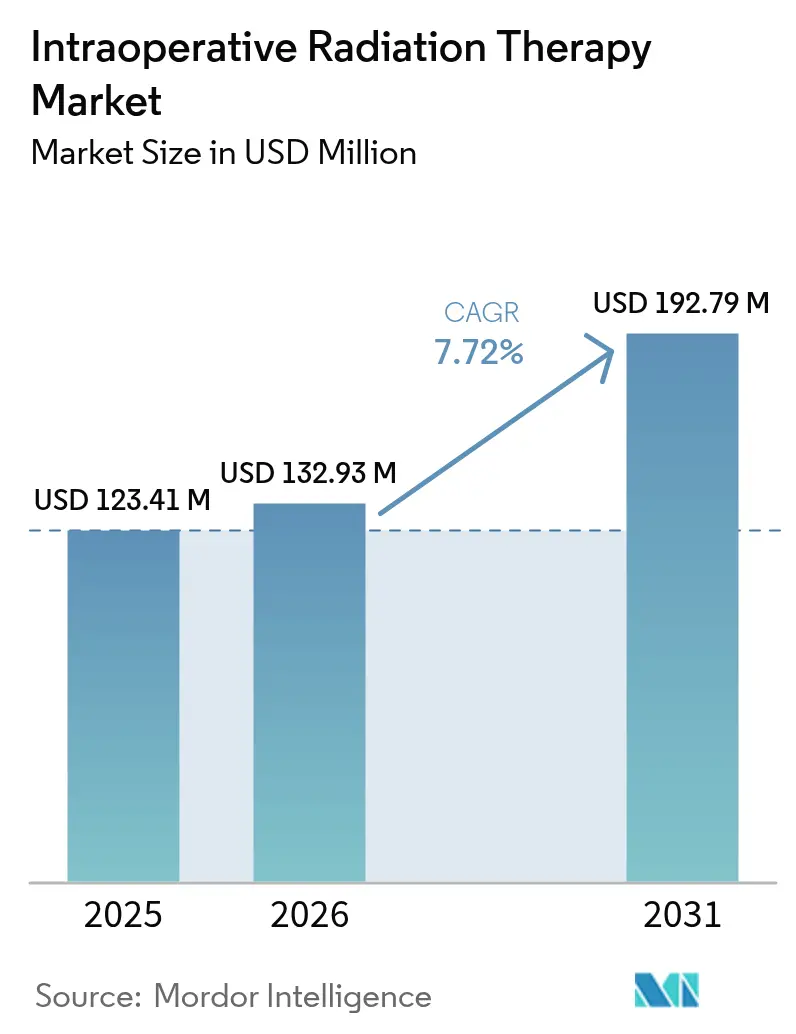
Intraoperative radiation therapy market size in 2026 is estimated at USD 132.93 million, growing from 2025 value of USD 123.41 million with 2031 projections showing USD 192.79 million, growing at 7.72% CAGR over 2026-2031. The growth reflects hospital demand for single-session radiation options that free linear-accelerator capacity, shorten care pathways and align with bundled-payment incentives. Miniaturised mobile electron accelerators now slot into standard operating rooms, eliminating costly bunker retro-fits and expanding addressable sites of service. Early evidence of equivalent local-control rates in breast cancer, combined with improving image-guided accuracy for neurosurgical and gastro-intestinal procedures, sustains clinical confidence. Vendor consolidation around full-stack oncology platforms, coupled with service-oriented revenue models, enhances implementation support and reduces ownership risk for mid-size providers.
Key Report Takeaways
- By method, electron IORT captured 59.45% of the intraoperative radiation therapy market share in 2025.
- By product type, systems and accelerators accounted for 66.60% of the intraoperative radiation therapy market size in 2025.
- By application, breast cancer held a 45.12% share of the intraoperative radiation therapy market size in 2025, while brain tumor treatments are advancing at an 8.37% CAGR through 2031.
- By end user, hospitals maintained 68.75% share of the intraoperative radiation therapy market size in 2025; specialty clinics recorded the highest projected CAGR at 8.49% through 2031.
- By Geography, North America controlled 42.10% of the intraoperative radiation therapy market share in 2025.
Note: Market size and forecast figures in this report are generated using Mordor Intelligence’s proprietary estimation framework, updated with the latest available data and insights as of 2026.
Global Intraoperative Radiation Therapy Market Trends and Insights
Drivers Impact Analysis*
| Driver | (~) % Impact on CAGR Forecast | Geographic Relevance | Impact Timeline |
|---|---|---|---|
| Growing global prevalence of cancer | +2.1% | Global, highest impact in Asia-Pacific and emerging markets | Long term (≥ 4 years) |
| Advancements in cancer-therapy technologies | +1.8% | North America & EU leading, spill-over to Asia-Pacific | Medium term (2-4 years) |
| Advantages of IORT over prolonged external-beam courses | +1.5% | Global, particularly in value-based care markets | Medium term (2-4 years) |
| Outpatient-bundled payment models incentivising single-dose IORT | +1.2% | North America primarily, expanding to EU | Short term (≤ 2 years) |
| Miniaturisation of mobile electron accelerators for low-resource ORs | +0.9% | Asia-Pacific core, spill-over to Middle East & Africa and Latin America | Long term (≥ 4 years) |
| AI-guided intra-op imaging improving margin assessment & uptake | +0.8% | North America & EU, early adoption in developed Asia-Pacific | Medium term (2-4 years) |
| Source: Mordor Intelligence | |||
Growing Global Prevalence of Cancer
Cancer incidence is projected to hit 24 million new cases by 2030, overwhelming capacity at many external-beam facilities [1]Varian Medical Systems, “Global Cancer Statistics and Capacity Planning,” varian.com . Emerging economies such as India illustrate the gap: 521 radiotherapy centers serve more than 1.3 million annual cases, leading to treatment delays. IORT compresses multi-week regimens into a single procedure, freeing slots for complex fractionated cases and improving throughput. Health ministries in high-density nations increasingly view portable electron units as stop-gap infrastructure that multiplies surgical suites’ utility. The trend also aligns with demographic ageing in OECD economies, where comorbidity burdens make prolonged courses impractical.
Advancements in Cancer-Therapy Technologies
Integration of surgical robotics with radiation delivery now enables margin-controlled dosing within minutes; Varian’s HyperSight imaging cuts acquisition time by 50% and enhances lesion visualization [2]Varian Medical Systems, "Varian Receives FDA 510(k) Clearance for TrueBeam and Edge Radiotherapy Systems Featuring HyperSight Imaging Solution," varian.com. FLASH protocols delivering >40 Gy/s show promise for limiting normal-tissue toxicity, with trial treatment times of 4-9 minutes [3]Ka-Ngo Leung, "New Mini Neutron Tubes with Multiple Applications," MDPI, mdpi.com. Artificial-intelligence models achieve 84% accuracy in predicting positive margins during breast-conserving surgery, reducing re-excision risk. Miniaturised accelerators, lighter shielding, and battery operation broaden adoption in low-resource settings. Together, these advances reduce specialized training needs and shrink total procedural duration, attracting multidisciplinary teams.
Advantages of IORT Over Prolonged External-Beam Courses
Randomized data from the TARGIT-A trial confirm equivalent overall survival versus whole-breast irradiation, while slashing patient travel from 25-30 visits to one. Real-world analysis of 814 breast-conserving patients recorded a 5-year local-recurrence rate of 1.6% with minimal Grade 3 toxicity. Single-dose delivery mitigates geographic and socioeconomic barriers, especially for rural and elderly cohorts. Hospitals gain scheduling relief and avoid evening or weekend linac shifts. Insurers recognise downstream savings from reduced transport, work absence and caregiver time, reinforcing coverage decisions.
Outpatient Bundled-Payment Models
Medicare’s Radiation Oncology Model pilots capitated episode payments that reward cost-effective modalities. Because IORT consolidates delivery into surgical DRGs, providers retain surplus margin when clinical outcomes match protracted regimens. Private payers echo this logic, embedding single-dose options in breast cancer pathways. Early adopters report total episode cost reductions of 17% compared with hypofractionated external-beam schedules, accelerating administrative approvals. Financial tailwinds thus complement clinical evidence to drive hospital purchasing committees toward intraoperative platforms.
Restraints Impact Analysis*
| Restraint | (~) % Impact on CAGR Forecast | Geographic Relevance | Impact Timeline |
|---|---|---|---|
| Shortage of trained multidisciplinary IORT teams | -1.4% | Global, most acute in emerging markets and rural areas | Long term (≥ 4 years) |
| Clinical preference for conventional fractionated radiotherapy | -1.1% | Global, particularly strong in established radiation-oncology centers | Medium term (2-4 years) |
| Limited long-term outcome data beyond breast indications | -0.8% | Global, higher impact in evidence-based healthcare systems | Medium term (2-4 years) |
| High shielding / OR retrofit capex for mobile CT-compatible units | -0.6% | Asia-Pacific and emerging markets primarily; some impact in rural North America | Short term (≤ 2 years) |
| Source: Mordor Intelligence | |||
Shortage of Trained Multidisciplinary IORT Teams
Radiation therapist vacancy rates reached 10.7% in 2022, and medical dosimetrist deficits are projected to persist through 2035. IORT demands real-time collaboration among surgeons, physicists, and therapists, a combination scarce outside tertiary centers. Accreditation bodies eliminated on-the-job pathways in 2017, forcing candidates into scarce baccalaureate programs that seldom offer hands-on intraoperative exposure. Smaller hospitals struggle to justify dedicated teams amid low case volumes, creating regional access gaps. Workforce bottlenecks, therefore, temper expansion despite equipment availability.
Clinical Preference for Conventional Fractionated Radiotherapy
Guidelines from the American Society for Radiation Oncology conditionally recommend against routine electron IORT for partial breast irradiation outside clinical trials, reflecting ongoing caution. Training curricula emphasise dose-fractionation theory, making new oncologists comfortable with 15- or 25-fraction schedules. Long-term comparative data remain sparse for head-and-neck or pelvic malignancies, reinforcing conservative practice in high-volume centers. Academic cultures further entrench fractionated norms because funding structures favour multi-visit protocols that generate imaging and planning revenue. Until broad evidence matures, institutional inertia limits modality switching.
*Our forecasts treat driver/restraint impacts as directional, not additive. The impact forecasts reflect baseline growth, mix effects, and variable interactions.
Segment Analysis
By Method: Electron Leadership Amid Brachytherapy Acceleration
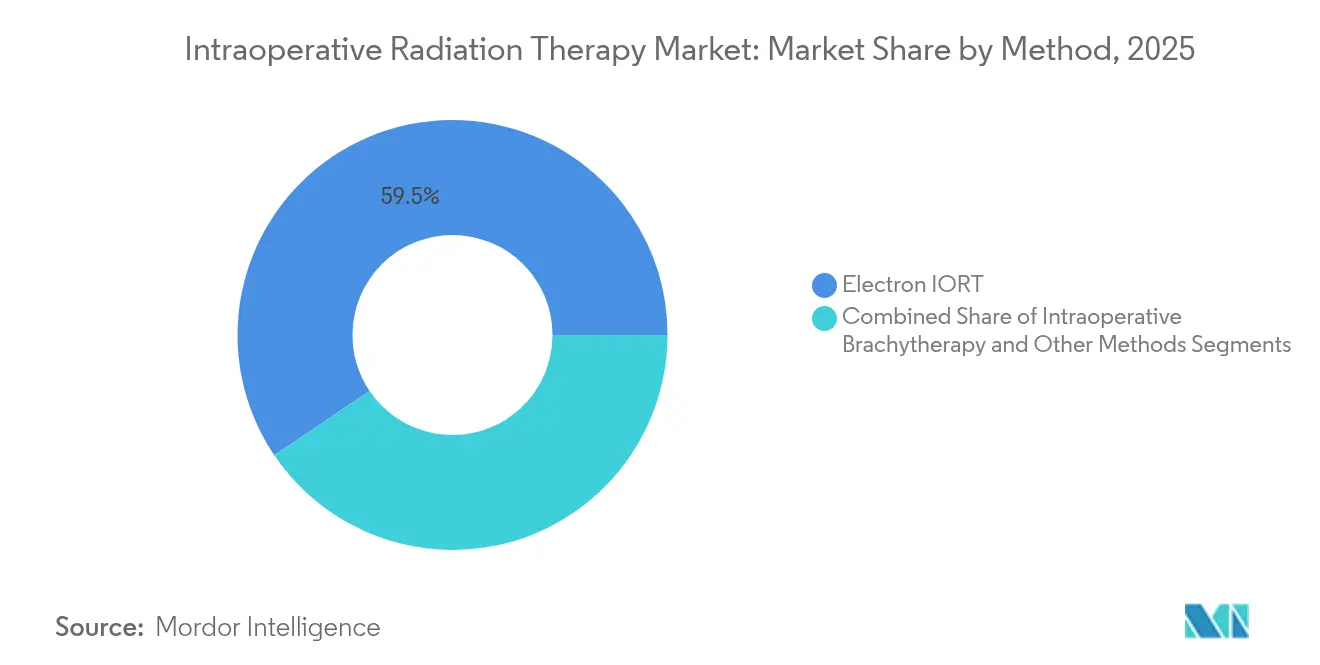
Electron approaches retained 59.45% share of the intraoperative radiation therapy market in 2025 on the back of decades-long breast-cancer validation and streamlined mobile-accelerator workflows. The modality sustains a reliable supply chain for applicators and quality-assurance tools that hospitals already stock. Intraoperative brachytherapy, however, is expected to post an 8.21% CAGR through 2031 as high-definition afterloaders and real-time dosimetry software improve conformity in irregular cavities. Photon-based and alpha-particle seed systems represent a nascent 3% niche, with FDA investigational exemptions driving early uptake in recurrent glioblastoma. Clinical teams now match method to tumor geography, fuelling diversified purchasing patterns.
Electron advocates point to deeper penetration abilities that suit larger breast or pelvic fields, whereas brachytherapy proponents highlight dosimetric sparing near cranial nerves. Alpha DaRT’s radium-224 seeds showed favorable safety in pilot cohorts, adding competitive pressure. Vendors co-marketing hybrid suites—where electron and brachytherapy carts share imaging infrastructure—further blur categorical lines. As surgical oncology subspecialises, decision criteria center on procedure time, shielding costs and credentialing familiarity rather than intrinsic physical dosimetry.


By Products and Services: Equipment Revenues Dominate as Service Lines Surge
Capital sales delivered 66.60% of 2025 revenue, underpinned by repeat replacement cycles for accelerators and real-time imaging consoles. Hospitals in mature markets refresh fleets every 7-8 years to comply with evolving AI-integrated planning software, sustaining double-digit unit price growth. Yet service lines are on an 8.29% CAGR trajectory, reflecting provider appetite for turnkey packages that bundle physics support, remote QA and staff certification. The intraoperative radiation therapy industry has shifted toward outcome-based service contracts, where vendors assume uptime guarantees and share clinical-quality metrics.
System-level integration platforms like Varian ARIA CORE overlay data from pathology, imaging and dosimetry, reducing siloed workflows. Subscription models for software-as-a-service and predictive maintenance analytics now contribute 22% of recurring sales, smoothing vendor revenue volatility. Accessory categories—sterile carts, shielded drapes, docking stations—offer high-margin consumables that lock customers into proprietary ecosystems. While unit installations drive visibility, service competence increasingly determines tender awards, especially in resource-constrained regions where staffing depth is limited.
By Application: Breast Dominance Faces Brain Tumor Momentum
Breast indications generated 45.12% of intraoperative radiation therapy market revenue in 2025 thanks to landmark trials that validated single-fraction efficacy and safety. Patient advocacy groups and surgeons alike promote one-stop lumpectomy plus irradiation pathways that cut travel and caregiver burden. Brain tumor procedures, however, are forecast to expand at 8.37% CAGR on the strength of frameless stereotactic guidance and intra-op MRI fusion that make precise dosing feasible near eloquent cortex areas. The intraoperative radiation therapy industry thus sees neurosurgeons becoming influential technology champions.
Pancreatic and colorectal margins also benefit from high-dose loops, with gastro-intestinal cases now comprising 9% of caseloads. Head-and-neck adoption lags owing to proximity to salivary glands and cranial nerves, yet early series show improved locoregional control compared with re-irradiation. Investigators exploring gynecologic recurrences use electron boosts to sterilise deep pelvic beds, though reimbursement uncertainty tempers growth. Application diversification is expected to stabilise revenue cycles by balancing mature breast volumes with high-margin complex cranial cases.

By End User: Hospitals Retain Scale While Specialty Clinics Gain Speed
Hospitals controlled 68.75% of 2025 installations because integrated surgical, anesthesia and imaging resources streamline multidisciplinary scheduling. Large academic centers also attract grant funding to evaluate novel fractionation schemas, reinforcing their equipment pipelines. Specialty clinics, however, lead growth at 8.49% CAGR as physician-owned groups exploit nimble governance to adopt new devices ahead of hospital capital committees. Mid-sized oncology networks now partner with manufacturers for revenue-share models that lower upfront cash outlays, widening access.
The intraoperative radiation therapy market increasingly rewards facilities capable of turning over operating rooms efficiently; specialty sites report average procedure times of 35 minutes versus 50 minutes in general hospitals. Ambulatory surgery centers embed IORT carts in hybrid ORs used for cardiac cath and neuro-angiography, maximising asset utilisation. Academic hospitals counter by branding centers of excellence that bundle advanced modalities such as proton and FLASH, preserving referral volumes. Over the forecast horizon, competitive advantage will hinge on staff cross-training, digital integration with EMRs and patient-experience metrics rather than sheer bed count.
Geography Analysis
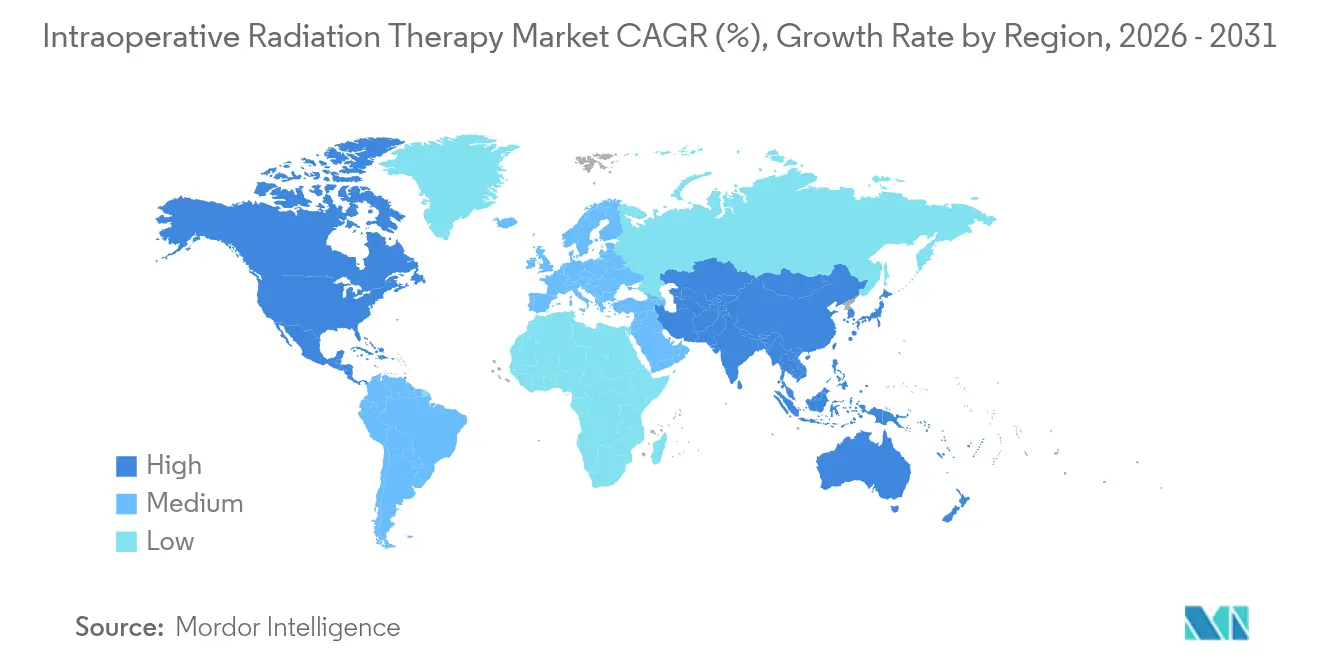
North America preserved 42.10% intraoperative radiation therapy market share in 2025 as clear HCPCS codes and bundled-payment pilots de-risk capital investment. U.S. integrated delivery networks leverage economies of scale to negotiate multiyear service contracts, while Canadian provinces include IORT in provincial cancer agency roadmaps. Provider networks in suburban settings report utilisation rates exceeding 85% because mobile units rotate among campuses overnight, extending return on assets. Eleven states now reimburse single-dose breast boosts at parity with hypofractionated external-beam regimens, accelerating penetration.
Europe maintains steady adoption on the back of cross-border device certification, though heterogenous DRG payments create variability. German and Italian breast-surgeon societies publish consensus guidelines that frame IORT as standard of care for selected patients, underpinning reimbursement. UK National Health Service pilot studies document net savings of GBP 2,300 (USD 2,930) per case after currency conversion at 2024 average rates, largely from reduced transport services. Scandinavian countries show high per-capita utilisation due to dispersed populations and winter travel challenges. However, smaller Central-Eastern markets face capital budget caps that delay fleet renewal.
Asia-Pacific is projected to log an 8.71% CAGR to 2031, powered by China’s national isotope roadmap and Japan’s ageing demography. Government-subsidised procurement schemes fund province-level radiotherapy hubs where intraoperative suites serve satellite hospitals via weekly block scheduling. Taiwan hosts eight proton centers, creating regional expertise that cross-pollinates intraoperative adoption. India’s Tata Memorial chain operates mobile electron units in rural outreach programs, cutting average patient travel distance by 53% compared with city-based linacs. Despite strong momentum, workforce shortages persist: the Philippines counts only 113 radiation oncologists for 110 million citizens, underscoring training imperatives.
South America and the Middle East & Africa remain emerging opportunities. Chile’s public-private partnerships finance hybrid ORs, while Saudi Arabia earmarks oncology modernization funds in Vision 2030. Currency volatility and import tariffs hamper smaller economies, yet used-equipment markets and vendor-financed leases lower entry barriers. Clinical societies across the Gulf states translate European guidelines to local practice, smoothing regulatory pathways. Over the forecast, unmet need combined with demographic shifts positions both regions as long-term volume engines if workforce pipelines materialize.

Regulatory Landscape
Intraoperative radiation therapy (IORT) platforms are regulated primarily as medical devices. In the United States, market access is commonly routed through FDA oversight for radiotherapeutic devices and cleared via the 510(k) pathway when substantial equivalence to predicate systems is demonstrated. For products that combine device and drug elements, the FDA Office of Combination Products assigns a lead center (CDRH, CDER, or CBER) based on primary mode of action, shaping evidence requirements and review coordination.
In Europe, IORT-related device and device-drug configurations are governed under Regulation (EU) 2017/745 (MDR), and integral drug-device combinations may require a Notified Body Opinion under MDR Article 117 when an ancillary medicinal substance is incorporated. Reimbursement policy continues to influence clinical adoption and procurement. In the United States, CMS coverage pathways, including Local Coverage Determinations (for example, LCD L37779 for IORT in defined indications), affect utilization rules and documentation expectations at the payer level, which in turn impacts provider ROI and vendor contracting structures.
Value Chain Analysis
The IORT value chain covers specialized hardware development (mobile electron accelerators or low-energy X-ray systems, applicators/afterloaders, shielding and positioning accessories) and a software layer that supports treatment planning, dose calculation, and workflow integration into hospital IT. Manufacturing and design controls are shaped by quality-system requirements (for example, FDA 21 CFR 820 and ISO 13485), while suppliers for high-voltage power electronics, radiation sources, detectors, and sterile disposables influence lead times and cost of goods, especially for mobile systems intended for standard operating rooms.
Downstream, distribution and implementation are service-intensive. Vendors and channel partners provide site planning, acceptance testing, commissioning, and preventive maintenance, then support recurring needs such as QA, applicator replenishment, and software updates. Provider-side execution depends on a coordinated care team (surgeon, radiation oncologist, medical physicist, therapist, and perioperative staff) plus local radiation safety governance aligned with jurisdiction-specific and facility rules for accelerators and radioactive sources, including requirements administered by the Atomic Energy Regulatory Board for certain installations. As a result, the commercial model increasingly links equipment sales to long-term service contracts, training, and connectivity-enabled remote support to reduce downtime and standardize protocols across multi-site health systems.
Competitive Landscape
The intraoperative radiation therapy market shows moderate concentration as top five vendors account for an estimated 68% revenue. Siemens Healthineers’ USD 16.4 billion Varian buyout yielded a vertically integrated portfolio spanning imaging, planning and delivery, with projected EUR 300 million annual synergies in fiscal 2025. Elekta focuses on open-architecture accelerators and service partnerships, claiming to have extended advanced radiotherapy to 260 million additional patients since 2021. ZEISS markets a cone-beam CT-guided INTRABEAM platform appealing to neurosurgeons for cranial seeds, while IntraOp Medical promotes battery-powered Mobetron units favored in ambulatory centers.
Strategic moves emphasize AI software: RadNet’s USD 103 million acquisition of iCAD adds the ProFound AI suite to streamline diagnostic-to-therapy workflows. Philips partners with MD Anderson to integrate smart-imaging dashboards into operative suites, aiming to cut setup time by 25%. Vendors also seek service differentiation—Varian’s Adaptive Intelligence portfolio bundles physics consulting and remote QA, winning long-term tenders in the U.S. Midwest. Start-ups target gaps: Leo Cancer Care’s upright patient-positioning system received 510(k)-pending status, promising 30% smaller vaults that suit community hospitals.
Regulatory compliance and post-market surveillance costs pressure niche manufacturers. ISO 13485 updates on software lifecycle management push smaller firms toward partnerships or exit. Meanwhile, component shortages in the power-electronics supply chain lengthen lead times, favoring diversified conglomerates. Competitive advantage will increasingly hinge on ecosystem breadth, cloud connectivity and the ability to guarantee therapist training amid staffing shortages.
Intraoperative Radiation Therapy Industry Leaders
-
Eckert & Ziegler
-
Carl Zeiss Meditec AG
-
Sensus Healthcare Inc.
-
Ariane Medical Systems Ltd
-
Sordina IORT Technologies
- *Disclaimer: Major Players sorted in no particular order

Market Opportunities and Future Outlook
Clinical expansion beyond mature breast-cancer use cases is a visible whitespace supported by active trials and new published outcomes. Examples include ongoing studies in pancreatic and colorectal pathways, such as the PACER study for pancreatic cancer and feasibility work in locally advanced or recurrent rectal cancer, as well as prospective evidence in neurosurgical settings. In a May 2026 phase II publication, low-energy X-ray IORT after resection of brain metastases reported 94.3% local control, reinforcing interest in indications where avoiding multi-week external-beam scheduling is operationally valuable.
Software and workflow integration also represents a practical opportunity area, because IORT success depends on fast intraoperative planning, documentation, and QA, not beam delivery alone. The May 2024 FDA 510(k) clearance of GMV Soluciones Globales Internet S.A.U. for Radiance V5 (IORT treatment planning and dose distribution analysis) points to procurement demand for treatment-planning and analytics layers that fit hybrid-OR workflows and multi-vendor environments. In parallel, reimbursement-linked purchasing in value-based care settings and vendor-led financing and service bundles create room to expand installations in mid-sized hospitals and specialty sites that want lower upfront risk while maintaining compliance and audit readiness.
Recent Industry Developments
- May 2026: Sensus Healthcare highlighted the rollout of Sensus Link and its associated connectivity capabilities as part of business updates, building a pathway for remote serviceability and operating consistency across its installed base. The initiative supports a more service-led model in which software, connectivity, and uptime can influence purchasing decisions alongside hardware performance.
- February 2026: Sensus Healthcare introduced Sensus Link, a cloud-based software and connectivity solution aimed at improving serviceability and standardizing operation across SRT-100 systems, with a phased commercial rollout during 2026. Expanding the digital layer adds recurring software and support touchpoints and can reduce operational friction for sites managing multiple systems.
- May 2024: GMV Soluciones Globales Internet S.A.U. received FDA 510(k) clearance for Radiance V5 for IORT treatment planning and dose distribution analysis. This clearance underscores demand for advanced planning and analytics that fit hybrid operating room workflows and multi-vendor environments, supporting more integrated intraoperative workflows.


Research Methodology Framework and Report Scope
Market Definition and Coverage
This market covers the revenues generated from delivering radiation during a surgical procedure using intraoperative radiation therapy systems, related applicators, shielding, and associated services that support treatment delivery in the operating room.
Scope exclusions: External beam radiotherapy delivered outside the operating room, standalone diagnostic imaging, and general surgical tools not used for IORT delivery are excluded.
Segmentation Overview
-
By Method
- Electron IORT
- Intraoperative Brachytherapy
- Other Methods
-
By Products and Services
-
Products
- Systems and Accelerators
- Applicators & Afterloaders
- Treatment Planning Systems
- Accessories
- Services
-
Products
-
By Application
- Breast Cancer
- Brain Tumor
- Gastro-intestinal Cancer
- Head and Neck Cancer
- Other Applications
-
By End User
- Hospitals
- Specialty Clinics
- Others
-
By Geography
-
North America
- United States
- Canada
- Mexico
-
Europe
- Germany
- United Kingdom
- France
- Italy
- Spain
- Rest of Europe
-
Asia-Pacific
- China
- Japan
- India
- Australia
- South Korea
- Rest of Asia-Pacific
-
Middle East and Africa
- GCC
- South Africa
- Rest of Middle East and Africa
-
South America
- Brazil
- Argentina
- Rest of South America
-
North America
Data Sources, Market Sizing, and Validation
Desk Research
To build the base structure of the model, we start with public information that helps explain the demand pool and the care pathway where IORT is used. Common references include sources such as the World Health Organization cancer statistics, the International Agency for Research on Cancer (GLOBOCAN) incidence and mortality tables, the US FDA device databases and safety communications, the US National Cancer Institute clinical guidance pages, and peer reviewed oncology and radiation therapy journals.
Along with these, we review company annual reports, investor decks, procedure and guideline updates published by clinical societies, and credible hospital publications that describe adoption patterns and care settings. Where needed, we also use paid database subscriptions for company financials and intelligence and for patent databases to support product mapping and commercialization timing. The desk sources listed here are illustrative, and many other public references were used for cross checks, clarification, and validation.
Primary Interviews and Surveys
Primary work is used to pressure test the desk assumptions and to fill in gaps that are not visible in public data, especially around how often IORT is used, what equipment mix is preferred, and how service revenue is recognized. We speak with a balanced mix of hospital based clinicians, radiation oncology teams, procurement leads, and industry participants across major regions so the final view reflects real adoption constraints and pricing behavior.
Distribution of primary research fieldwork respondents
| Company type | Respondent position | Region |
|---|---|---|
| Top tier: 33% | CXOs: 22% | APAC: 46% |
| Mid tier: 45% | Functional/Unit leaders: 22% | EMEA: 34% |
| Smaller Players: 22% | Managers: 56% | Americas: 20% |
Market-Sizing & Forecasting
Sizing starts from a top-down build where cancer surgery volumes are reconstructed by key indications and then filtered through IORT eligibility, adoption rates by care setting, and the typical split between equipment revenue and service revenue. Once the demand pool is framed, the total is checked using selective bottom-up approximations like sampled system installations by country, average procedure throughput per system, and typical selling price bands for capital equipment and consumables.
Key inputs that shape the totals include breast conserving surgery volumes, trends in local recurrence management, operating room time constraints that impact feasibility, replacement cycles for mobile accelerators and brachytherapy platforms, and differences in reimbursement or bundled payment coverage. For forecasting, we rely on scenario analysis supported by expert consensus, where adoption curves are adjusted by planned oncology capacity additions, training availability, and expected price progression by modality. When local installation data is thin, gaps are handled through peer country analogs and then rechecked against regional demand indicators before finalizing.
Data Validation & Update Cycle
Outputs are validated through multiple checks so large jumps are explained before sign off. We compare modeled revenue with independent signals such as installed base growth, observed procedure adoption ranges, and capital purchasing patterns in major hospital systems, and then outliers are reviewed and corrected with follow-up questions.
A second analyst reviews the assumptions, conversions, and year alignment, followed by a final quality pass that confirms the math ties across segments and regions. Reports are refreshed annually, and interim updates are triggered when major regulatory actions, reimbursement changes, or product launches materially shift adoption. Before delivery, we do a last sweep so clients receive the most current view available at that time.
Mordor Intelligence's Intraoperative Radiation Therapy Market Sizing Compared With Other Published Estimates
Published market values for IORT can vary a lot because firms do not always count the same revenue streams, the same therapy methods, or the same year cutoffs. Differences also come from how procedure volumes are estimated, how pricing is updated, and whether services are treated as part of the market or left out.
The main gap comes from what gets counted as IORT revenue, where Mordor Intelligence includes both product and service lines tied to electron IORT and intraoperative brachytherapy, and it avoids inflating totals with broader radiotherapy equipment that is not used during surgery. Spreads also appear when some estimates apply aggressive adoption assumptions for faster growing regions, use a single global ASP without country adjustments, or convert currencies using a different timing that shifts the reported USD value.
Benchmark comparison
| Source | Market Size | Gaps in Research Methodology |
|---|---|---|
| Mordor Intelligence | USD 132.93 M (2026) | |
| Global Research Publisher A | USD 121.74 M (2024) | Uses an earlier base year and a different forecast window, and its sizing is more sensitive to base year installation assumptions, which can understate countries where service revenue and upgrades are meaningful. |
| Market Research Publisher B | USD 322.67 M (2024) | Likely applies a wider revenue scope or counts adjacent radiotherapy categories alongside IORT, and it can also reflect higher assumed procedure penetration and a broader inclusion of products beyond intraoperative use. |
Taken together, the spread is mostly explained by scope choices, year alignment, and how adoption and pricing are refreshed. By keeping the demand pool tied to surgical oncology use cases and then cross checking with installation and throughput signals, the final number stays traceable to clear assumptions that can be reviewed and repeated.


Key Questions Answered in the Report
What is the projected value of intraoperative radiation therapy worldwide by 2031?
It is forecast to reach USD 192.79 million, reflecting a 7.72% CAGR from 2026.
Which treatment method currently holds the largest share?
Electron IORT leads with 59.45% share due to long-standing clinical familiarity.
Why are specialty clinics recording faster adoption than hospitals?
Focused workflows and lower capital hurdles enable specialty sites to scale IORT programs quickly.
How do bundled-payment models influence purchasing decisions?
Single-dose IORT fits bundled episodes, letting providers capture savings versus multi-fraction regimens.
What workforce issue could restrict expansion?
Global shortages of radiation therapists and medical physicists limit the formation of multidisciplinary IORT teams.
Which geographic region is expected to grow fastest through 2031?
Asia-Pacific, expanding at an estimated 8.71% CAGR as governments invest in advanced oncology capabilities.
Page last updated on:


 Your data is secure and never sold or shared.


