
Internet Of Medical Things Market Size and Share
Market Overview
| Study Period | 2020 - 2031 |
|---|---|
| Market Size (2026) | USD 65.71 Billion |
| Market Size (2031) | USD 145.23 Billion |
| Growth Rate (2026 - 2031) | 17.19 % |
| Fastest Growing Market | Asia-Pacific |
| Largest Market | North America |
| Market Concentration | Medium |
Major Players *Disclaimer: Major Players sorted in no particular order Image © Mordor Intelligence. Reuse requires attribution under CC BY 4.0. | |
Internet Of Medical Things Market Analysis by Mordor Intelligence
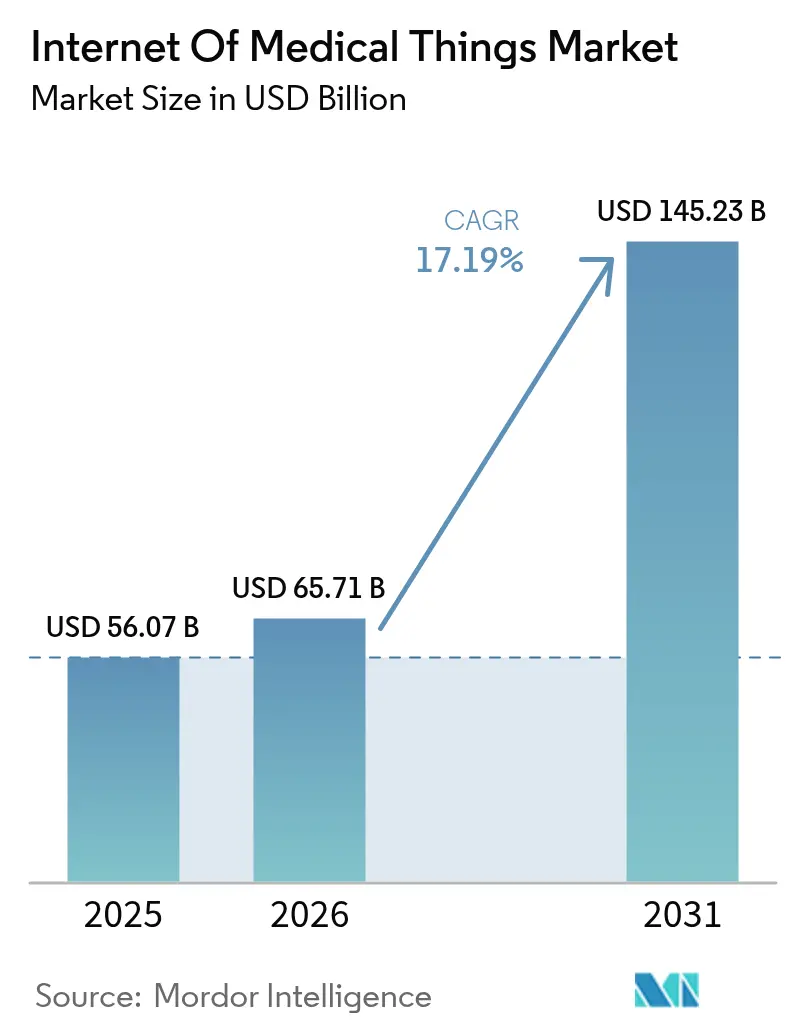
The Internet of Medical Things Market size is expected to grow from USD 56.07 billion in 2025 to USD 65.71 billion in 2026 and is forecast to reach USD 145.23 billion by 2031 at 17.19% CAGR over 2026-2031. Strong momentum reflects healthcare providers’ shift to connected-care models that blend real-time data analytics with remote monitoring to curb costs and improve outcomes. Growth also benefits from ultra-low-power AI sensors, private 5G rollouts across hospital campuses, and cyber-insurance requirements that compel full device visibility. New reimbursement rules that reward measurable outcome improvements keep capital flowing into connected solutions, while semiconductor shortages spur innovation in edge architectures that reduce hardware dependencies. Regionally, North America sustains leadership through mature infrastructure and favorable regulation, yet Asia Pacific registers the fastest expansion as 5G investments and government-backed digital-health programs accelerate adoption.
Key Report Takeaways
- By device type, wearable devices led with 26.62% of the Internet of Medical Things market share in 2025, while implantable devices are forecast to grow at a 19.04% CAGR through 2031.
- By product type, vital signs monitoring devices commanded a 32.08% share of the Internet of Medical Things market size in 2025; implantable cardiac devices are projected to expand at a 17.62% CAGR to 2031.
- By end user, hospitals accounted for 40.56% of the Internet of Medical Things market size in 2025, whereas home-care settings are advancing at an 18.25% CAGR to 2031.
- By connectivity technology, Wi-Fi maintained a 44.28% revenue share in 2025; cellular IoT and LPWAN are expected to grow at a 19.83% CAGR through 2031.
- By region, North America held 38.22% of the Internet of Medical Things market share in 2025, and Asia Pacific is projected to record a 20.71% CAGR to 2031.
Note: Market size and forecast figures in this report are generated using Mordor Intelligence’s proprietary estimation framework, updated with the latest available data and insights as of 2026.
Market Trends and Insights
Drivers Impact Analysis of Internet Of Medical Things Market*
| Driver | ( ) % Impact on CAGR Forecast | Geographic Relevance | Impact Timeline |
|---|---|---|---|
| Cost-reduction pressure on global healthcare systems | +3.20% | Global | Medium term (2–4 years) |
| Proliferation of connected wearables and implantables | +4.10% | North America & EU, APAC core | Short term (≤ 2 years) |
| Shift to outcomes-based and remote patient-monitoring models | +3.80% | Global, early gains in North America, Europe | Medium term (2–4 years) |
| Roll-out of private 5G and edge networks in hospitals | +2.90% | North America & EU, APAC emerging markets | Long term (≥ 4 years) |
| Source: Mordor Intelligence | |||
Cost-reduction Pressure on Global Healthcare Systems
Healthcare providers face steep cost escalation, with United States supply-chain disruptions pushing expenses up by 15% in 2025. Connected devices cut unplanned downtime through predictive maintenance and real-time asset tracking, as illustrated by RWJBarnabas Health’s USD 9 million savings after deploying a location system that eliminated device losses[1]. Value-based reimbursement amplifies adoption because hospitals must document outcome improvements alongside cost controls. Capital budgets consequently treat the Internet of Medical Things market as essential infrastructure, prompting multiyear procurement commitments. Insurers further link reimbursement to documented savings, reinforcing a cycle that channels operating funds to connected platforms.
Proliferation of Connected Wearables and Implantables
Breakthroughs in wireless power and miniaturized sensor arrays now permit battery-free devices that transmit only relevant data, conserving bandwidth and energy. Brown University demonstrated salt-sized sensors capable of monitoring intracranial pressure and glucose simultaneously, enabling continuous care without recurrent surgery. Consumer demand for preventive health data broadens deployment beyond clinical settings, ensuring the Internet of Medical Things market finds growth in wellness as well as disease management. Device makers embed edge AI that filters noise before transmission, reducing cloud-processing costs. Regulatory pathways are smoothing as real-world performance data accumulates, shortening approval cycles for next-generation implants.
Shift to Outcomes-based and Remote Patient-Monitoring Models
Outcomes-linked contracts reward providers for measurable improvements rather than service volume, accelerating connected-device uptake[2]. Guthrie Clinic’s virtual hub saved USD 7 million in labor and cut nurse turnover to 13% through remote monitoring. COVID-19 validated hospital-at-home models that now receive routine reimbursement in mature markets. Asia Pacific outpaces other regions in digital-health tool adoption, with AI decision support integrated across many public systems. The Internet of Medical Things market benefits as continuous data streams support personalized care pathways while easing capacity constraints.
Roll-out of Private 5G and Edge Networks in Hospitals
Hospitals view private 5G as foundational for latency-sensitive applications such as remote surgery. Sweden’s USD 35 million VGR-5G program links 500 medical facilities, replacing legacy DECT voice systems. China’s First Affiliated Hospital of Soochow University connected more than 3,000 devices over a 5G network, cutting deployment time by 90%. Edge compute nodes process imaging and AI monitoring onsite, lowering bandwidth needs and enhancing resilience during connectivity interruptions. These networks' future-proof capacity for exploding data volumes as the Internet of Medical Things market scales.
Restraints Impact Analysis of Internet Of Medical Things Market*
| Restraint | ( ) % Impact on CAGR Forecast | Geographic Relevance | Impact Timeline |
|---|---|---|---|
| Shortage of in-house IoT skills in provider organisations | -2.10% | Global, acute in developing markets | Medium term (2–4 years) |
| Escalating ransomware premiums diverting IoMT budgets | -2.30% | North America & EU | Short term (≤ 2 years) |
| Source: Mordor Intelligence | |||
Shortage of In-house IoT Skills in Provider Organisations
Thirty percent of healthcare enterprises cite data-security expertise shortages as an adoption hurdle. Smaller hospitals struggle to recruit cyber-literate engineers, widening the gap between resource-rich systems and rural facilities. Managed services bridge some needs but introduce vendor-lock risks and subscription overhead. Talent deficits are pronounced in Southeast Asia despite high investment intent. Without robust in-house teams, deployment timelines extend, slowing Internet of Medical Things market penetration.
Escalating Ransomware Premiums Diverting IoMT Budgets
Healthcare ransomware incidents now average one breach per week, with per-incident costs reaching USD 10.93 million. Insurers require multi-factor authentication and network segmentation before underwriting, shifting funds from device procurement to security controls. The sector’s 61% ransom payment rate emboldens attackers, forcing providers to prioritize cyber defenses over expanded connectivity. Consequently, organizations face a chicken-and-egg dilemma: they need visibility tools to qualify for insurance, yet require insurance to approve device investments, tempering short-term Internet of Medical Things market growth.
*Our forecasts treat driver/restraint impacts as directional, not additive. The impact forecasts reflect baseline growth, mix effects, and variable interactions.
Internet Of Medical Things Market Segment Analysis
By Device Type:
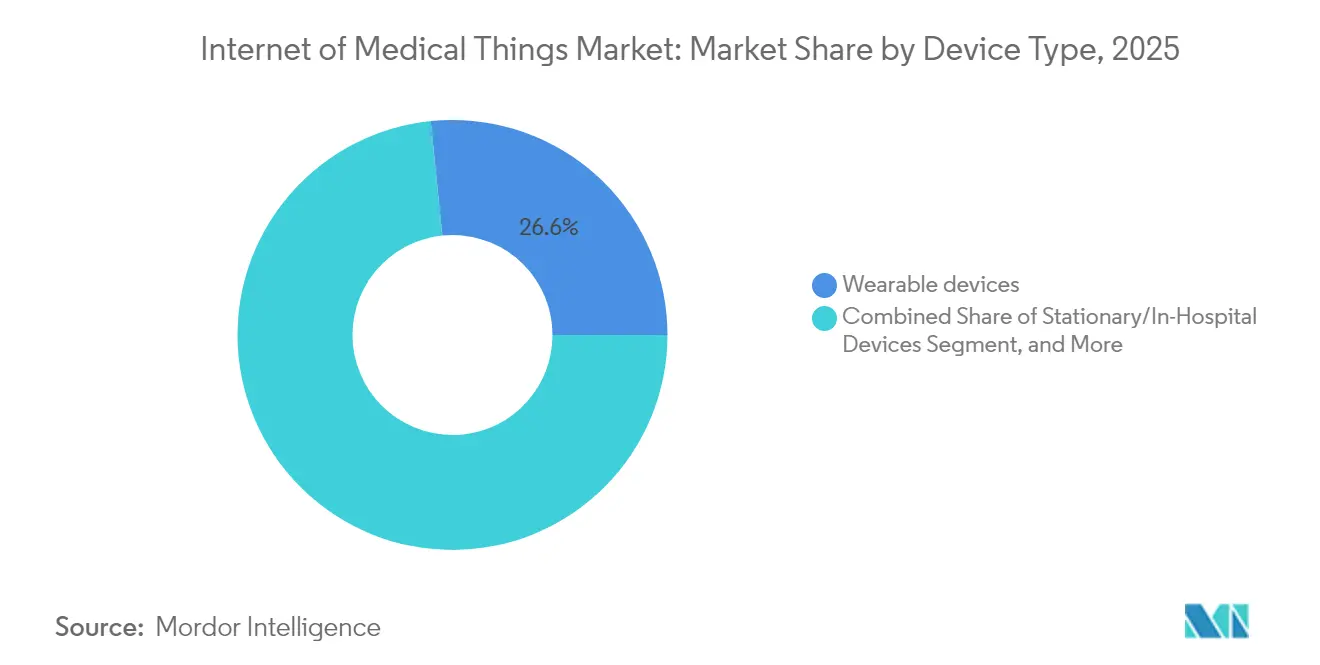
Implantables Drive Innovation SurgeImplantable devices represent the fastest-growing segment, projected to expand at 19.04% CAGR through 2031, while wearables maintained leadership with 26.62% share of the Internet of Medical Things market size in 2025. Wireless power transfer and sub-millimeter sensors eliminate battery replacements and support continuous multi-parameter measurement. Stationary in-hospital systems remain connectivity hubs for network orchestration, ensuring data integrity across thousands of endpoints.
The University of California’s ultrasound-powered fluorescence sensor shows how deep-tissue imaging can guide cancer therapy without external leads. Wearables absorb these advances, combining sensor fusion with edge analytics to issue timely alerts. Emerging smart contact lenses and biodegradable probes add niche opportunities that diversify the Internet of Medical Things market. Regulatory approvals favor implants that demonstrate longitudinal safety and outcome benefits, encouraging sustained R&D spending.

By Product Type:
Cardiac Devices Accelerate GrowthVital-sign monitoring products held a 32.08% share in 2025, demonstrating their role as baseline tools across care settings. Implantable cardiac devices are slated to grow at a 17.62% CAGR, supported by closed-loop neuromodulation that optimizes therapy based on real-time neural feedback. Respiratory monitors gain relevance due to rising COPD prevalence, while anaesthesia machines integrate connected sensors to enhance intraoperative safety.
Predictive maintenance algorithms applied to imaging systems and ventilators reduce downtime and extend asset life. Smart pill dispensers and connected rehabilitation gear broaden engagement beyond acute care, adding recurring revenue streams for vendors. Together, these dynamics elevate the Internet of Medical Things market and enhance cross-device ecosystem value.
By End User:
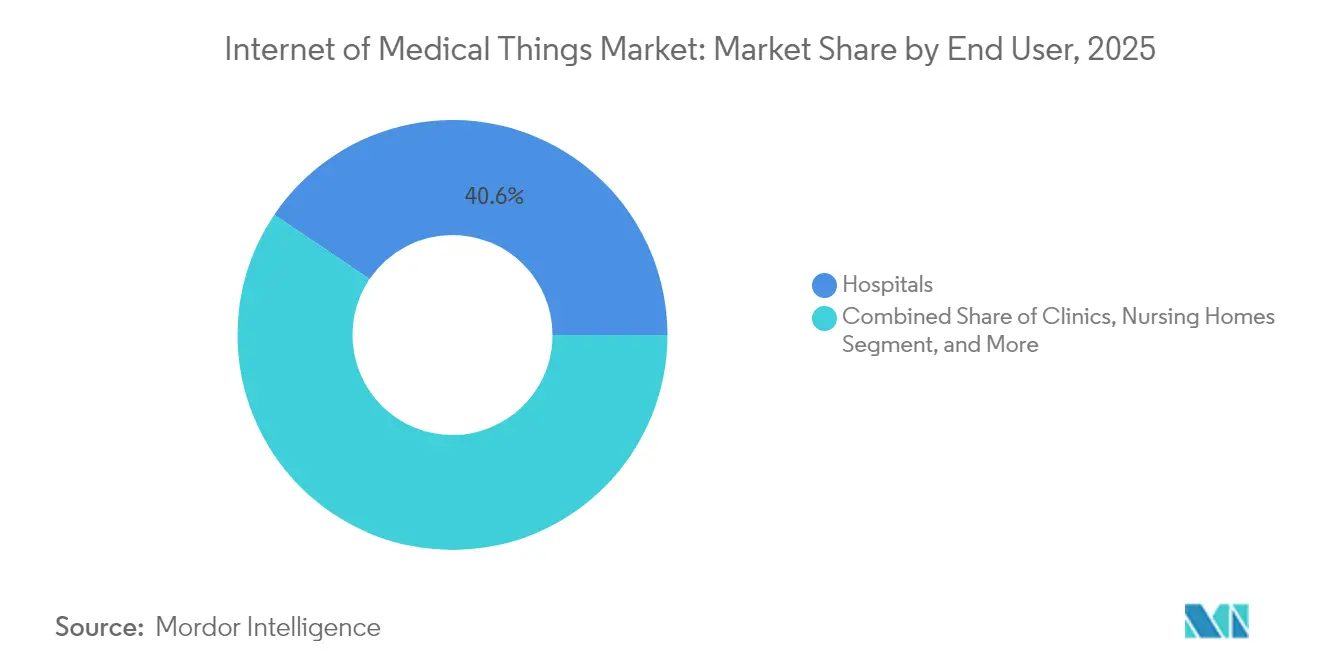
Home-care Settings Transform DeliveryHospitals retained 40.56% of the Internet of Medical Things market size in 2025, yet home-care settings are projected to grow at an 18.25% CAGR as virtual wards become mainstream. Continuous monitoring at home reduces readmissions and frees hospital beds for higher acuity cases. Clinics and nursing homes adopt connected workflows to optimize staffing and coordinate chronic-disease management.
Guthrie Clinic’s virtual hub illustrates cost savings and staff retention benefits, marking a reference model for similar deployments. Progress in plug-and-play wireless sensors lowers installation barriers, enabling smaller providers to offer clinical-grade remote monitoring. These trends expand the Internet of Medical Things market into community care and pave the way for preventive service packages.
By Connectivity Technology:
Cellular IoT Gains MomentumWi-Fi accounted for 44.28% of revenue in 2025, but cellular IoT and LPWAN solutions are forecast to climb at a 19.83% CAGR through 2031 as providers extend monitoring beyond facility walls. Private 5G within hospitals reserves dedicated bandwidth for mission-critical applications, while LTE-M and NB-IoT support low-power devices across broad geographies.
Bluetooth continues to link wearables to smartphones, and Zigbee maintains relevance for sensor-dense environments. Emerging Li-Fi and satellite links serve remote or shielded locations, creating multi-path architectures that raise reliability. Edge processing at the radio gateway trims backhaul requirements, boosting scalability for the Internet of Medical Things market.
Geography Analysis
North America Internet of Medical Things Market
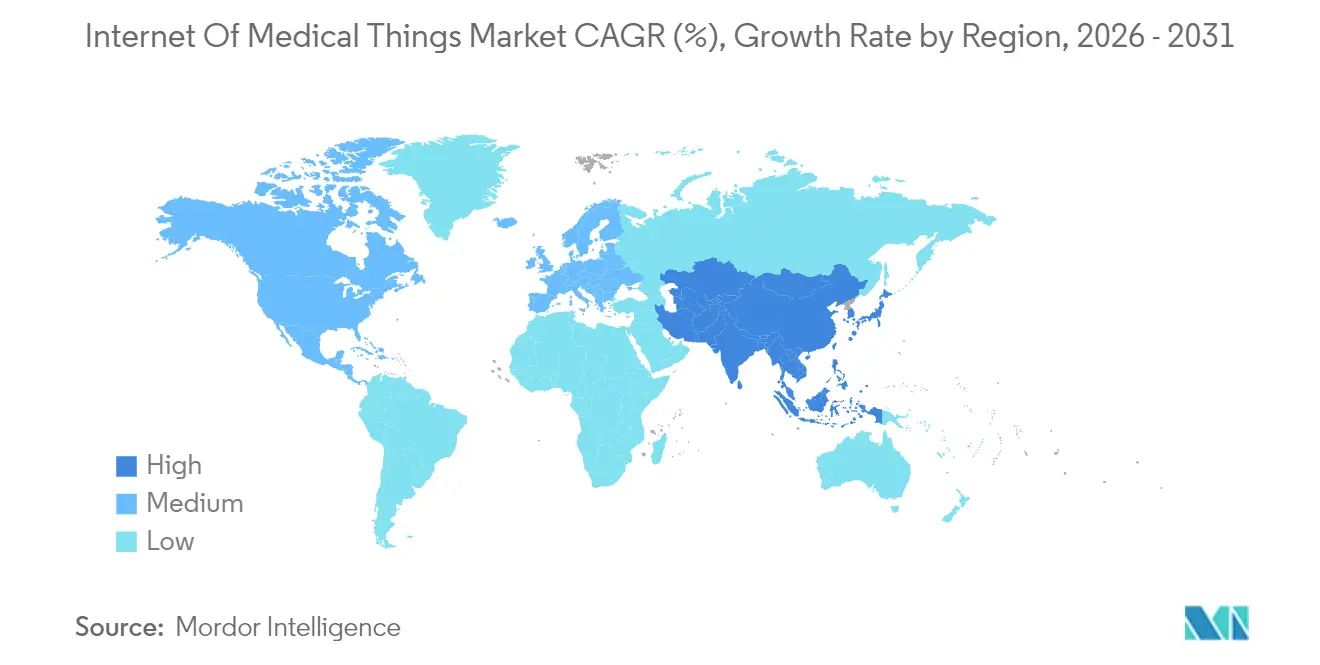
North America commanded a 38.22% share in 2025, propelled by mature health-IT infrastructure and regulatory pathways that encourage interoperability. Public-private alliances fast-track private-5G pilots and AI-enabled diagnostics. Canada and Mexico add momentum through government-funded telehealth initiatives, while rising cyber-insurance premiums and semiconductor shortages temper near-term device rollouts. Legacy system integration remains a capital-intensive obstacle, yet strong reimbursement models keep the Internet of Medical Things market advancing.
APAC Internet of Medical Things Market
Asia Pacific is the fastest-growing region at a 20.71% CAGR. China’s 2024 medical-informatization spending surpassed CNY 800 billion, underscoring state support. Japan and South Korea leverage advanced manufacturing to deliver next-generation sensors, and India’s national EHR rollout aids standardization. Skilled-personnel shortages persist, but cross-border training and cloud-based managed services lessen the gap. Regional collaboration spreads best practices, ensuring broad participation in the expanding Internet of Medical Things market.
Europe Internet of Medical Things Market
Europe records steady gains supported by Medical Device Regulation compliance that clarifies connected-device requirements. Germany, the United Kingdom, and France lead adoption through funded modernization programs, while Italy and Spain tap EU stimulus to upgrade infrastructure. Strict data-privacy laws elevate implementation costs yet build patient trust. Switzerland’s Kantonsspital Baden installed more than 7,000 sensors with Siemens, proving the scalability of smart-hospital visions. Harmonized policies let smaller economies piggyback on regional frameworks, sustaining Internet of Medical Things market momentum across the continent.
Regulatory Landscape
Regulation for Internet of Medical Things (IoMT) products continues to be enforced through existing medical device frameworks rather than a standalone IoMT statute, which raises the role of cybersecurity and software lifecycle evidence in traditional submissions. In the United States, Section 524B of the FD&C Act (21 U.S.C. 360n-2) hardens premarket expectations for cyber devices by formalizing cybersecurity documentation, including SBOM and related lifecycle controls, as part of submissions routed through pathways such as 510(k), De Novo, and PMA.
For compliance, the FDA Quality Management System Regulation (QMSR) is a key anchor, effective February 2, 2026, and it is followed by the FDA updated cybersecurity guidance on February 3, 2026. Together, these steps align quality-system practice with cybersecurity-by-design. In Europe, connected-device compliance is shaped by the combination of sector rules (EU MDR/IVDR) and horizontal cybersecurity requirements under the EU Cyber Resilience Act (2024). In parallel, the European Commission proposal (COM(2025) 1023, December 2025) to amend MDR/IVDR signals an effort to reduce administrative burden while keeping core safety and performance obligations in place for connected technologies.
Value Chain Analysis
The IoMT value chain starts with component and subsystem suppliers (sensors, low-power compute, connectivity modules) and moves through device OEMs and software developers that embed security controls and data models into firmware, mobile apps, and gateways. Connectivity and platform layers (Wi-Fi, cellular IoT/LPWAN, private 5G, edge nodes, and cloud) then transport and process device data, which is integrated into provider workflows through interoperability interfaces to EHR and clinical systems. After deployment, cybersecurity monitoring and lifecycle support complete the loop.
Regulatory- and standards-driven work increasingly sits inside the chain rather than as an after-the-fact check. That shift encourages suppliers to provide evidence artifacts, such as SBOM inputs and secure development practices, that feed into OEM premarket and postmarket obligations. Interoperability and security standards also shape handoffs between ecosystem participants, including IEEE 11073 for device data exchange and service-oriented device connectivity approaches such as SDC. FDA recognition of AAMI CR515:2025 (added to the FDA recognized consensus standards database in March 2026) reinforces cybersecurity expectations for AI/ML-enabled medical devices, while integration remains a persistent friction point when heterogeneous device fleets and privacy and security requirements must scale from pilots to enterprise deployments across hospitals and home-care settings.
Competitive Landscape
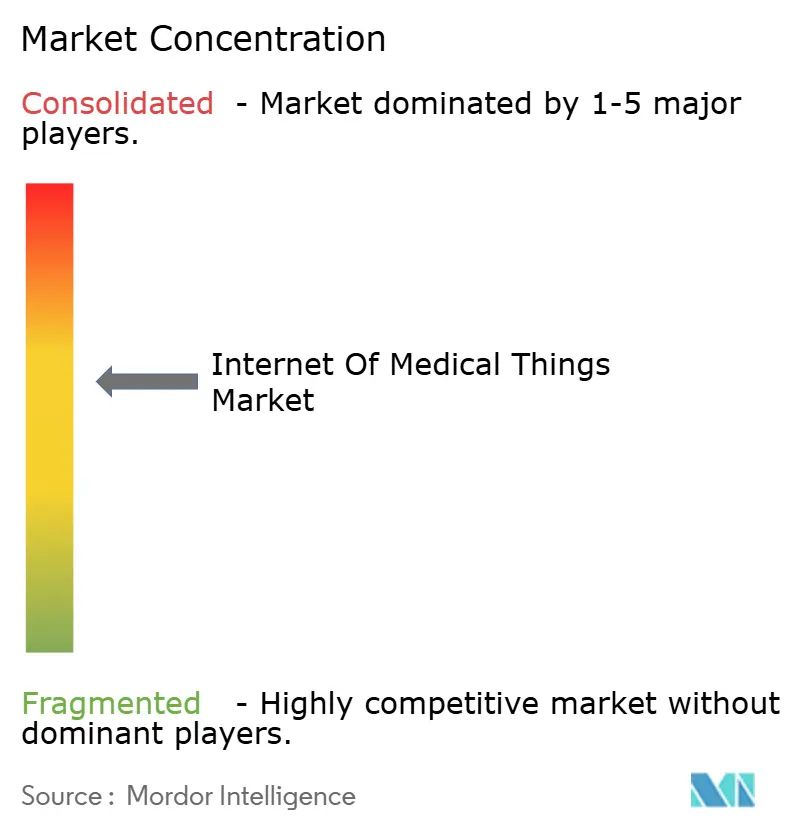
The Internet of Medical Things market remains moderately fragmented, with established device manufacturers and cybersecurity specialists contesting leadership. GE Healthcare, Philips, and Medtronic differentiate by embedding connectivity across imaging, monitoring, and therapeutic portfolios, while newer entrants emphasize software-defined platforms that decouple intelligence from dedicated hardware. Cyber-security vendors such as Armis and Cynerio secure critical infrastructure by discovering unmanaged devices; Armis reports identifying twice as many assets as clients first estimated.
Strategic acquisitions accelerate capability building. Stryker bought care.ai to integrate ambient intelligence into nursing workflows, and BD spent USD 4.2 billion on Edwards Lifesciences’ Critical Care Unit to deepen smart monitoring. Patent filings cluster around wireless power, AI sensors, and zero-trust security. Samsung’s non-invasive glucose patent hints at competitive disruption potential.
Supply-chain constraints shift focus to edge computing that reduces chip counts. Vendors offering full-stack solutions spanning device, data, and defense gain preference as hospitals seek single-throat-to-choke service models. Cyber-insurance stipulations push joint offerings that bundle monitoring with threat detection, reinforcing partnerships between device makers and security firms. These dynamics shape an ecosystem where collaboration often replaces zero-sum competition to unlock Internet of Medical Things market value.
Internet Of Medical Things Industry Leaders
-
GE Healthcare
-
Koninklijke Philips N.V.
-
Medtronic plc
-
Cisco Systems, Inc.
-
IBM Corporation
- *Disclaimer: Major Players sorted in no particular order
Internet Of Medical Things Market Companies Covered in this Report
- GE Healthcare
- Koninklijke Philips N V
- Medtronic plc
- Cisco Systems Inc.
- IBM Corporation
- Siemens Healthineers
- Hill-Rom /Welch Allyn
- Boston Scientific Corp.
- Johnson and Johnson (JandJ MedTech)
- Biotronik SE
- Abbott Laboratories
- Dexcom Inc.
- ResMed Inc.
- Apple Inc.
- Fitbit (Google LLC)
- Qualcomm Life
- Honeywell International
- Capsule Technologies
- Ordr Inc.
- Armis Security
- Cynerio Ltd.
Market Opportunities and Future Outlook
A near-term opportunity is emerging at the point where cybersecurity compliance meets operational deployment. Providers and manufacturers are operationalizing the FDA QMSR (effective February 2, 2026) and the updated FDA cybersecurity guidance (February 3, 2026) with documentation-driven controls such as SBOM management, threat modeling, and secure update pipelines. This creates whitespace for software, services, and managed-security offerings designed for medical device fleets, particularly where cyber-insurance and audit readiness depend on continuous asset discovery and segmentation rather than one-time device onboarding.
Interoperability-led platform expansion is another opening with visible ecosystem signals. GE HealthCare joining OR.NET e.V. to support SDC indicates that multi-vendor device integration is being treated as core infrastructure. Philips selection of AWS as its preferred cloud provider, alongside its stated scale of over 1.3 million IoT devices connected to the cloud, reinforces demand for scalable data pipelines and device management across modalities and care sites. Standards alignment around HL7 FHIR for data exchange and EN ISO/IEEE 11073-10700:2025 for SDC also supports vendors that can translate standards into deployable, clinical-grade connectors and validation toolchains across hospitals, clinics, and home-care settings.
Recent Industry Developments in Internet Of Medical Things Market
- April 2026: GE HealthCare hosted an IoMT-focused webinar on preparing for the next era of smart healthcare, emphasizing workflow simplification and predictive insights from connected ecosystems. The messaging reflects a vendor push toward platform-level enablement, positioning analytics, connectivity, and device visibility as integrated capabilities for enterprise deployments.
- November 2025: Medtronic opened its first Digital Healthcare Innovation Hub in Beijing to integrate AI, big data, and IoMT for diagnostics and remote patient monitoring. The hub strengthens localization and co-development capacity in China, supporting faster iteration of connected-care solutions with regional providers and partners.
- March 2025: Philips selected Amazon Web Services (AWS) as its preferred cloud provider to accelerate healthcare informatics offerings and referenced connecting more than 1.3 million IoT devices to the cloud. The move highlights the importance of cloud-scale device connectivity and data services in supporting multi-site monitoring, analytics, and integration across clinical environments.
Internet Of Medical Things Market Report Scope and Research Methodology
Market Definition and Coverage
This market covers connected medical devices and related IoMT products that collect, transmit, and use clinical or patient data across care settings, including hospitals and clinics, with spending measured in revenue terms across major regions.
Scope exclusions: We do not count general-purpose consumer IoT gadgets that are not used for medical monitoring or clinical workflows, and we also exclude stand-alone telecom network revenue.
Segments Covered in This Report
- By Device Type
- Wearable Devices
- Stationary/In-Hospital Devices
- Implantable Devices
- Other Device Types
- By Product Type
- Vital Signs Monitoring Devices
- Implantable Cardiac Devices
- Respiratory Devices
- Anaesthetic Machines
- Imaging Systems
- Ventilators
- Other Products
- By End User
- Hospitals
- Clinics
- Nursing Homes
- Long-Term Care Centers
- Home Care Settings
- By Connectivity Technology
- Zigbee
- Bluetooth
- Wi-Fi
- Cellular IoT/LPWAN
- Other Technologies
- By Geography
- North America
- United States
- Canada
- Mexico
- Europe
- Germany
- United Kingdom
- France
- Italy
- Spain
- Rest of Europe
- Asia-Pacific
- China
- Japan
- India
- South Korea
- Rest of Asia-Pacific
- Middle East and Africa
- Middle East
- Saudi Arabia
- United Arab Emirates
- Turkey
- Rest of Middle East
- Africa
- South Africa
- Nigeria
- Kenya
- Rest of Africa
- Middle East
- South America
- Brazil
- Argentina
- Rest of South America
- North America
Data Sources, Market Sizing, and Validation
Desk Research
Desk research is used to set the boundaries of what counts as IoMT and to build the starting pool for adoption and usage. We referenced public sources such as the US FDA device and digital health guidance pages, the US CDC chronic disease statistics, OECD health data, and WHO health indicators to understand demand-side pressure points and care delivery patterns.
To anchor supply-side context, we also reviewed company annual reports, investor presentations, and product literature for connected monitoring and implantable device portfolios, then checked reputed press coverage and association websites for regulatory and interoperability changes. Where helpful, paid subscriptions for company financials and for patent databases were used to track product intensity and R&D direction, which then informed realistic assumption ranges. These examples are illustrative only, since many other public sources were also checked for data collection, validation, and clarification.
Primary Interviews and Surveys
Primary discussions helped validate what portion of device shipments is actually connected, how hospitals and clinics budget for monitoring upgrades, and how pricing differs by device class and care setting. We spoke with a mix of device-focused stakeholders, healthcare IT and biomedical teams, distributors, and service partners across APAC, EMEA, and the Americas, so regional procurement and reimbursement differences could be reflected in the final assumptions.
Distribution of primary research fieldwork respondents
| Company type | Respondent position | Region |
|---|---|---|
| Top tier: 28% | CXOs: 17% | APAC: 46% |
| Mid tier: 50% | Functional/Unit leaders: 29% | EMEA: 30% |
| Smaller Players: 22% | Managers: 54% | Americas: 24% |
Market-Sizing & Forecasting
Market sizing starts with a top-down build where the addressable pool is reconstructed using healthcare delivery volumes and connected-device penetration, and then refined by device type and care setting. We then corroborate totals with selective bottom-up checks, such as sampled ASP times estimated unit volumes for key connected monitoring categories, plus channel feedback on mix shifts, which are then used to adjust any overstatement.
Inputs that typically move the model include connected wearable and stationary monitoring adoption, installed base growth for implantables with telemetry, hospital and clinic digital monitoring budgets, average selling price movement by device class, and the pace of interoperability and cybersecurity compliance requirements. When a bottom-up check has gaps, such as limited unit disclosures, we bridge using proxy indicators like procedure volumes and average device replacement cycles, and we keep the adjustment logic consistent across regions.
For forecasting, we mainly use scenario analysis supported by a light multivariate regression check, because growth is driven by several linked factors rather than one clean time series. Assumptions for penetration and pricing are re-tested with expert inputs so the forward path stays realistic under both steady and faster adoption cases.
Data Validation & Update Cycle
Model outputs are cross-checked against independent signals such as healthcare IT spending direction, connected device shipment commentary, and regional regulatory timelines, and then inconsistencies are investigated before sign-off. If a major variance is observed, we re-check definitions, revisit key assumptions, and re-contact relevant interviewees to confirm whether the change is structural or temporary.
A multi-step internal review is followed so that calculation logic, unit consistency, and currency conversion timing align across the workbook and narrative. The report is refreshed on an annual cycle, and interim updates are made when material events occur, such as major reimbursement shifts or a meaningful regulatory change. Before delivery, a final analyst pass is completed so clients receive the most current view available.
Mordor Intelligence's Internet of Medical Things Market Estimate Compared With Other Published Estimates
Published IoMT market numbers can look far apart because the same phrase is used for different baskets of revenue. Differences usually come from what is counted as IoMT (device hardware only versus hardware plus software and services), which care settings are included, and whether consumer wellness wearables are blended into medical-grade monitoring.
By tracking connected-device penetration and care-setting purchase behavior, Mordor Intelligence keeps the IoMT total tied to medical device and clinical-use revenue, instead of expanding into broad digital health platforms, which explains a large part of the spread seen across sources.
Benchmark comparison
| Source | Market Size | Gaps in Research Methodology |
|---|---|---|
| Mordor Intelligence | USD 56.07 B (2025) | |
| Global Consultancy A | USD 77.49 B (2025) | A wider scope is implied, often folding in more software, connectivity, and service revenue around connected care, which inflates the addressable pool beyond device and product-linked IoMT spending. |
| Industry Publisher B | USD 99.55 B (2025) | The build is presented around manufacturer-side value capture and can treat adjacent connected healthcare categories as in-scope, while also using a different pricing and mix progression path that lifts the 2025 value. |
The table shows that the biggest drivers are scope boundaries and the way software and services are treated versus device and product revenue. When definitions are tightened to clinical-use connectivity and supported by penetration and budget checks, the result becomes easier to explain, repeat, and update as adoption and pricing change.
Key Questions Answered in the Report
What is the current size of the Internet of Medical Things market?
The market reached USD 65.71 billion in 2026 and is projected to grow to USD 145.23 billion by 2031, reflecting a 17.19% CAGR.
Which device type dominates the Internet of Medical Things market?
Wearable devices lead with a 26.62% share in 2025, while implantables post the fastest growth at a 19.04% CAGR.
Why is Asia Pacific the fastest-growing region?
Government-funded 5G rollouts, national digital-health programs, and rising healthcare spending push regional growth at a 20.71% CAGR.
How are private 5G networks affecting hospital IoMT deployments?
Private 5G enables ultra-low-latency connections for applications such as remote surgery and edge AI processing, cutting deployment time and cost.
What are the main restraints on IoMT adoption?
Skill shortages in provider IT teams and rising ransomware insurance premiums divert spending from new device deployments to cybersecurity.
Which companies are making notable strategic moves in the IoMT space?
Recent highlights include Stryker’s acquisition of care.ai for virtual-care workflows and BD’s USD 4.2 billion purchase of Edwards Lifesciences’ Critical Care Unit.