
Intermediate Bulk Container Market Size and Share
Market Overview
| Study Period | 2020 - 2031 |
|---|---|
| Market Size (2026) | USD 11.91 Billion |
| Market Size (2031) | USD 16.02 Billion |
| Growth Rate (2026 - 2031) | 6.11 % |
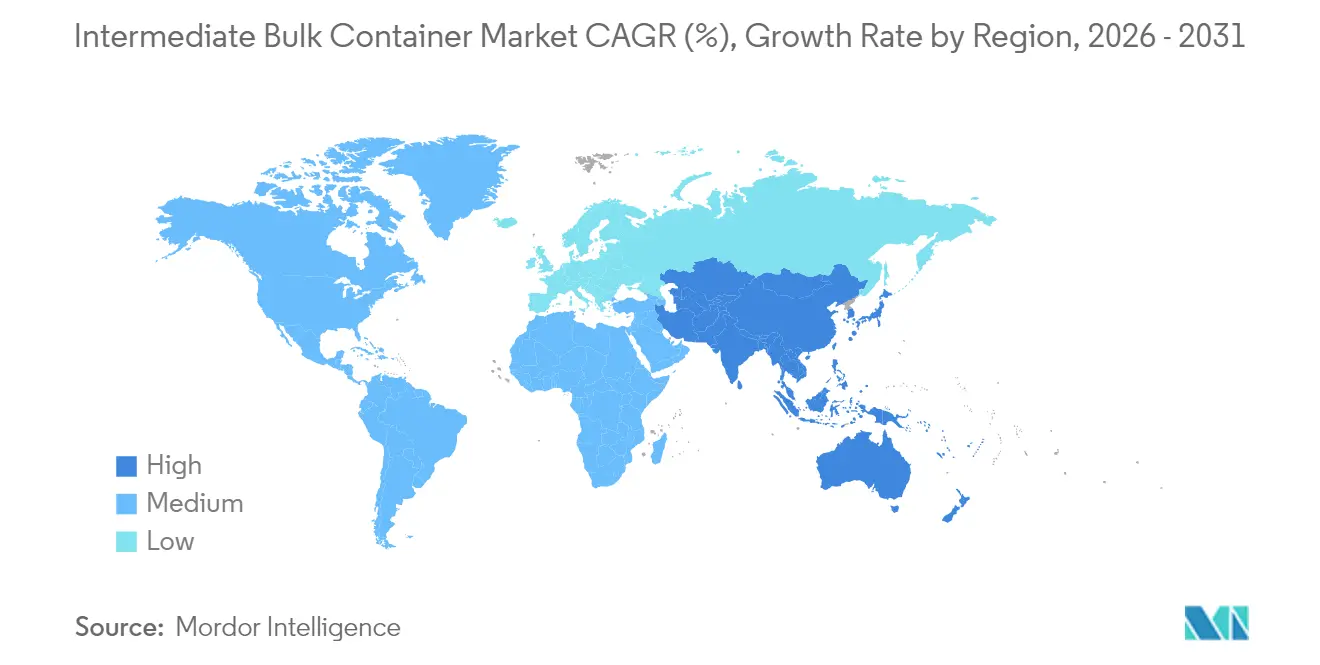
| Fastest Growing Market | Asia-Pacific |
| Largest Market | Asia Pacific |
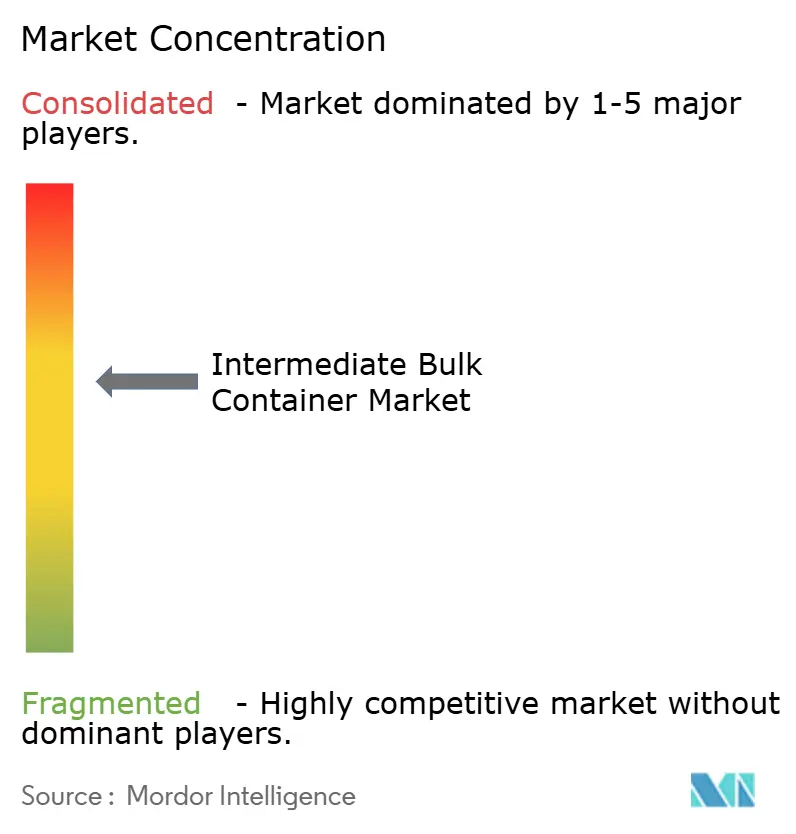
| Market Concentration | Medium |
Major Players *Disclaimer: Major Players sorted in no particular order Image © Mordor Intelligence. Reuse requires attribution under CC BY 4.0. | |
Intermediate Bulk Container Market Analysis by Mordor Intelligence
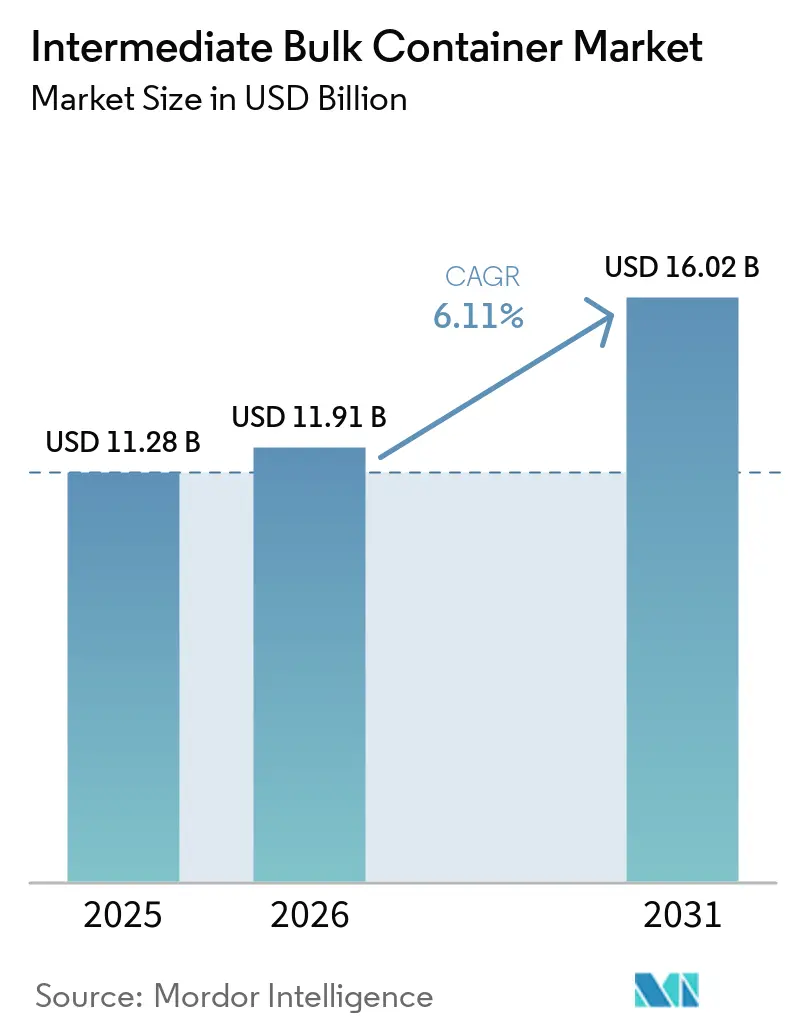
The Intermediate Bulk Container Market size was valued at USD 11.28 billion in 2025 and is estimated to grow from USD 11.91 billion in 2026 to reach USD 16.02 billion by 2031, at a CAGR of 6.11% during the forecast period (2026-2031). Accelerating adoption of IoT-enabled containers, strict traceability mandates in global chemical and pharmaceutical supply chains, and growing circular-economy regulations are reinforcing steady demand for advanced bulk-handling solutions. Flexibility in design, including collapsible and foldable variants, is allowing shippers to lower empty-return costs while maintaining payload integrity, a factor particularly attractive to exporters of high-margin ingredients. Parallel expansion of biosimilar drug production and specialty chemical capacity across Asia-Pacific keeps rigid composite configurations in favor even as flexible formats post faster growth.[1]Chemical and Engineering News, “Asia’s Chemical Capacity Expands,” cen.acs.org Consolidation among leading suppliers, with a focus on integrated reconditioning and digital service platforms, is enhancing after-sales value capture and intensifying competition at the premium end of the IBC market.[2]Greif Inc., “Greif Completes Acquisition of Ipackchem Group,” greif.com
Key Report Takeaways
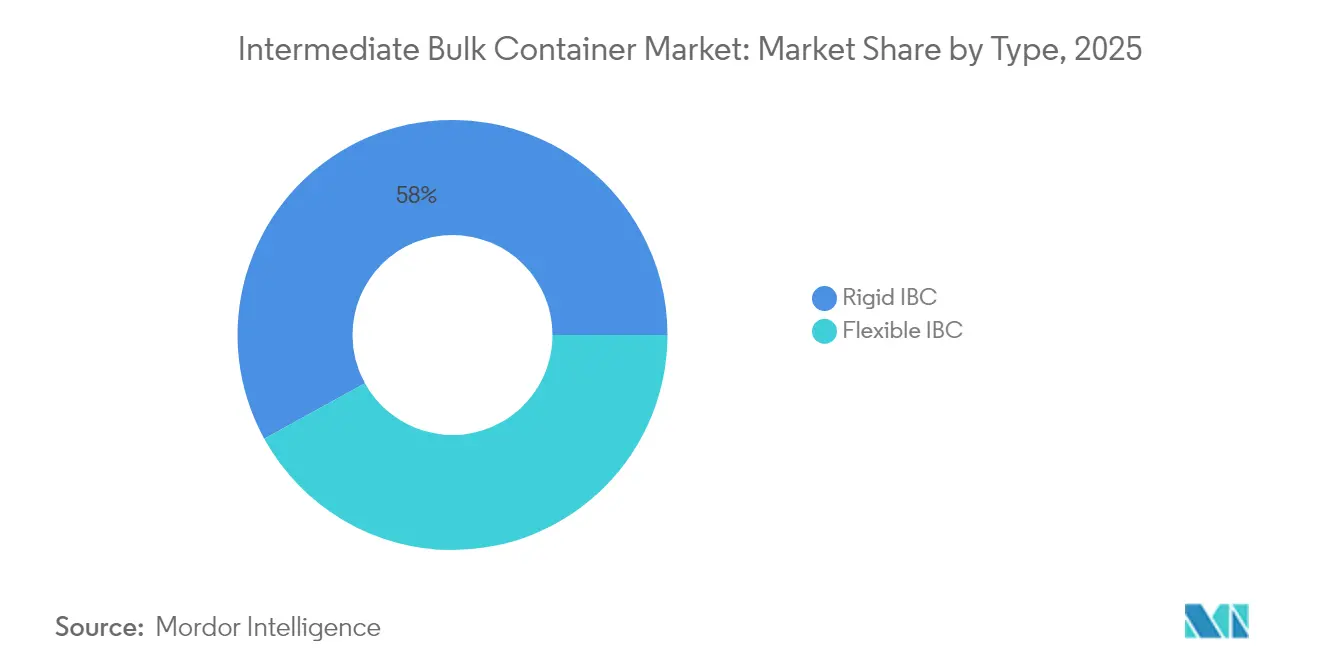
- By type, rigid variants held 58.02% of the IBC market share in 2025 while flexible designs are projected to expand at a 6.42% CAGR through 2031.
- By material, plastic commanded 39.10% of the 2025 IBC market size, whereas composite formats are forecast to grow at a 6.55% CAGR to 2031.
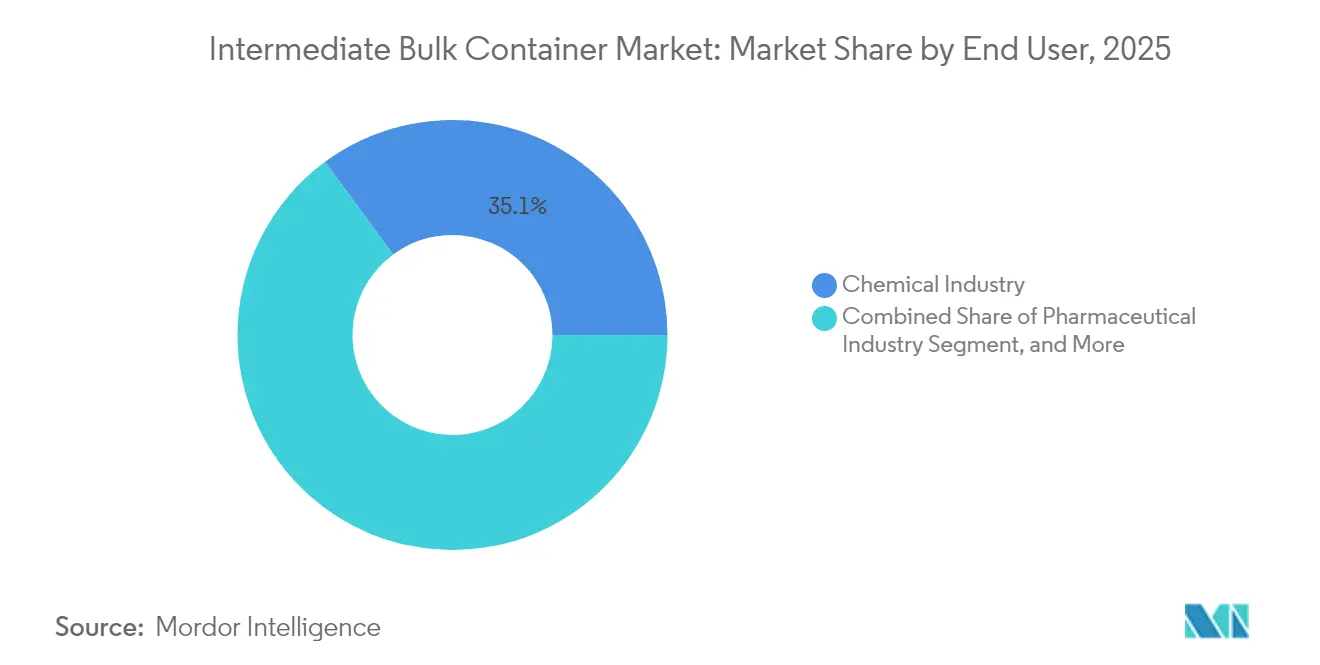
- By end user, chemical applications led with 35.10% revenue share in 2025; pharmaceutical uses are expected to register a 7.02% CAGR through 2031.
- By design, standard containers retained 40.95% of the IBC market size in 2025, yet smart IoT-integrated options are advancing at a 7.45% CAGR to 2031.
- By geography, Asia-Pacific accounted for 40.10% of the IBC market in 2025 and is set to grow at a 6.55% CAGR during the forecast horizon.
Note: Market size and forecast figures in this report are generated using Mordor Intelligence’s proprietary estimation framework, updated with the latest available data and insights as of 2026.
Market Trends and Insights
Drivers Impact Analysis of Intermediate Bulk Container Market*
| Driver | (~) % Impact on CAGR Forecast | Geographic Relevance | Impact Timeline |
|---|---|---|---|
| Growing export of IBC-packed products | +0.8% | Global, APAC and Europe | Medium term (2-4 years) |
| Expansion of chemical and pharmaceutical output | +1.2% | APAC core, spill-over to North America | Long term (≥4 years) |
| Shift toward reusable industrial packaging | +0.6% | Europe and North America, expanding to APAC | Long term (≥4 years) |
| Deployment of IoT-enabled smart IBCs | +0.7% | North America and Europe, early APAC | Short term (≤2 years) |
| Growth in food and beverage bulk logistics | +0.4% | Global, strong in emerging markets | Medium term (2-4 years) |
| Carbon-border taxes boosting circular packaging | +0.5% | Europe primary, trade partners | Medium term (2-4 years) |
| Source: Mordor Intelligence | |||
Expansion of Chemical and Pharmaceutical Output
Asia-Pacific lifted regional chemical capacity by 12% in 2024, sparking sustained container demand for raw materials and finished products. India’s surging biosimilar facilities and Vietnam’s new specialty complexes favor standardized composite IBCs that meet corrosive-resistance benchmarks. Continuous-manufacturing lines require closed-loop transfer systems, pushing adoption of smart sensors for sterility verification. Suppliers that integrate digital monitoring directly into container walls gain a pricing edge with pharmaceutical buyers. Over the long term, these production hubs are expected to underpin roughly one-third of incremental IBC market growth.
Growing Export of IBC-Packed Products
Cross-border flows of liquid chemicals reached USD 2.1 trillion in 2024, with exporters prioritizing weight-optimized flexible IBCs to curb freight costs. Temperature-controlled routes for active pharmaceutical ingredients now rely on insulated composite drums outfitted with data-logging patches that validate chain-of-custody. Extended voyage times between Asia and Europe further highlight the cost advantage of foldable empty returns. As maritime decarbonization drives carriers to scrutinize payload density, exporters adopting lighter, RFID-tagged liners are positioned to negotiate favorable rates, reinforcing the pull on the IBC market.
Deployment of IoT-Enabled “Smart” IBCs
Smart-container fleets rose 180% year-on-year in 2024, led by pharmaceutical compliance needs for real-time serialization. Embedded sensors now detect pressure variances within ±0.2 bar, instantly flagging seal failures. Cloud dashboards synthesize temperature, geolocation and vibration data, reducing spoilage by up to 25% through predictive interventions. Early movers in Europe and North America leverage these analytics to cut emergency maintenance costs, shortening payback to four reuse cycles. Demand is spreading to Asia as regional regulators mirror European traceability codes, sustaining a near-term boost to the IBC market.
Shift Toward Reusable Industrial Packaging
Fortune 500 sustainability pledges are stripping virgin plastic from purchase requisitions, accelerating multi-trip container strategies. Reusable IBCs deliver total cost savings of 40-60% across ten life cycles, outpacing single-use drums even before factoring in landfill levies. Europe’s 65% recycling mandate effective 2030 is catalyzing investment in composite shells with separable inner linings. Brands adopting closed-loop logistics stamp ESG credentials onto product labels, unlocking premiums in consumer chemicals and food ingredients. Reconditioning networks thus evolve from cost-play to strategic differentiator, reinforcing positive momentum in the IBC market.
Restraints Impact Analysis of Intermediate Bulk Container Market*
| Restraint | (~) % Impact on CAGR Forecast | Geographic Relevance | Impact Timeline |
|---|---|---|---|
| Rising use of reconditioned and rebottled IBCs | -0.9% | Global, cost-sensitive markets | Medium term (2-4 years) |
| Environmental scrutiny of plastic containers | -0.6% | Europe and North America, global spread | Long term (≥4 years) |
| EPA SCCAP rule raises stationary-source risk | -0.3% | United States | Short term (≤2 years) |
| Recycled HDPE supply-chain volatility | -0.4% | Global | Medium term (2-4 years) |
| Source: Mordor Intelligence | |||
Rising Use of Reconditioned and Rebottled IBCs
Specialized refurbishers now attain 95% performance parity with newly manufactured units, drawing cost-focused buyers toward lower-priced alternatives. Inflationary pressures during 2024 amplified this shift as chemical shippers deferred capex cycles. Regulatory bodies increasingly certify reconditioned containers for non-pharma materials, converting what once was a stopgap into a mainstream procurement option. New IBC sales therefore confront a structural headwind, particularly in commoditized segments of the IBC market.
Environmental Scrutiny of Plastic Containers
The EU Single-Use Plastics Directive, slated to include industrial formats by 2026, is intensifying demand for bio-based resins and recyclable metal-composite hybrids.[3]European Commission, “Single-Use Plastics Directive – Extension Proposal,” ec.europa.eu Consumer-facing conglomerates such as Nestlé now audit upstream bulk container packaging footprints, trimming purchase volumes of HDPE-dominant skus. Compliance adds certification costs and forces redesigns that erode margins on traditional plastic IBCs. As global brands ripple these standards through supplier networks, the restraint is expected to chip 0.6 percentage points from the IBC market’s growth trajectory. The metal IBC market share for liquids is expected to stay above 60% through 2031, underlining the container’s core purpose.
*Our forecasts treat driver/restraint impacts as directional, not additive. The impact forecasts reflect baseline growth, mix effects, and variable interactions.
Intermediate Bulk Container Market Segment Analysis
By Type:
Rigid Solutions Dominate Despite Flexible GrowthRigid containers retained 58.02% of the 2025 IBC market share, owing to high mechanical stability in chemical and pharmaceutical filling lines. Standardized pallet footprints allow high-speed robotic handling, an asset in 24/7 production environments. The IBC market size for flexible variants is projected to rise at a 6.42% CAGR, underpinned by 40% empty-return space savings that translate into lower freight emissions. Food ingredient shippers increasingly favor these liners for non-hazardous fluids, though IoT retrofits remain less straightforward than with rigid shells. Major producers are adding flexible capacity in Southeast Asia, signaling a long-term rebalancing of the IBC market.
Rigid adoption persists where UN Group II and III classifications prevail, such as acids and agrochemicals. Integrated dip-tube outlets boost line throughput by 12%, supporting just-in-time delivery models. Flexible designs, conversely, are carving niches in flavor concentrates and plant-based oils where contamination risk is lower and disposal simplicity ranks high. As sensors shrink and adhesive power supplies mature, the technology gap will likely narrow, triggering faster smart-feature infusion into flexible IBC market offerings.


By Material:
Plastic Leadership Faces Composite ChallengePlastic held 39.10% of the IBC market share in 2025, leveraging cost-efficient blow-molding lines and broad chemical compatibility. Composite shells, however, are advancing at a 6.55% CAGR through 2031 as shippers prioritize corrosion resistance against high-purity solvents. Recyclable, layered structures allow inner HDPE bottles to be replaced independently of outer metal cages, extending service life by 25%. Volatility in recycled HDPE prices widens the relative attractiveness of glass-fiber reinforced polypropylene, positioning composites to chip away at the established plastic IBC market.
Metal drums still dominate extreme-temperature and high-pressure applications, while fiberboard attracts organic food exporters requiring biodegradable containers. Pharmaceutical buyers remain cautious, demanding USP-class formulations that plastics meet more readily, yet increasing regulatory emphasis on carbon disclosures could tilt preferences toward lighter composites over the forecast window. Material innovators that provide cradle-to-cradle certification are likely to secure premium contracts in the evolving IBC market.
By End User:
Chemical Dominance Meets Pharmaceutical DynamismChemical producers accounted for 35.10% of 2025 revenue, reflecting entrenched use of standardized 1,000-liter units for acids, solvents and agricultural inputs. Predictable rotation cycles favor rigid plastic and metal variants with proven performance in closed-loop circuits. Pharmaceutical buyers, while a smaller base, underpin the fastest 7.02% CAGR thanks to expanded biosimilar pipelines and serialization mandates. Smart IBC adoption accelerates here, as real-time logging supports Good Distribution Practice validation.
Food and beverage processors expand at moderate pace, lured by bulk-ingredient efficiency and sanitary liners certified to FDA 21 CFR standards. Agriculture emerges as an incremental growth pocket with precision-application fertilizers demanding calibrated dosing systems. Logistics providers now bundle cleaning, inspection and telemetry services, deepening ecosystem stickiness and broadening revenue beyond the sale of physical containers, which in turn elevates service content in the IBC market.
By Design:
Standard Solutions Yield to Smart InnovationStandard configurations commanded 40.95% of the IBC market size in 2025 since they meet baseline requirements at the lowest unit cost. Nevertheless, IoT-integrated variants posting a 7.45% CAGR signal a shift toward data-rich value propositions. Sensor arrays sampling temperature every 30 seconds prevent thermal excursions in vaccines, securing regulatory clearance from both FDA and EMA auditors. Collapsible formats trim warehouse footprints by 60% when empty, ideal for urban micro-fulfillment nodes.
Heated coils embedded in stainless-steel walls maintain viscous materials above solidification thresholds, enabling just-in-time processing of fats and resins. Market entrants focusing on retrofit sensor caps allow legacy fleets to digitize without wholesale replacement, a transitional pathway that accelerates smart-fleet penetration. As these advanced designs mature, their aggregated data outputs will create secondary analytics revenues, bolstering margins within the IBC market.
Geography Analysis
APAC Intermediate Bulk Container Market
Asia-Pacific dominated the IBC market with 40.10% share in 2025 and is projected to expand at 6.55% CAGR through 2031. China’s USD 1.7 trillion chemical output and India’s 15% export surge in pharmaceuticals underpin continuous container demand across raw-material and finished-drug logistics. Local governments offer tax incentives for reusable packaging assets, lowering payback periods for smart composite units. Emerging ASEAN clusters, notably Vietnam and Thailand, are installing new polymer and aromatic complexes, each including dedicated IBC cleaning bays to sustain multi-trip schemes.
Europe Intermediate Bulk Container Market
Europe showcases nuanced, regulation-driven demand that skews toward high-end, circular-compliant solutions. German and French pharma firms top global rankings in sensor-equipped fleets, leveraging Industry 4.0 frameworks for predictive maintenance. EU Packaging and Packaging Waste rules drive 65% recycling targets by 2030, accelerating adoption of detachable liner systems. The regulatory-first environment enables suppliers to command 10-15% price premiums for certified low-carbon IBC market offerings.
North America Intermediate Bulk Container Market
North America centers on quality-critical pharmaceutical and specialty chemical sectors. The United States chemical output of USD 553 billion in 2024 translates into robust baseline volumes, especially for UN Class 8 corrosives moved via rail and drayage. Mexico’s near-shoring wave is spurring fresh demand for rigid composite containers as new resin plants come online. Mature road and rail networks facilitate asset-tracking platforms that optimize fleet rotation, reinforcing digital-service revenue within the regional IBC market.

Regulatory Landscape
Intermediate bulk containers (IBCs) used for hazardous goods transport are governed by the UN Recommendations on the Transport of Dangerous Goods (Model Regulations, Revision 23), which set expectations around performance, marking, and approval that most national rules align with. In the United States, UN-standardized IBC requirements are codified in 49 CFR Part 178, Subpart N (including performance testing requirements such as those in 49 CFR 178.706), while Canada incorporates CAN/CGSB-43.146 into its Transportation of Dangerous Goods framework for the design, manufacture, and use of IBCs across multiple dangerous goods classes.
Periodic inspection and testing obligations, typically on 2.5-year and 5-year cycles and after repair or remanufacture, increase the importance of authorized service providers and documented quality systems for day-to-day compliance. Regulatory change also comes through targeted amendments, such as the US Department of Transportation update to rigid plastic IBC standards in April 2024, reinforcing that suppliers and reconditioners need current test procedures, documentation, and production controls aligned with UN and ISO-based quality guidance (including ISO 16106 and ISO 9001-aligned practices).
Value Chain Analysis
The IBC value chain begins with feedstock and component supply, including HDPE for inner bottles, steel for cages and bases, and stainless steel such as 304/316L for higher-spec chemical compatibility and cleanability. It then moves into container conversion (blow molding, cage fabrication, and final assembly with closures and valves), where dangerous goods performance requirements can be a gating factor for specific end uses.
Downstream, a meaningful share of lifecycle value is concentrated in pooling, collection, washing, inspection, repair, and reconditioning networks. Trade bodies such as RIBCA, FIBCA, and EFIBCA help shape operational guidance and common practices. Regulatory requirements tied to UN transport rules and regional frameworks, including US DOT and European ADR, drive recurring demand for documented testing, marking, and traceable service histories. In Europe, packaging waste rules (Regulation (EU) 2025/40) also influence design choices toward easier separability and recyclability, increasing the role of material selection and end-of-life partners across the chain.
Competitive Landscape
The market displays moderate concentration, with Greif, Mauser Packaging Solutions and Schuetz anchoring global share through extensive manufacturing and reconditioning footprints. Their vertical integration, spanning resin compounding to end-of-life recycling, sharpens cost control and speeds response to regional spikes in demand. Greif’s USD 576 million Ipackchem acquisition in 2024 augmented flexible-container capacity and widened specialty-chemical customer reach. Mauser’s Pune facility launch enhances South Asian supply resilience, aligning with pharmaceutical cluster growth.
Technology differentiation is intensifying. Schuetz’s composite innovations pair corrosion resistance with component separability, boosting recyclability to 90%. Schoeller Allibert’s Smartlink platform couples sensor hardware with SaaS dashboards, monetizing data subscriptions and driving customer stickiness. Disruptors offering retrofit IoT kits broaden access for mid-tier fleets, narrowing technology gaps. Success increasingly hinges on pairing durable containers with predictive analytics and efficient reconditioning networks, securing recurring revenue and elevating service intensity in the IBC market.
Intermediate Bulk Container Industry Leaders
Greif Inc.
Bulk Lift International LLC
Global-Pak LLC
FlexiTuff Ventures International Ltd.
Amcor plc
- *Disclaimer: Major Players sorted in no particular order
Intermediate Bulk Container Market Companies Covered in this Report
- Greif Inc.
- Bulk Lift International LLC
- International Paper Company (DS Smith)
- Global-Pak LLC
- FlexiTuff Ventures International Ltd.
- LC Packaging International BV
- Plymouth Industries LLC
- Mauser Packaging Solutions Holding Company
- Schoeller Allibert Group BV
- Schuetz GmbH and Co. KGaA
- Amcor plc
- Mondi plc
- Time Technoplast Ltd.
- Snyder Industries LLC
- Hoover Circular Solutions Inc.
- Schfer Werke GmbH
- Thielmann Portinox Spain S.A.
- Goodpack Pte. Ltd.
- Horen Group Co. Ltd.
- Myers Industries Inc.

Market Opportunities and Future Outlook
Compliance-led traceability and reuse management is creating room for digital service layers, including asset identity, rotation records, reconditioning certificates, and condition monitoring, alongside container sales. This shift is particularly relevant as Europe applies Regulation (EU) 2025/40, with applicability from August 2026. As a result, suppliers can pair smart or trackable IBC configurations with reconditioning documentation, aligning with the report trend of IoT-enabled containers gaining traction in chemical and pharmaceutical supply chains.
Capacity localization near major chemical sites is another investable pathway, supported by recent expansion announcements. Schuetz’s March 2026 agreement with BASF covers a highly automated IBC production and storage facility at BASF Ludwigshafen, with construction scheduled for Q3 2026. At the same time, output additions in high-growth consumption corridors can improve near-term availability for rigid and composite formats used in chemicals and pharma, such as Time Technoplasts March 2026 completion of a Phase I brownfield expansion at Silvassa to reach annual capacity of 150,000 IBC units.
Recent Industry Developments in Intermediate Bulk Container Market
- March 2026: Schuetz announced an agreement with BASF to construct a highly automated IBC production and storage facility at BASF Ludwigshafen, with construction scheduled for Q3 2026. The project brings container manufacturing and inventory closer to a major chemical complex, improving supply assurance for high-throughput users and reducing logistics friction for returnable packaging flows.
- May 2025: Global-Pak partnered with Worry Free Plastics to integrate a regenerative microbial consumption agent into bulk bags and liners. The collaboration targets improved sustainability narratives for bulk packaging buyers and adds differentiation in bids where end-of-life handling and material footprint are considered alongside cost.
- September 2024: Greif opened a new IBC manufacturing facility in Pasir Gudang, Johor, Malaysia, adding blow molding and cage line capabilities. The expansion strengthens regional supply coverage for Asia-Pacific chemical and industrial customers and supports shorter lead times for rigid IBC configurations.


Intermediate Bulk Container Market Report Scope and Research Methodology
Market Definition and Coverage
For this study, the market covers intermediate bulk containers (IBCs) used to store and transport bulk liquids and solids in industrial supply chains, with demand captured across major end-use industries and regions.
Scope exclusions: Small consumer packaging formats (such as bottles, jerry cans, and pails) and non-IBC bulk systems (such as large ISO tanks and fixed silos) are excluded from this market sizing.
Segments Covered in This Report
- By Type
- Rigid IBC
- Flexible IBC
- By Material
- Plastic IBC
- Metal IBC
- Composite IBC
- Fiberboard IBC
- By End User
- Chemical Industry
- Pharmaceutical Industry
- Food and Beverage Industry
- Agriculture
- Transport and Logistics
- Other End Users
- By Design
- Standard IBC
- Collapsible / Foldable IBC
- Heated IBC
- Smart / IoT-Enabled IBC
- By Geography
- North America
- United States
- Canada
- Mexico
- South America
- Brazil
- Argentina
- Rest of South America
- Europe
- United Kingdom
- Germany
- France
- Spain
- Italy
- Rest of Europe
- Asia-Pacific
- China
- India
- Japan
- Australia
- South Korea
- Rest of Asia-Pacific
- Middle East and Africa
- Middle East
- Saudi Arabia
- United Arab Emirates
- Turkey
- Rest of Middle East
- Africa
- South Africa
- Kenya
- Rest of Africa
- Middle East
- North America
Data Sources, Market Sizing, and Validation
Desk Research
Desk work started with mapping the IBC value chain and the main demand pool, then linking it to measurable signals that move IBC consumption by region. We relied on public reference points such as UN recommendations on dangerous goods packaging, US Census Bureau trade statistics, Eurostat external trade tables, and UN Comtrade to understand cross-border flows of relevant chemicals and packaged industrial goods that commonly use IBCs.
To keep assumptions grounded, we also reviewed sources such as the US EPA and ECHA for packaging and handling context, along with peer-reviewed packaging and logistics literature that covers reconditioning, reuse cycles, and material shifts. Company annual reports, investor presentations, and reputable press were used to confirm product mix language and capacity expansions. Where needed, paid subscriptions for company financials and intelligence, news and financials, patent databases, and shipment-level import export data were used to speed up fact checks and fill gaps. These examples are not exhaustive, and many other sources were reviewed for data collection, validation, and clarification.
Primary Interviews and Surveys
Primary work focused on validating how IBC demand is created and purchased across chemicals, food and beverage, pharmaceuticals, and logistics users, and then pressure-testing key inputs like replacement cycles and reconditioning rates. We also spoke with a mix of manufacturers, distributors, reconditioners, and large end users across APAC, EMEA, and the Americas so regional differences in regulations, reuse behavior, and pricing could be reflected in the final model.
Distribution of primary research fieldwork respondents
| Company type | Respondent position | Region |
|---|---|---|
| Top tier: 35% | CXOs: 16% | APAC: 45% |
| Mid tier: 44% | Functional/Unit leaders: 37% | EMEA: 29% |
| Smaller Players: 21% | Managers: 47% | Americas: 26% |
Market-Sizing & Forecasting
Sizing was built using top-down and bottom-up logic. The top-down view reconstructs the demand pool by linking industrial output and trade patterns in key IBC-using sectors to packaging intensity, then allocating the resulting need across major regions before consolidating to a global value.
To keep the model practical, a small set of repeatable inputs was used and then stress-tested with interview feedback, including chemical and pharmaceutical output trends, export import momentum in industrial goods, installed base replacement cycles, reconditioning and reuse share, and average selling price movement by common IBC types and materials. Bottom-up checks were then applied selectively using sampled supplier revenue patterns, channel feedback on volume direction, and simple ASP times volume cross-checks to confirm totals and to adjust for areas where public data is thin.
Forecasting relies mainly on scenario analysis, where demand drivers like industrial production, trade recovery, and reuse penetration are varied within realistic bands, and then aligned to the consensus ranges shared by primary respondents. Where a data point could not be observed directly, we filled the gap using regional proxies and then rechecked the impact on totals so one missing input did not distort the final number.
Data Validation & Update Cycle
Validation was done through multiple passes that compare model outputs against independent signals, such as end-use production direction, trade flow changes, and observed pricing movement, before numbers are signed off. Outliers are flagged early, and when a variance cannot be explained by a clear factor like a short-term price swing or a demand shock, we re-contact relevant participants to confirm what changed.
Each report is refreshed annually, with interim updates triggered when material events occur (for example, new regulatory shifts, major capacity additions, or sharp raw material price moves). Before delivery, the full model is reviewed again and the latest public indicators are pulled through so clients receive an updated view rather than an older snapshot.
Mordor Intelligence's Intermediate Bulk Container Market Size Measured Against Other Published Estimates
Published IBC market numbers often differ because the included product set, the assumed reuse cycle, and the way pricing is converted into USD can vary from one estimate to another. Differences also show up when some sources anchor the market to shipments, while others anchor it to end-use consumption.
ISO tank containers sit outside Mordor Intelligence's scope for this report, and that single exclusion can move totals meaningfully in estimates that treat bulk liquid logistics equipment as one combined pool. Beyond scope, gaps typically come from how reconditioning is handled (counting only new IBC sales versus counting reuse turns), how average prices are trended across plastic, composite, and metal formats, and how often assumptions are refreshed when industrial production and trade data shift.
Benchmark comparison
| Source | Market Size | Gaps in Research Methodology |
|---|---|---|
| Mordor Intelligence | USD 11.97 B (2026) | |
| Trade Publisher A | USD 7.35 B (2024) | Uses an earlier base year and a narrower value pool that appears closer to new container sales only, with limited visibility on reconditioning turns and mixed treatment of rigid versus flexible formats. |
| Press Release B | USD 9.56 B (2023) | Anchors the starting value to a different year and may blend adjacent bulk packaging equipment in some regions, while applying a single global price trend that does not fully reflect material specific ASP movement. |
The spread in published values mainly reflects what gets counted as an IBC, how reuse and reconditioning are translated into market value, and the chosen base year for currency conversion. By keeping the scope tied to IBC formats and then validating key levers like replacement rates and ASP progression with field inputs, the resulting estimate stays traceable to clear demand drivers and can be reproduced with the same steps in future updates.


Key Questions Answered in the Report
How large is the IBC market in 2026?
The IBC market size is USD 11.91 billion in 2026 and is projected to reach USD 16.02 billion by 2031.
Which region leads adoption of smart IBCs?
Europe and North America currently lead smart-container deployment, with Asia-Pacific rapidly catching up.
What is the fastest-growing IBC material type?
Composite containers are forecast to grow at a 6.55% CAGR, outpacing plastic and metal formats.
Why are pharmaceutical companies investing in IoT-enabled IBCs?
Real-time monitoring ensures cold-chain integrity and supports regulatory serialization mandates, reducing spoilage and compliance risk.
How do reuse programs impact total packaging cost?
Reusable IBCs deliver 40-60% lifetime savings versus single-use drums across typical ten-cycle service lives.
What is driving flexible IBC demand?
Exporters favor flexible designs for their 40% empty-return space savings, which lower freight costs and emissions.
Page last updated on:


 Your data is secure and never sold or shared.


