
Intelligent Virtual Assistant (IVA) Market Size and Share
Market Overview
| Study Period | 2020 - 2031 |
|---|---|
| Market Size (2026) | USD 25.7 Billion |
| Market Size (2031) | USD 99.61 Billion |
| Growth Rate (2026 - 2031) | 31.12 % |
| Fastest Growing Market | Asia-Pacific |
| Largest Market | North America |
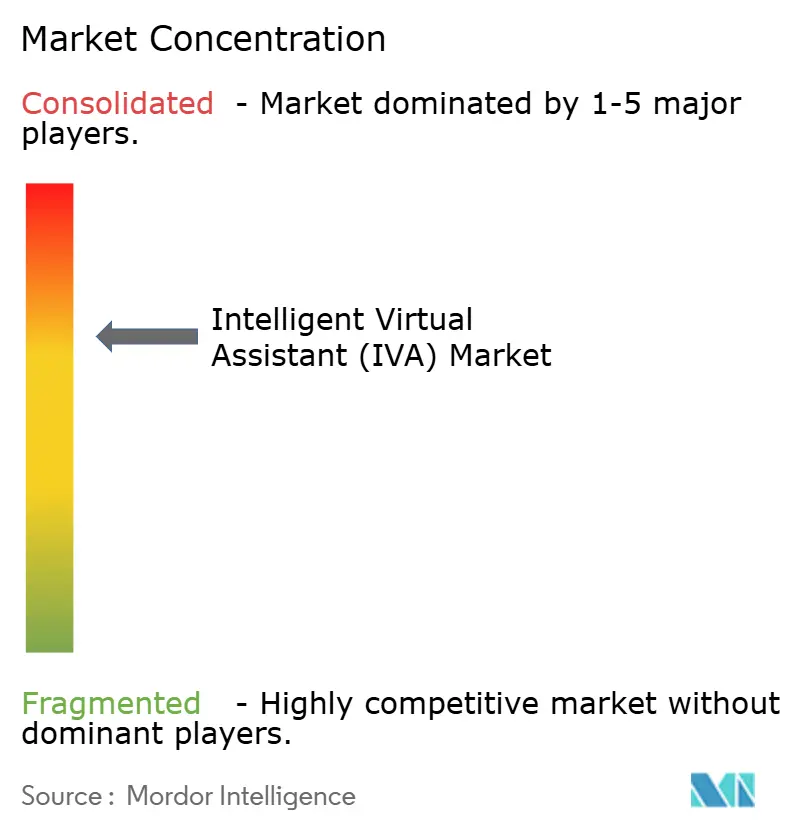
| Market Concentration | Medium |
Major Players *Disclaimer: Major Players sorted in no particular order Image © Mordor Intelligence. Reuse requires attribution under CC BY 4.0. | |
Intelligent Virtual Assistant (IVA) Market Analysis by Mordor Intelligence
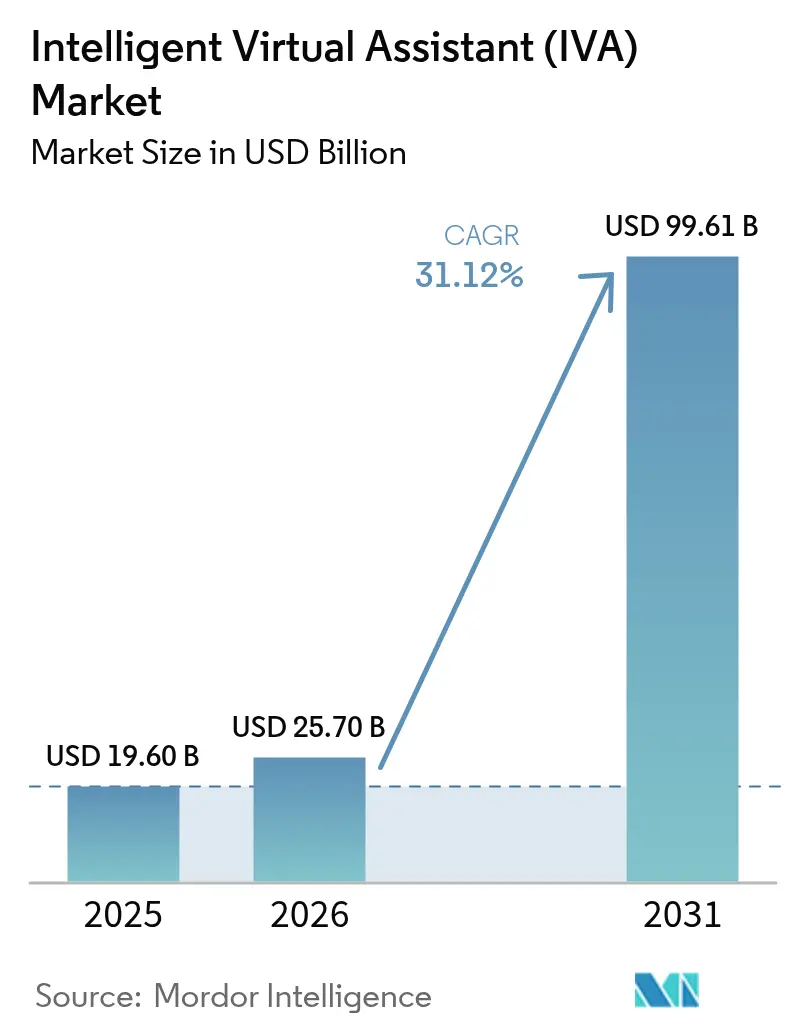
The intelligent virtual assistant market size is expected to grow from USD 19.60 billion in 2025 to USD 25.7 billion in 2026 and is forecast to reach USD 99.61 billion by 2031 at 31.12% CAGR over 2026-2031. Multilingual large-language models, on-device inference enabled by specialized AI chips that retail for about USD 40,000 per unit, and corporate pressure to curb expanding cloud costs are the primary forces behind this rapid expansion. Enterprises continue to invest because generative AI deployments are demonstrating clear savings; a major travel company, for example, reports USD 10 million in annual cost reductions after introducing an IVA-led self-service channel. Edge and on-premise options that avoid recurring hyperscale fees are moving up the priority list, even though cloud remains dominant. The momentum is equally visible in consumer hardware, as the popularity of smart speakers and in-car assistants reshapes expectations for always-on conversational services.
Key Report Takeaways
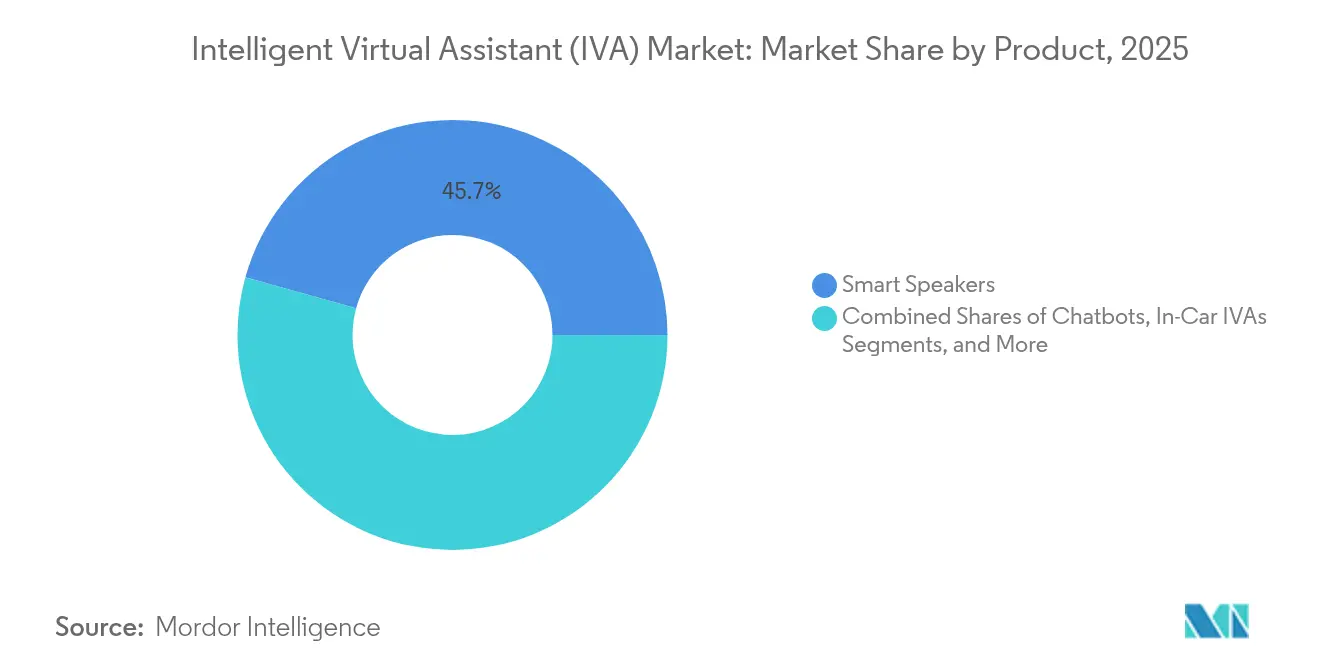
- By product, smart speakers led with 45.68% revenue share in 2025, while in-car IVAs are advancing at a 32.58% CAGR through 2031.
- By deployment mode, cloud held 67.35% of the intelligent virtual assistant market share in 2025; on-premise and edge are expanding at 33.72% CAGR through 2031.
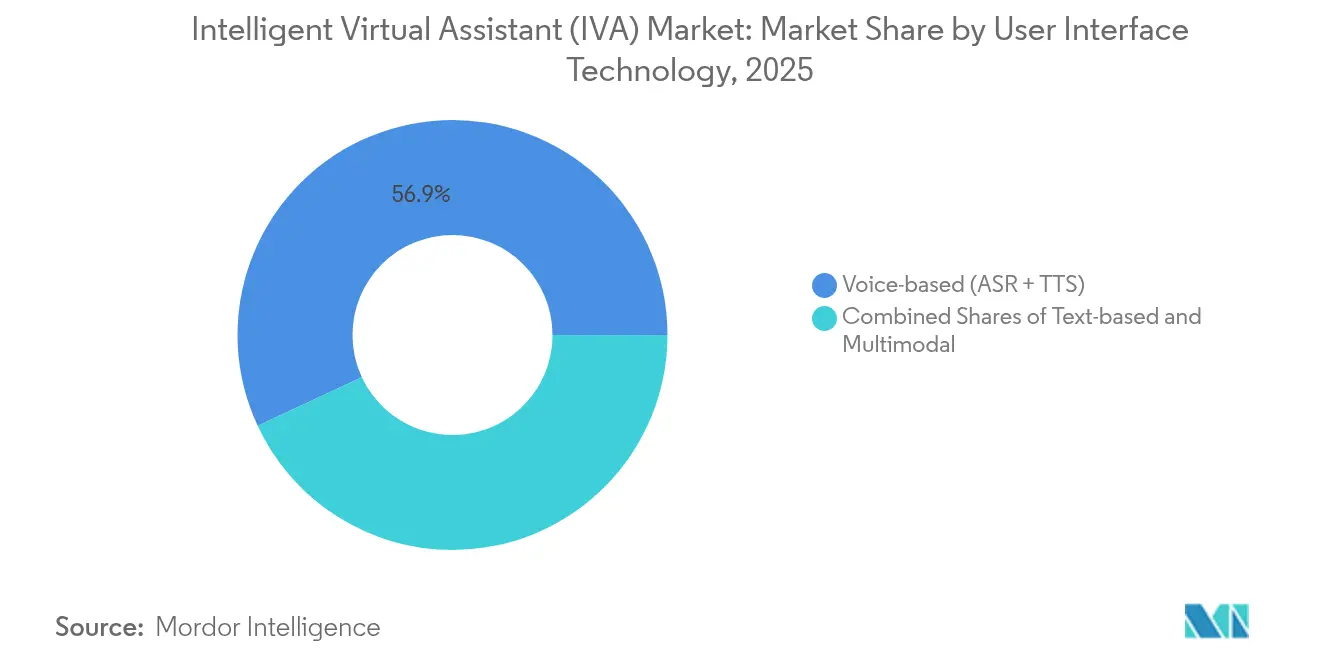
- By user-interface technology, voice-based systems commanded 56.94% share in 2025; multimodal voice-visual solutions are set to grow at 32.86% CAGR to 2031.
- By end-user, retail and eCommerce captured 24.05% of the intelligent virtual assistant market size in 2025, whereas healthcare is projected to rise at 32.74% CAGR between 2026-2031.
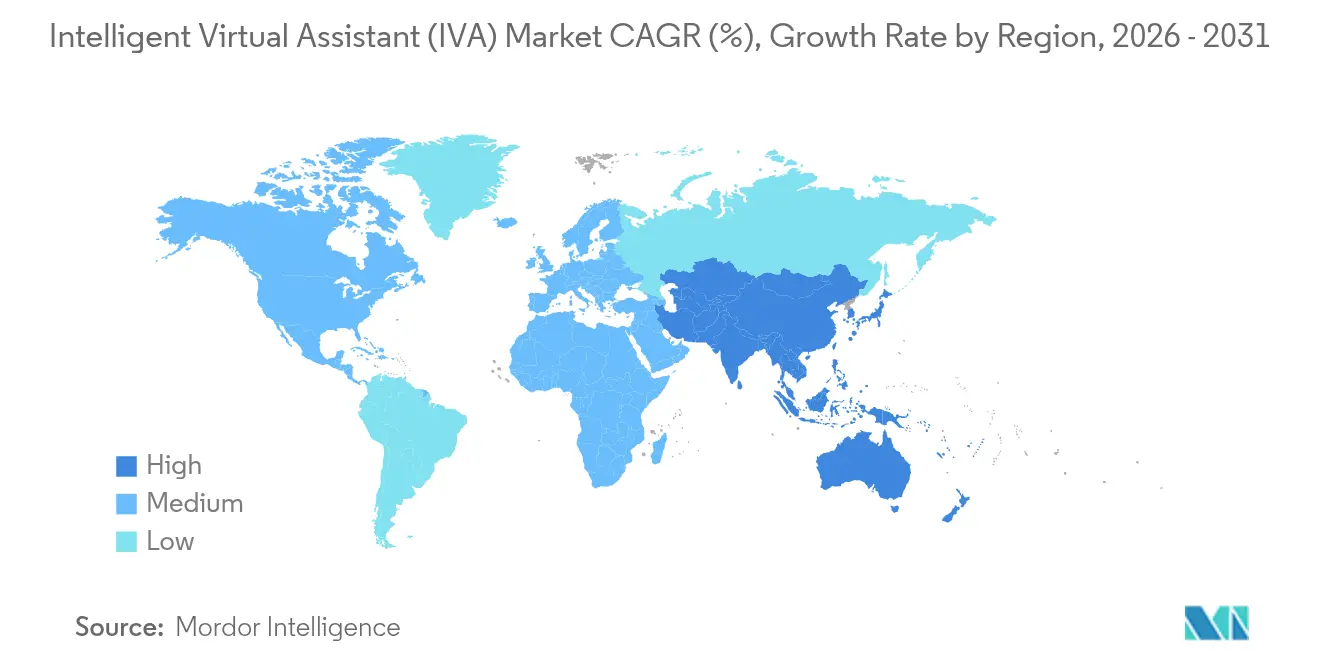
- By geography, North America accounted for 36.55% market share in 2025; Asia Pacific is expected to post the fastest 34.05% CAGR through 2031.
Note: Market size and forecast figures in this report are generated using Mordor Intelligence’s proprietary estimation framework, updated with the latest available data and insights as of 2026.
Market Trends and Insights
Drivers Impact Analysis of Intelligent Virtual Assistant (IVA) Market*
| Driver | (~) (%) Impact on CAGR Forecast | Geographic Relevance | Impact Timeline |
|---|---|---|---|
| Rising adoption of omnichannel customer-service chatbots | +8.5% | Global, strongest in North America and Europe | Short term (≤ 2 years) |
| Proliferation of smart speakers and IoT voice end-points | +7.2% | North America and Asia Pacific, spreading to Europe | Medium term (2–4 years) |
| Breakthroughs in multilingual large-language-model NLP | +6.8% | Global, notable in Asia Pacific and Europe | Medium term (2–4 years) |
| Contact-center cost-containment pressure | +5.1% | Worldwide, highest in North America and Europe | Short term (≤ 2 years) |
| Emotion-aware IVA uptake in elder-care and digital therapeutics | +3.4% | North America and Europe, reaching Asia Pacific | Long term (≥ 4 years) |
| Accessibility mandates for public-sector digital services | +2.8% | Europe and North America, global spillover | Medium term (2–4 years) |
| Source: Mordor Intelligence | |||
Rising Adoption of Omnichannel Customer-Service Chatbots
Global banks expect to invest USD 9.4 billion in chatbot technology by 2025, a sign of how strongly cost-containment needs align with 24/7 service expectations.[1]IBM Corp., “Camping World boosts engagement 40% with virtual assistant,” ibm.com Autonomous resolution rates of 80-90% are increasingly common, and productivity gains reaching 40% have been logged by early banking adopters. Retailers cite engagement lifts of 40% when text, voice, and visual channels are fused into a single flow, creating smooth hand-offs to human agents when context demands. Memory-based personalization now preserves conversation history across devices, allowing customers to resume interactions without repetition. The result is higher customer-satisfaction scores alongside measurable savings in contact-center workloads.
Proliferation of Smart Speakers and IoT Voice End-Points
Automotive OEMs tap voice platforms from Cerence, Microsoft, and NVIDIA to add ChatGPT-style services directly to infotainment stacks.[2]Cerence Inc., “Volkswagen rolls out Chat GPT-powered assistant,” cerence.comVolkswagen’s European models already ship with a cloud-updated assistant that supports five languages. Beyond cars, appliance makers and wearable brands embed local speech recognition to protect privacy and cut latency. Driver surveys find that 77% would choose in-vehicle voice control when advanced features are available. As vendors port the same core models to embedded silicon, the intelligent virtual assistant market gains new daily-use entry points inside homes, cars, and industrial settings.
Breakthroughs in Multilingual Large-Language-Model NLP
Open-source models such as Babel cover languages spoken by more than 90% of the global population, lowering barriers for enterprises that once needed separate models for every geography. Healthcare providers, for instance, now deploy the same virtual nurse across 25 languages without retraining. Retrieval-augmented approaches help lift accuracy for low-resource dialects, protecting cultural nuances and enabling IVA rollout in Southeast Asia, Africa, and Latin America. As sentiment and intent detection improve, assistants can tailor tone, etiquette, and even humor to local norms, strengthening user trust.
Contact-Center Cost-Containment Pressure
A leading U.S. travel company shifted containment rates from 10% to 50% in one month, yielding USD 10 million in annual savings. AXA reduced average handle time by more than 20% after deploying a hybrid IVR-IVA workflow. Wealth-management firms record USD 6.7 million savings by automating 400 frequent inquiries while boosting customer-experience scores. Predictive routing and proactive prompts are next on the roadmap, aiming to deflect simple tickets before they reach agents. CFOs therefore see IVAs not only as a CX tool but also as a direct lever on service-line margins.
Restraints Impact Analysis of Intelligent Virtual Assistant (IVA) Market*
| Restraint | (~) (%) Impact on CAGR Forecast | Geographic Relevance | Impact Timeline |
|---|---|---|---|
| Persistent privacy and data-security concerns | -4.2% | Global, heightened in Europe and North America | Medium term (2–4 years) |
| Customer preference for human agents in complex queries | -3.8% | Worldwide, cultural variance in acceptance | Short term (≤ 2 years) |
| Regulatory scrutiny on AI explainability and dark-patterns | -2.9% | Europe in lead, North America and Asia Pacific following | Long term (≥ 4 years) |
| Hallucination-driven brand-reputation risk | -2.1% | Global, acute in regulated industries | Medium term (2–4 years) |
| Source: Mordor Intelligence | |||
Persistent Privacy and Data-Security Concerns
The EU AI Act’s privacy-preserving clauses force suppliers to demonstrate data-minimization and encryption by design.[3]European Union, “Regulation on Artificial Intelligence,” eur-lex.europa.eu In healthcare, U.S. ONC rules demand transparent decision logs for predictive algorithms. Financial institutions add traceable pipelines and differential-privacy techniques, but those investments raise project costs and lengthen deployment cycles. Many chiefs therefore favor on-premise stacks that keep all customer utterances in situ, reporting cost reductions of up to 80% versus equivalent cloud bills while satisfying sovereignty rules.
Regulatory Scrutiny on AI Explainability and Dark-Patterns
High-risk classifications under the EU AI Act require technical documentation that captures model logic, training data lineage, and mitigation procedures, a departure from earlier black-box approaches. The U.S. NIST AI Risk Management Framework, now referenced in several state laws, prescribes independent auditing of algorithmic bias. These obligations slow product cycles and push vendors toward inherently interpretable architectures. Firms exporting to multiple jurisdictions must navigate overlapping rulesets, adding legal review overhead that can delay intelligent virtual assistant market launches by quarters.
*Our forecasts treat driver/restraint impacts as directional, not additive. The impact forecasts reflect baseline growth, mix effects, and variable interactions.
Intelligent Virtual Assistant (IVA) Market Segment Analysis
By Product:
Smart Speakers Lead Despite In-Car SurgeSmart speakers generated 45.68% of 2025 revenue, underscoring the sizeable installed base that continues to expand through bundling with music or video services. Although growth moderates in mature markets, vendors are upselling premium tiers that feature high-fidelity microphones and local language-model inference to reduce cloud calls. At the same time, in-car assistants are on track to post 32.58% CAGR through 2031, the fastest among hardware categories. Automakers such as Volkswagen and Renault use white-label offerings from Cerence to deliver conversational navigation, climate control, and e-commerce services on the road.
Wearable and embedded IVA modules for AR headsets and industrial scanners supply a fresh entry path, enabling voice commands that free workers’ hands in logistics and field maintenance. These devices often combine voice with gaze, gesture, or haptic feedback, elevating user ergonomics. The intelligent virtual assistant market now spans a continuum from stationary speakers to fully mobile endpoints, and suppliers are tailoring neural-network footprints to the computational limits of each form factor.


By Deployment Mode:
Cloud Dominance Meets Edge Computing SurgeCloud deployment still accounts for 67.35% of current spend because of easy scaling, model updates, and integration with enterprise software. Yet, cost predictability and data-localization laws are driving a decisive turn to on-prem and edge deployments that are growing 33.72% annually. Enterprises deploying generative AI chips on site report overall inference expenses as low as one-fifth of comparable cloud bills. The intelligent virtual assistant market size for on-prem projects is forecast to expand sharply as regulated verticals move sensitive voice logs inside the firewall.
Edge-native IVAs support real-time workloads in automotive, aerospace, and healthcare devices where sub-100-millisecond latency is mandatory. Suppliers are now shipping neural-processing-unit cores that host quantized LLMs with less than 8 GB of memory. This specialization lowers energy draw while keeping conversational context intact, a key requirement for uninterrupted driving or surgical assistance scenarios.
By User Interface Technology:
Voice Leadership with Multimodal AccelerationVoice remains the primary gateway, comprising 56.94% share in 2025 thanks to decades of ASR and TTS refinement. However, multimodal systems that merge speech with visual or gestural cues are growing at 32.86% CAGR. Automotive avatars that offer human-like eye contact and facial expressions demonstrate how visual feedback raises perceived empathy. In mixed-reality headsets, integrating gaze tracking with speech resolves pronoun ambiguity, improving task completion times by 14% in pilot studies.
Text interfaces continue to serve back-office use cases where searchable transcripts and audit trails are obligatory, notably in banking and insurance. Cross-channel orchestration platforms now synchronize voice, chat, and video conversations using a single context store, ensuring that customer identity, intent, and preferences flow across modalities without data loss.
By End-User:
Retail Maturity Contrasts Healthcare AccelerationRetail and eCommerce held 24.05% of spending in 2025 as merchants rout routine inquiries, delivery tracking, and return processing to chatbots. KPI dashboards confirm 40% faster customer-journey completion times when IVAs triage incoming queries before escalation to agents. Healthcare, though smaller today, is slated to grow at 32.74% CAGR, buoyed by digital-therapeutics adherence reminders, remote patient monitoring, and elder-care companionship services. Hospitals deploying virtual nurses have cut readmissions by 25% while raising patient-engagement metrics.
Financial services adoption also accelerates because voice biometrics short-circuit identity verification and comply with strong-authentication directives. Telecom operators lean on IVAs to manage peak call volumes, with 40% of CX leaders budgeting above-inflation increases for conversational AI to guard against churn rates. Travel brands adapt the technology into concierge-style helpers that manage itinerary changes through simple voice prompts.
Geography Analysis
North America Intelligent Virtual Assistant (IVA) Market
North America holds 36.55% share on the strength of early enterprise investment, a deep venture capital pool, and a maturing vendor ecosystem. State-level laws in Utah, Colorado, and California emphasize transparency, while the federal NIST framework offers a common risk-management vocabulary. Healthcare IVAs must log explainability evidence to meet ONC standards, prompting providers to choose platforms that expose full decision traces. Canada’s accessibility mandate EN 301 549:2024 further cements demand for inclusive voice technologies that work for users with disabilities. The region’s R&D capability combined with a robust compliance culture maintains a lead in commercial deployments.
APAC Intelligent Virtual Assistant (IVA) Market
Asia Pacific is the fastest-expanding region at 34.05% CAGR. Government AI strategies, such as China’s national roadmap and Singapore’s SGD 1 billion allocation, underwrite talent development and pilot programs. Conversational AI adoption in India’s banking arena demonstrates how multilingual IVAs extend branch reach at lower cost. Japanese automakers push in-car assistants as brand differentiators, integrating edge AI chips to overcome patchy cellular coverage. Linguistic diversity remains a hurdle, but recent multilingual LLM breakthroughs shrink development timelines and open the intelligent virtual assistant market to mid-tier enterprises.
Europe Intelligent Virtual Assistant (IVA) Market
Europe occupies a pivotal role, balancing innovation with stringent governance. The EU AI Act imposes harmonized rules that cover classification, documentation, and human oversight, nudging suppliers toward transparent model architectures. Automotive firms collaborate with AI specialists to comply with both functional safety norms and new explainability clauses. Accessibility guidance in EN 301 549 ensures inclusive design, while healthcare institutions adopt IVA tools only after rigorous bias audits. Vendors that can certify privacy and fairness gain preferred status in public-sector tenders, shaping competitive dynamics across the continent.

Regulatory Landscape
IVA deployments sit at the intersection of AI governance, privacy, and consumer-protection rules, pushing vendors toward auditable design (documentation, record-keeping, human oversight, and transparency) as assistants move from scripted chat to agentic behavior. In the European Union, Regulation (EU) 2024/1689 (EU AI Act) sets obligations around technical documentation and transparency (including marking certain AI-generated content), with full applicability anchored to August 2, 2026, a timing that supports compliance toolkit build-outs for global suppliers serving EU customers.
Regulation is also becoming more specific to conversational and anthropomorphic services. In China, the Cyberspace Administration of China promulgated Interim Measures for the Administration of AI Anthropomorphic Interactive Services in April 2026, effective July 15, 2026, introducing tiered oversight and algorithm filing requirements that directly affect IVA features such as persona-driven interaction. In the United States, March 2026 policy activity from the White House emphasized a national AI legislative framework aimed at reducing fragmentation across state rules, while states continued to advance targeted conversational AI and companion-chatbot requirements with effective dates beginning in January 2027, increasing the priority of safety protocols, including minor protections and crisis-handling safeguards, in consumer-facing assistants.
Value Chain Analysis
The IVA value chain spans data and content inputs (enterprise knowledge bases, CRM and contact-center transcripts, and domain ontologies), model development (foundation models, ASR/TTS, and multilingual NLP), orchestration and governance layers, and deployment infrastructure (cloud, on-premise, and edge accelerators). Distribution typically flows through platform ecosystems and enterprise application marketplaces, where IVAs are packaged as contact-center solutions, embedded assistants (smart speakers, automotive, and wearables), or workflow agents integrated into ERP/HRMS/S2P stacks, with system integrators and IT services firms operationalizing deployments through security hardening, integration, and change management.
A key shift in the chain is the move from reactive chat interfaces to skills-based, agentic architectures that execute multi-step workflows across third-party systems. This increases the role of integration standards and governance tooling. Ivalua illustrates this transition: it announced IVA Studio in April 2026 as a no-code environment to build and govern autonomous procurement agents and began rolling it out in June 2026, positioning governance, permissions, and monitoring as first-class components alongside model selection. Specialized vertical providers and large service providers such as Accenture, Capgemini, and IBM sit downstream as implementers and operators, while hyperscalers and chip vendors shape cost and latency through deployment choices and hardware acceleration, reinforcing cloud dominance alongside rising on-premise and edge priorities.
Competitive Landscape
Large platform vendors and niche specialists coexist in a moderately consolidated arena. Top cloud providers embed conversational AI into broader SaaS portfolios, while automotive OEMs forge multi-year alliances with voice-tech firms to accelerate time to market. Cerence’s cooperative projects with Microsoft and NVIDIA typify symbiotic deals where domain knowledge meets GPU optimization. Volkswagen’s rapid ChatGPT rollout illustrates OEM preference for turnkey solutions rather than ground-up development.
Meanwhile, disruptors target cost and privacy gaps with on-device models. Start-ups designing neuromorphic chips promise inference at single-watt power budgets, a lure for wearables and IoT devices where battery life is king. Patent filings on personalized multimodal agents rise sharply; Microsoft’s latest submission outlines dynamic response synthesis based on stored user-interest vectors. Suppliers now compete on measurable ROI, hardened security features, and certified compliance toolkits, not merely conversational flair.
Healthcare, elder-care, and accessibility niches present white-space openings protected by regulatory barriers. Companies capable of furnishing audit-ready logs and meeting medical-device standards command premium pricing. Taken together, the intelligent virtual assistant market shows healthy rivalry across tiers while leaving room for specialized entrants to flourish.
Intelligent Virtual Assistant (IVA) Industry Leaders
IBM Corporation
Inbenta Technologies
Apple Inc.
Amazon.com Inc.
Microsoft Corp.
- *Disclaimer: Major Players sorted in no particular order
Intelligent Virtual Assistant (IVA) Market Companies Covered in this Report
- Amazon.com Inc.
- Google LLC (Alphabet)
- Apple Inc.
- Microsoft Corp.
- IBM Corp.
- Meta Platforms Inc.
- Alibaba Group
- Baidu Inc.
- Samsung Electronics Co. Ltd.
- Xiaomi Inc.
- OpenAI
- Anthropic
- Harman International
- Nuance Communications Inc.
- Avaamo Inc.
- EdgeVerve Systems Ltd.
- Ipsoft Inc. (Amelia)
- Kore.ai Inc.
- Inbenta Technologies Inc.
- Creative Virtual Ltd.
- Serviceaide Inc.
- Rasa Technologies GmbH
- SoundHound AI Inc.
- Tencent Holdings Ltd.
Read Analysis of Intelligent Virtual Assistant (IVA) Companies

Market Opportunities and Future Outlook
Agentic orchestration across enterprise applications is creating a concrete opportunity beyond classic customer-service containment. Assistants can trigger approved actions inside systems of record while maintaining auditability, and this makes integration depth a differentiator. Market activity around Model Context Protocol (MCP) points to where vendors are investing in interoperability: Slack connected Slackbot with Salesforce via MCP servers to query CRM data, generate Tableau visualizations, and initiate DocuSign approvals from chat, while Google introduced more agentic Gemini capabilities with new MCP connections for third-party apps. This interoperability focus opens whitespace for vendors that combine multi-agent routing, permissions, and traceable action logs with prebuilt connectors to common enterprise platforms.
A second opportunity sits in cost-controlled deployment and compliance-aligned architectures that keep sensitive conversational data within enterprise boundaries, aligning with cloud cost pressure and privacy concerns. Enterprises already cite savings from IVA-led self-service channels, including a major travel company reporting USD 10 million in annual cost reductions after improving containment, supporting expansion of IVA scope into regulated workflows where governance and documentation requirements are heavier. The tightening regulatory environment around transparency and anthropomorphic services also creates room for specialized safety and compliance layers, such as content labeling, human oversight controls, and crisis-protocol handling, which can be sold as add-ons or embedded capabilities across consumer and enterprise IVA stacks.
Recent Industry Developments in Intelligent Virtual Assistant (IVA) Market
- April 2026: The Cyberspace Administration of China promulgated Interim Measures for the Administration of AI Anthropomorphic Interactive Services, with the rules taking effect on July 15, 2026. The measures introduce tiered oversight and algorithm filing expectations for anthropomorphic interactive services, directly affecting how persona-driven IVAs are designed and operated in China. This elevates compliance engineering and governance features as product differentiators for vendors serving consumer-facing assistants.
- January 2025: Cerence broadened its partnership with NVIDIA to optimize the CaLLM family of automotive language models using TensorRT-LLM for lower latency and higher accuracy. The collaboration targets production-grade performance constraints in vehicles, where responsiveness and reliability shape user adoption. It also strengthens the role of GPU-optimized stacks in scaling in-car IVA capabilities across multilingual markets.
- October 2024: Renault integrated Cerence Chat Pro into the Reno companion debuting in the Renault 5 E-Tech EV. Embedding an IVA in a high-visibility vehicle launch underscores how automakers are treating conversational assistants as a core infotainment and control interface rather than a feature add-on. The move reinforces OEM preference for turnkey voice platforms to shorten development cycles and support frequent updates.


Intelligent Virtual Assistant (IVA) Market Report Scope and Research Methodology
Market Definition and Coverage
For this methodology, the intelligent virtual assistant market covers software and related services that enable AI-driven conversational interactions through text or voice, including chatbots and smart speaker assistants used in consumer and enterprise settings.
Scope exclusions: We exclude general-purpose hardware value beyond the assistant-enabled portion of smart devices, along with pure human-only call center services that do not use an IVA layer.
Segments Covered in This Report
- By Product (Value)
- Chatbots
- Smart Speakers
- In-Car IVAs
- Wearable / Embedded Devices
- By Deployment Mode (Value)
- Cloud
- On-premise / Edge
- By User Interface Technology (Value)
- Text-based (Text-to-Text)
- Voice-based (ASR + TTS)
- Multimodal (Voice + Visual)
- By End-User
- Retail and eCommerce
- BFSI
- Healthcare
- Telecom and IT
- Travel and Hospitality
- Other Industries
- By Geography (Value)
- North America
- United States
- Canada
- Mexico
- South America
- Brazil
- Argentina
- Rest of South America
- Europe
- Germany
- United Kingdom
- France
- Spain
- Netherlands
- Rest of Europe
- Asia-Pacific
- China
- Japan
- India
- South Korea
- Rest of Asia-Pacific
- Middle East and Africa
- United Arab Emirates
- Saudi Arabia
- South Africa
- Rest of Middle East and Africa
- North America
Data Sources, Market Sizing, and Validation
Desk Research
Desk work was used to build the market boundary and anchor adoption signals that can be checked year over year. Public sources such as the US Bureau of Labor Statistics, the US Census Bureau, the International Telecommunication Union, OECD digital economy indicators, and World Bank macro series were referenced to understand enterprise activity, connectivity, and spending capacity that can influence IVA rollout.
We also reviewed company filings, investor presentations, product documentation, press releases, and credible tech media to map common deployment patterns across cloud and on-premise use, and to understand how assistants are packaged and priced. Where needed, paid subscriptions were used for company financials and news screening, plus patent databases to track AI, speech recognition, and conversational interface activity as directional input. This desk list is not exhaustive, and additional sources were used throughout the study for data collection, validation, and clarification.
Primary Interviews and Surveys
Primary work focused on validating what portion of conversational AI spend is truly attributable to IVA products, and how buying happens across consumer and enterprise use cases. We spoke with a mix of product owners, implementation partners, IT and contact center leaders, and channel participants across APAC, EMEA, and the Americas, so penetration, pricing, and deployment mix assumptions could be checked and adjusted with firsthand input.
Distribution of primary research fieldwork respondents
| Company type | Respondent position | Region |
|---|---|---|
| Top tier: 33% | CXOs: 14% | APAC: 43% |
| Mid tier: 53% | Functional/Unit leaders: 34% | EMEA: 34% |
| Smaller Players: 14% | Managers: 52% | Americas: 23% |
Market-Sizing & Forecasting
The core sizing starts with a top-down build where digital customer engagement activity and enterprise automation demand are translated into an addressable IVA spend pool, and then filtered by adoption and deployment shares (cloud versus on-premise) that were validated through interviews. To keep the math grounded, results are corroborated using selective bottom-up approximations like sampled pricing times active deployments for chatbots, plus channel checks on smart speaker assistant monetization, which helps correct for over-counting.
Inputs used in the model include the relative share of smart speakers in total IVA revenue, cloud deployment share, the mix of voice-based versus text-based interfaces, enterprise seat or agent coverage assumptions for contact center use, and the pace of conversational AI feature upgrades that can lift average pricing. When a bottom-up proxy was not available for a niche use case, the gap was handled through a conservative penetration assumption and then re-tested with primary feedback before finalizing.
For forecasting, scenario analysis was applied around a base case that reflects expected enterprise automation budgets and consumer device replacement cycles, followed by sensitivity checks on adoption speed and pricing progression. The final trajectory was aligned with what respondents described as realistic ramp-up timing by region and by deployment type.
Data Validation & Update Cycle
Triangulation is done by comparing outputs from the demand-pool build with independent signals like regional digital spending direction, enterprise software budget tone, and shifts in cloud versus on-premise preferences. Any large variance at segment or region level is reviewed, assumptions are re-checked, and follow-up outreach is triggered when the deviation cannot be explained by a clear market event.
Before sign-off, the model goes through multi-step analyst reviews where formula logic, unit consistency, and currency timing are verified, followed by a final reasonableness pass against recent announcements and adoption indicators. Reports are refreshed annually, and interim updates are made when material developments occur, after which a fresh pre-delivery check is completed so clients receive the latest view.
Mordor Intelligence's Intelligent Virtual Assistant Market Size Versus Other Published Estimates
Published market sizes for intelligent virtual assistants often do not match because each publisher draws the line differently on what counts as an IVA and how revenue is recognized across consumer and enterprise use cases. Differences also show up due to base year choice, currency timing, and whether forecasts assume a conservative adoption curve or a faster ramp.
The key gaps usually come from scope, especially around whether smart speaker related revenue is counted as device value, platform value, or only the assistant-enabled portion, and whether adjacent conversational AI tools are included even when they are not used as a virtual assistant. Pricing progression assumptions (subscription versus usage based), and how cloud versus on-premise deployments are treated in the split, can further move totals up or down from one estimate to another.
Benchmark comparison
| Source | Market Size | Gaps in Research Methodology |
|---|---|---|
| Mordor Intelligence | USD 19.60 B (2025) | |
| Industry Publisher A | USD 17.10 B (2025) | Uses a narrower product view that centers on chatbots and IVA smart speakers, with fewer adjustments for enterprise deployment breadth and monetization differences across cloud and on-premise setups. |
| Global Consultancy B | USD 25.99 B (2025) | Applies a broader interpretation that can pull in adjacent conversational AI and platform related value, and it also tends to assume faster pricing expansion across large enterprise rollouts. |
The table shows a noticeable spread around the 2025 value, and in Mordor Intelligence's model the smart speaker contribution is treated as the assistant-related revenue rather than full device value, with cloud and on-premise splits validated through primary checks. When scope lines are drawn this clearly, it becomes easier to track the market with repeatable inputs and to explain year-to-year movement without relying on hidden assumptions.


Key Questions Answered in the Report
What is the current value of the intelligent virtual assistant market?
The market stands at USD 25.7 billion in 2026 and is projected to hit USD 99.61 billion by 2031.
Which product type leads the intelligent virtual assistant market?
Smart speakers lead with 45.68% revenue share, although in-car assistants are growing fastest at 32.58% CAGR.
Why are enterprises moving IVA workloads on-premise?
On-prem deployments lower inference costs to as little as one-fifth of cloud expense and satisfy data-sovereignty rules.
Which industry vertical is expanding most rapidly?
Healthcare IVAs are forecast to grow at 32.74% CAGR through 2031, driven by remote-care and elder-care use cases.
Which region will add the most new IVA revenue by 2031?
Asia Pacific, supported by large-scale AI initiatives in China, India, and Southeast Asia, is projected to log the highest 34.05% CAGR.
How do privacy regulations affect IVA adoption?
Frameworks such as the EU AI Act and U.S. ONC transparency rules require auditable data handling and explainable outputs, prompting many firms to favor on-prem or edge deployments for greater control.
Page last updated on:





