
Integration Platform-as-a-Service Market Size and Share
Market Overview
| Study Period | 2020 - 2031 |
|---|---|
| Market Size (2026) | USD 9.24 Billion |
| Market Size (2031) | USD 20.93 Billion |
| Growth Rate (2026 - 2031) | 17.75 % |
| Fastest Growing Market | Asia Pacific |
| Largest Market | North America |
| Market Concentration | Medium |
Major Players *Disclaimer: Major Players sorted in no particular order Image © Mordor Intelligence. Reuse requires attribution under CC BY 4.0. | |
Integration Platform-as-a-Service Market Analysis by Mordor Intelligence
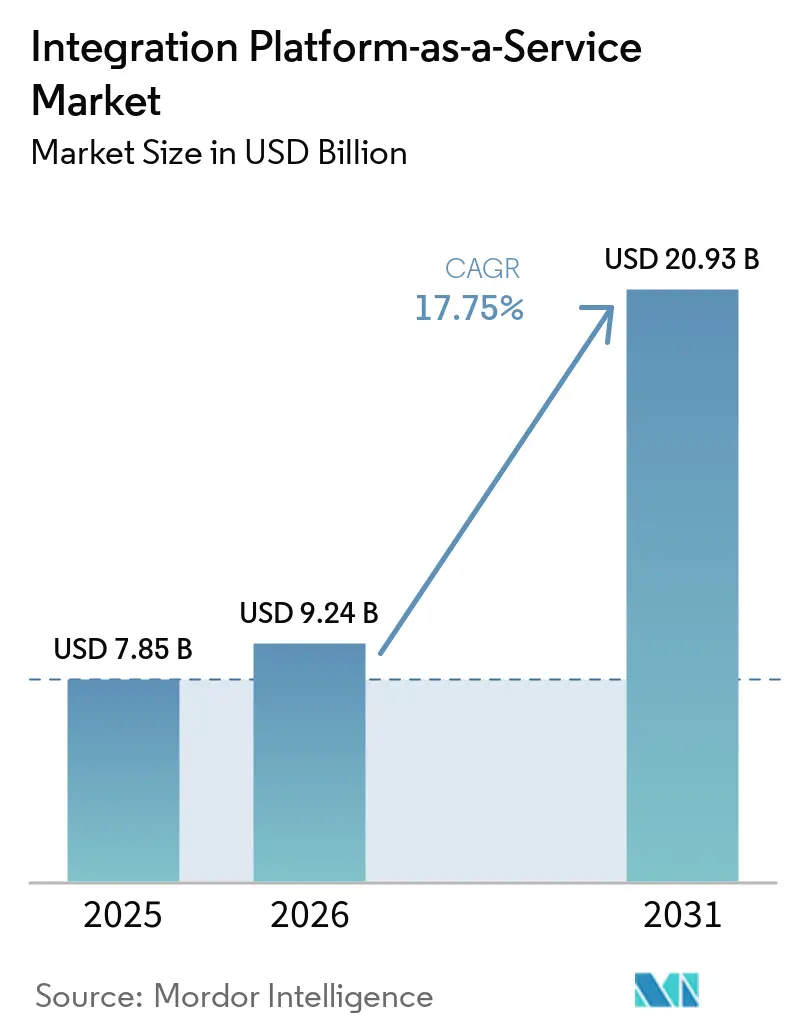
The Integration Platform-as-a-Service market size is expected to grow from USD 7.85 billion in 2025 to USD 9.24 billion in 2026 and is forecast to reach USD 20.93 billion by 2031 at 17.75% CAGR over 2026-2031. Expansion reflects mounting pressure on enterprises to connect proliferating SaaS, IoT, and edge assets while embedding AI in every integration flow. Event-driven architectures, GenAI design assistants, and sovereign-cloud mandates are reshaping platform requirements, nudging buyers away from hand-coded, point-to-point links toward intelligent, policy-aware fabrics. Competitive dynamics are equally fluid: hyperscale’s bundle native integration, independent vendors double down on multi-cloud openness and vertical specialization, and global system integrators form new alliance networks around data residency compliance. APAC’s manufacturing modernization, healthcare interoperability mandates, and consumption-based pricing for SMEs together create the strongest incremental demand signals over the next five years.
Key Report Takeaways
- By deployment model, Public Cloud led with 70.35% revenue share in 2025; Hybrid Cloud is projected to compound at a 27.35% CAGR through 2031.
- By end-user vertical, BFSI held 21.60% of the Integration Platform-as-a-Service market share in 2025, while Healthcare and Life Sciences is advancing at a 29.95% CAGR through 2031.
- By organization size, Large Enterprises accounted for 61.20% share of the Integration Platform-as-a-Service market size in 2025; SMEs are forecast to expand at a 32.10% CAGR between 2026-2031.
- By service type, Application Integration captured 41.40% of the Integration Platform-as-a-Service market size in 2025; API and Event Integration is accelerating at a 34.90% CAGR to 2031.
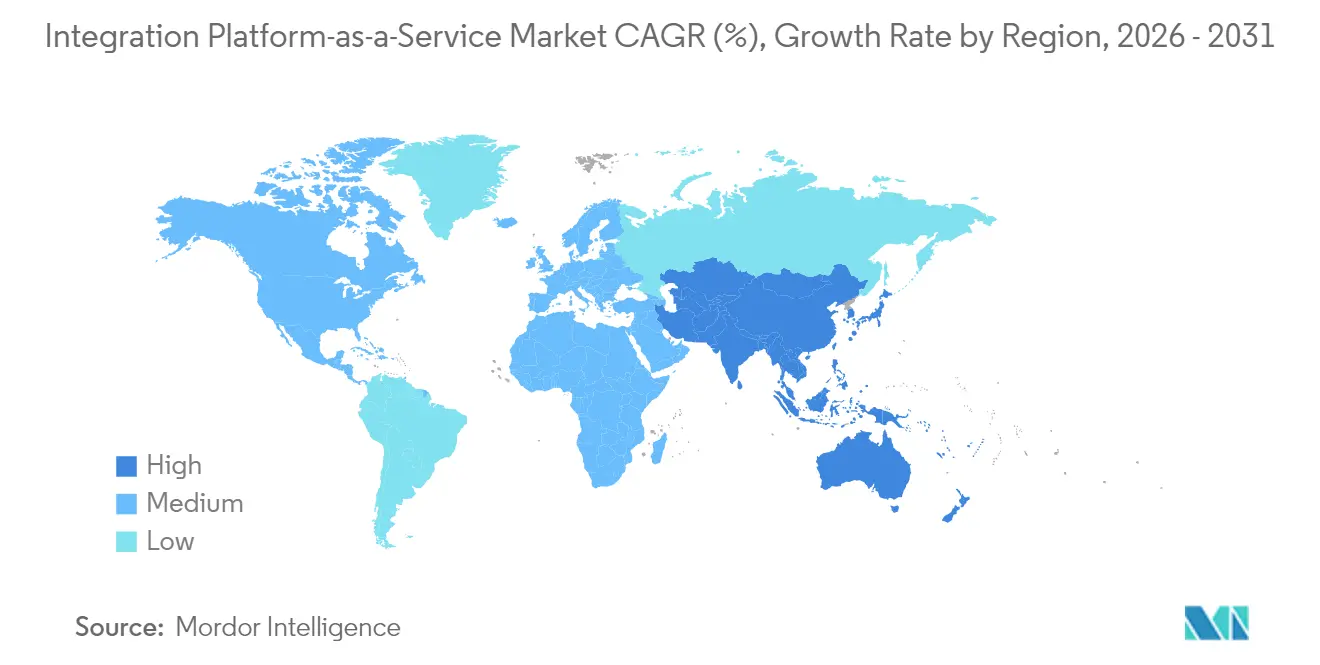
- By geography, North America commanded 45.40% share in 2025; APAC is set to grow fastest at 23.20% CAGR through 2031.
Note: Market size and forecast figures in this report are generated using Mordor Intelligence’s proprietary estimation framework, updated with the latest available data and insights as of 2026.
Market Trends and Insights
Drivers Impact Analysis of Integration Platform-as-a-Service Market*
| Driver | (~) % Impact on CAGR Forecast | Geographic Relevance | Impact Timeline |
|---|---|---|---|
| AI-augmented integration and GenAI design assistants | +4.2% | Global, early adoption in North America and Europe | Medium term (2-4 years) |
| API-sprawl and composable enterprise mandates | +3.8% | Global, accelerated in APAC manufacturing hubs | Short term (≤ 2 years) |
| Rise of event-stream and IoT edge integrations | +3.1% | APAC core, spill-over to North America manufacturing | Medium term (2-4 years) |
| Low-/no-code integration democratization | +2.9% | Global, strongest in SME segments | Short term (≤ 2 years) |
| CSP marketplace bundling of iPaaS SKUs | +1.8% | North America and EU, expanding to APAC | Long term (≥ 4 years) |
| Pay-per-flow pricing unlocking SME adoption | +1.4% | Global, highest impact in emerging markets | Medium term (2-4 years) |
| Source: Mordor Intelligence | |||
AI-augmented integration and GenAI design assistants
Generative AI inside leading platforms such as MuleSoft’s Einstein and SnapLogic’s SnapGPT lets non-technical staff specify flows in plain language, trimming design cycles from weeks to hours.[1] Monthly document throughput on SnapGPT reached 4.7 trillion in 2024, underscoring surging workload volumes. These assistants bring conversational tooling directly into IDEs, yet also raise governance questions whenever sensitive data travels through learning models. Providers able to marry secure prompts with enterprise policy controls gain a clear edge.
API-sprawl and “composable enterprise” mandates
Enterprises manage 400+ active APIs, a side-effect of microservices and SaaS adoption. Manufacturers digitising factories rely on real-time links between IoT sensors, ERP and digital-twin models to sustain predictive maintenance strategies. Composable business design, especially popular across APAC industrial hubs where 75% of service leaders plan extra digital spend in 2025, drives appetite for unified orchestration and streaming backplanes.[2]
Rise of event-stream and IoT edge integrations
Factory and hospital edge nodes now require sub-second roundtrips to analytics tiers. Deployments using Apache Kafka connect edge sensors, cloud AI, and MES in a continuous loop, delivering 14.53% productivity gains and 13.9% energy savings in digital-twin pilots. Vendors such as Crosser illustrate how edge MLOps pipelines stretch iPaaS capabilities beyond the data-center perimeter.
Low-/no-code integration democratization
Analyst projections indicate non-technical users will craft 80% of digital solutions by 2025, accelerating the shift toward graphical flow builders. Embedded ML suggestions automate connector mapping, cutting development effort by up to 90% while preserving security guardrails. Platform vendors respond by integrating policy templates and audit trails into citizen-developer consoles to simplify oversight.
Restraints Impact Analysis of Integration Platform-as-a-Service Market*
| Restraint | (~) % Impact on CAGR Forecast | Geographic Relevance | Impact Timeline |
|---|---|---|---|
| Growing hyperscale native-integration cannibalization | -2.8% | Global, strongest in mid-market | Short term (≤ 2 years) |
| Vendor lock-in and switching-cost anxiety | -1.9% | North America and EU enterprises | Medium term (2-4 years) |
| Data locality regulations prolonging sales cycles | -1.3% | EU and Middle East | Long term (≥ 4 years) |
| Talent scarcity in advanced event-stream architectures | -1.1% | Global | Short term (≤ 2 years) |
| Source: Mordor Intelligence | |||
Growing hyperscale native-integration cannibalization
AWS AppFlow, Azure Logic Apps, and Google Apigee Integration come bundled with core cloud services, undercutting standalone vendors on price and convenience.[3] Mid-market buyers with existing cloud commitments often default to these native options, especially where feature depth beyond standard connectors is unnecessary. Independent vendors counter by emphasizing multi-cloud reach, industry-specific connectors, and advanced AI orchestration that hyperscalers do not yet match.
Vendor lock-in and switching-cost anxiety
Integrations become embedded in mission-critical operations, making platform migration costly. Research on lock-in dynamics links dependency levels with direct financial exposure, prompting enterprises to demand open standards and portable design artefacts. GDPR and similar rules intensify scrutiny in Europe, where data export or residency breaches carry significant penalties. Vendors respond through export APIs, containerized runtimes and transparent contract terms, but the tension between optimization and portability persists.
*Our forecasts treat driver/restraint impacts as directional, not additive. The impact forecasts reflect baseline growth, mix effects, and variable interactions.
Integration Platform-as-a-Service Market Segment Analysis
By Deployment Model:
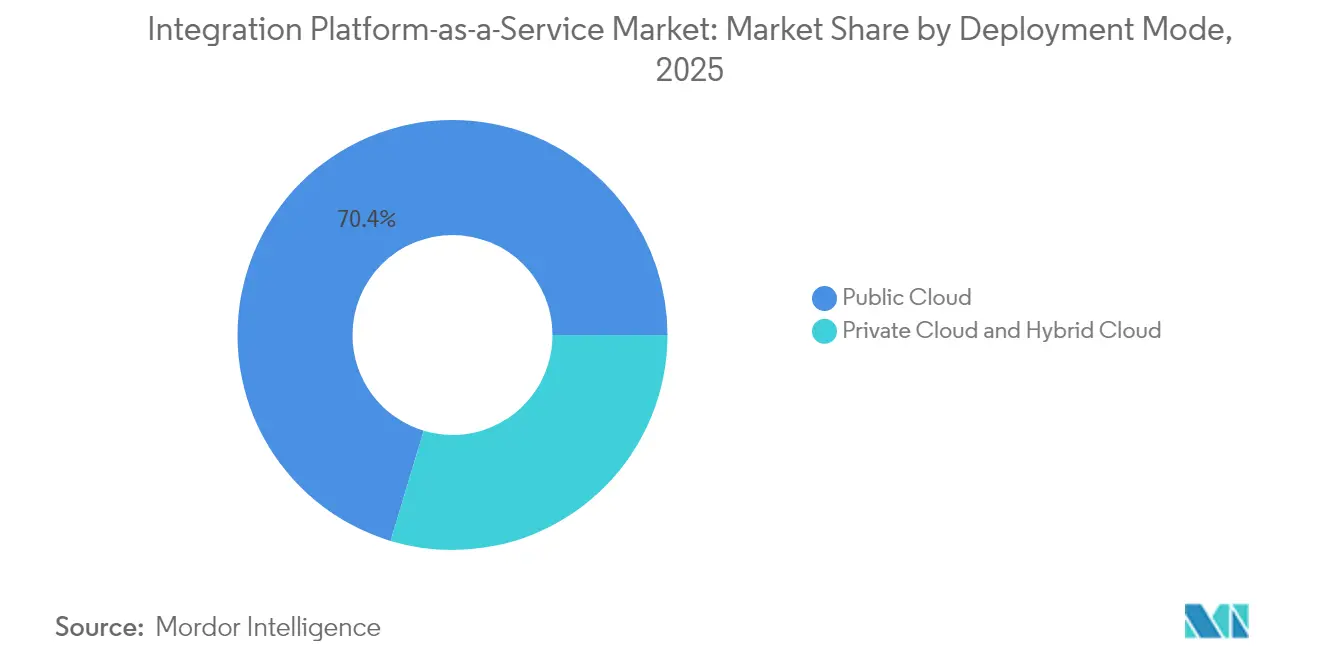
Hybrid Cloud Bridges Sovereignty GapsPublic Cloud retains the largest slice of the Integration Platform-as-a-Service market size at a 70.35% revenue contribution in 2025. Hybrid Cloud, though smaller, is cutting the gap at a rapid 27.35% CAGR to 2031 as firms reconcile cloud elasticity with sovereign data controls. This migration pattern correlates with GAIA-X frameworks and sector rules in finance and healthcare that restrict full public-cloud offload. Independent providers now position pre-engineered on-prem agents that mirror public-cloud runtimes, letting regulated workloads participate in shared integration fabrics while remaining in the country.
Enterprises increasingly allocate sensitive PII or trade-secret workloads to private cores yet orchestrate event streams across public edges for customer-facing services. European telcos use sovereign iPaaS layers to expose 5G network APIs safely to developers, while Japanese automakers mirror production-line telemetry into regional clouds for advanced analytics. The Integration Platform-as-a-Service market share advantage of Public Cloud narrows as these hybrid playbooks mature. The growing need to connect on-premises and cloud applications to drive digital business transformation is probably going to have an impact on the growth of the hybrid integration platform market over the next few years.

By End-user Vertical:
Healthcare Accelerates Digital IntegrationBFSI captured 21.60% of Integration Platform-as-a-Service market share in 2025, powered by open-banking APIs, real-time payments and compliance reporting. Healthcare and Life Sciences, meanwhile, charts the steepest growth at 29.95% CAGR on the back of EHR interoperability, HL7 FHIR mandates and telehealth infrastructure upgrades. Providers need instant data synchronization between clinical, claims and analytics systems to support value-based care.
Large hospital networks deploy streaming iPaaS nodes to collect vitals from connected devices and feed AI diagnostic models. Pharmaceutical R&D teams integrate LIMS with molecular simulation engines to cut cycle times. BFSI continues to invest in secure message protocols and anti-fraud event flows, yet regulatory deadlines in healthcare accelerate procurement decisions, tilting incremental spending toward specialized platforms with HIPAA-grade connectors.
By Organization Size:
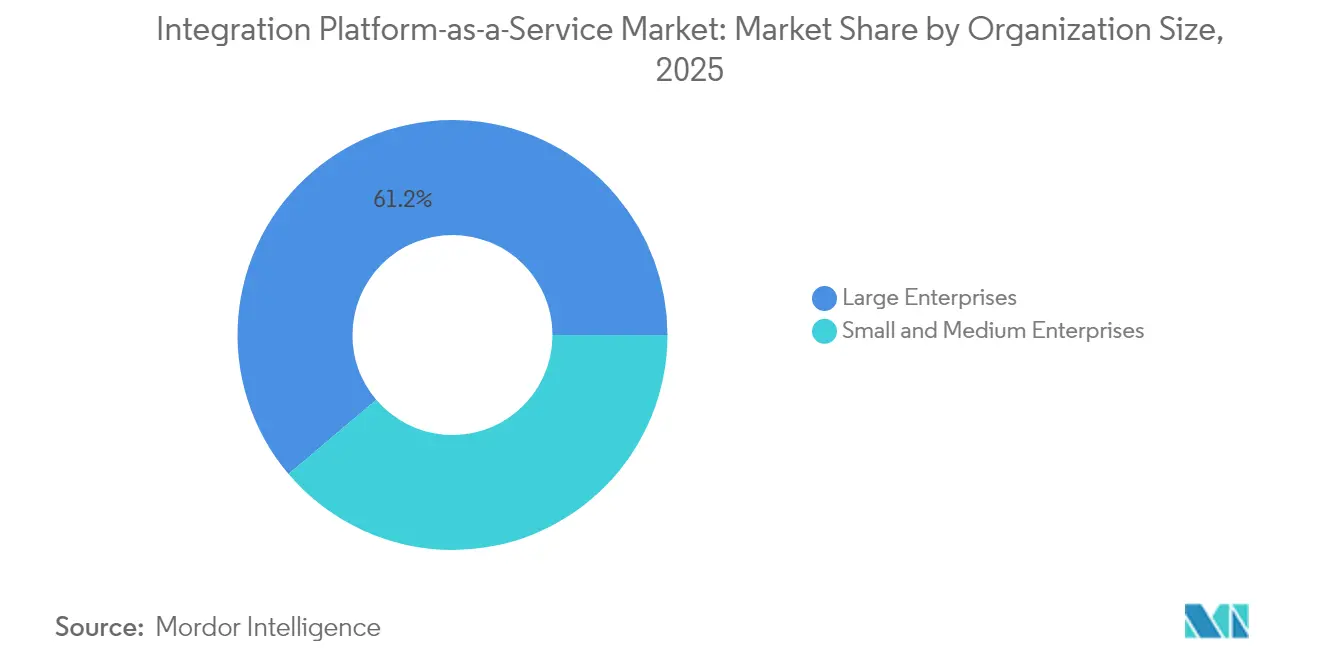
SME Growth Unlocks New MarketsLarge Enterprises controlled 61.20% of Integration Platform-as-a-Service market size in 2025 by virtue of sprawling application estates and global compliance needs. SMEs, however, clock the fastest 32.10% CAGR through 2031, enabled by pay-per-flow or tiered subscription pricing that lowers adoption hurdles. Consumption models from vendors such as Frends start at EUR 30 per process, making enterprise-grade tooling affordable to smaller firms.
Low-code canvases and AI mapping assistants further shrink skills barriers, allowing business analysts to wire up CRM, e-commerce, and accounting tools without IT backlogs. Providers tailor onboarding with guided templates and community marketplaces, converting what were once complex three-month projects into same-day deployments. As SME contracts scale in volume, vendors must sustain multitenant elasticity and self-service support to preserve margins.
By Service Type:
API Integration Drives Modern ArchitectureApplication Integration delivered 41.40% of Integration Platform-as-a-Service market size in 2025, cementing its role in bridging legacy ERPs with modern SaaS suites. Yet, API and Event Integration surges ahead at 34.90% CAGR to 2031 as organizations pivot to microservices and real-time analytics. Agentic AI now automatically generates OpenAPI specs and maps events to Kafka topics, letting teams spin up composable capabilities on demand.
Event gateways extend to edge clusters where sensor traffic triggers autonomous actions. Insurance companies stream telematics data to risk engines, while retailers analyze click-stream events in session. B2B file transfer and batch ETL retain niche relevance for regulated archival use cases, but spending gradually shifts toward API-first endpoints, serverless connectors and low-latency stream relays.
Geography Analysis
North America Integration Platform-as-a-Service Market
North America’s 45.40% revenue share in 2025 reflects entrenched enterprise cloud adoption and a dense concentration of iPaaS vendors. The region’s revenue mix tilts toward AI-augmented integration and multi-cloud automation, illustrated by Salesforce’s USD 8 billion Informatica acquisition in May 2025 that fused data management with workflow orchestration. Compliance-focused sectors such as finance and federal agencies still test sovereign extensions to mitigate lock-in risk.
APAC, EMEA and South America Integration Platform-as-a-Service Market
APAC grows fastest at 23.20% CAGR through 2031, propelled by government digital-service programs and manufacturing overhauls under Industry 4.0 charters. The Asian Development Bank’s Digital Development Facility funnels technical assistance into AI and big-data platforms, indirectly raising demand for robust integration backbones. Japanese and Korean electronics giants connect smart-factory twins to cloud analytics, while ASEAN digital-ID schemes hinge on cross-agency API gateways. Europe balances opportunity and constraint: GAIA-X pushes open, federated cloud ecosystems, yet GDPR and pending AI laws prolong evaluation cycles. South America, Middle East and Africa currently register smaller revenues but show growing appetite for cloud-first integration where mobile adoption and fintech modernization are rapid.
Regulatory Landscape
Integration Platform-as-a-Service (iPaaS) adoption is increasingly shaped by cloud portability, API security, and sovereign-cloud governance requirements. In the European Union, Chapter VI of the EU Data Act (Regulation (EU) 2023/2854) entered into application in September 2025 and targets the removal of commercial and technical barriers to switching. That extends pressure on iPaaS vendors and their hyperscaler dependencies to provide exportability, interoperability, and clearer contractual terms for migration.
Security and public-sector compliance frameworks further raise baseline requirements for integration runtimes and exposed APIs. In March 2026, NIST issued updated guidance for API protection in cloud-native systems, reinforcing controls aligned with zero-trust and policy-enforced access for integration endpoints. For US federal workloads, FedRAMP scope guidance for 2026 also pulls iPaaS that is embedded into agency enterprise security services (for example, identity management or SIEM-related workflows) into mandatory authorization boundaries. This influences procurement and delivery models for vendors selling into government and other regulated sectors.
Value Chain Analysis
The iPaaS value chain begins with cloud infrastructure and foundational platform services (compute, storage, networking, identity, and observability) that host multitenant runtimes, followed by iPaaS vendors that package core workflow orchestration, API management, event and streaming connectivity, and connector libraries. Upstream inputs increasingly include standards and interoperability building blocks such as CloudEvents (event metadata) and sector or industrial data standards (for example, OPC UA for manufacturing). Around these, vendors and communities also contribute emerging workflow and orchestration specifications (for example, FlowDSL and the Workflow Orchestration Standard integration profile) that aim to make workflows more portable across execution environments.
Downstream, delivery is amplified by hyperscaler marketplaces and channel partners, with global and regional system integrators implementing integration patterns, governance, and managed operations for end users. In regulated B2B and supply chain contexts, industry associations and interoperability networks (for example, the EESPA/GENA-Peppol interoperability model for e-invoicing ecosystems) influence how providers design onboarding, routing, and auditability. Key bottlenecks remain connector maintenance across fast-changing SaaS APIs, limited observability in legacy point-to-point estates, and switching costs created by proprietary workflow semantics as transaction volumes and event rates scale.
Competitive Landscape
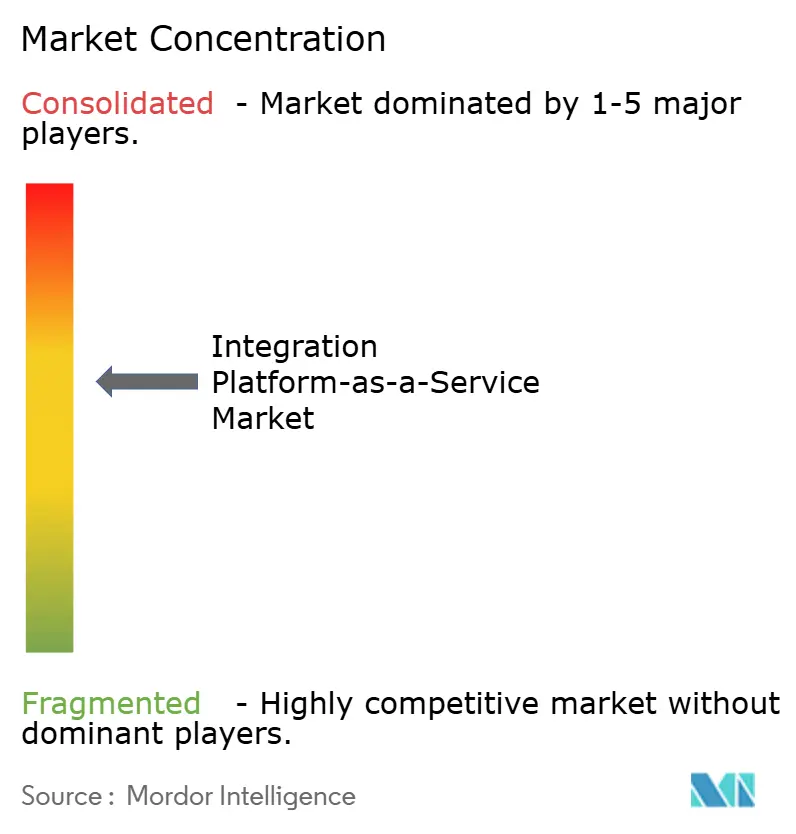
Moderate consolidation defines the Integration Platform-as-a-Service market. Salesforce (MuleSoft), Boomi and Informatica enjoy sizeable installed bases, sustained by global support desks, 1,000-plus connector catalogs and deep security certifications. Hyperscale’s, however, cross-sell native flows that ride on broader infrastructure contracts, compressing price points for straightforward workloads. Independent vendors counter with multi-cloud neutrality, sovereign-cloud deployment blueprints and GenAI-powered design copilots.
Strategic plays cluster around three themes. First, platform roll-ups: Salesforce’s Informatica purchase creates a vertically integrated data-to-workflow stack. Second, AI-first differentiation: IBM’s webMethods Hybrid Integration injects agentic AI to auto-manage APIs and B2B channels at scale. Third, vertical embedding: specialized connectors for HL7 FHIR, ISO 20022, or OPC-UA let providers win in regulated sectors resistant to generic cloud bundles.
Patent filings in automated schema mapping and streaming lineage attest to a continuing R&D arms race. Channel ecosystems also evolve, with system integrators weaving iPaaS blueprints into SAP, Oracle and cloud ERP modernization projects. For mid-market clients the battle narrows to simplicity, predictable consumption pricing and pre-built templates. For global enterprises it widens to data sovereignty, AI governance and advanced observability.
Integration Platform-as-a-Service Industry Leaders
-
Informatica Corporation
-
TIBCO Software Inc.
-
Oracle
-
IBM
-
Microsoft (Azure Logic Apps)
- *Disclaimer: Major Players sorted in no particular order
Integration Platform-as-a-Service Market Companies Covered in this Report
- Salesforce (MuleSoft)
- Boomi
- Informatica
- SAP
- Oracle
- IBM
- SnapLogic
- Workato
- Microsoft (Azure Logic Apps)
- Google (Apigee Integration)
- AWS (AppFlow)
- TIBCO
- Celigo
- Jitterbit
- Talend
- Fivetran
- Tray.io
- Adeptia
- ONEiO
Read Analysis of Integration Platform-as-a-Service Companies
Market Opportunities and Future Outlook
Sovereign and portable integration is a concrete whitespace area as buyers balance public-cloud convenience with data-residency and switching obligations. The EU Data Act switching provisions that entered into application in September 2025 sharpen demand for iPaaS capabilities that support exportable artifacts, standardized interfaces, and operational tooling for migrations, particularly for hybrid deployments where regulated workloads remain in-country while customer-facing event flows run in public cloud. Vendors that package “migration-ready” design patterns, portability tooling, and audit-ready controls can differentiate in EU and Middle East procurement cycles where data locality and governance extend sales evaluation.
A second opportunity centers on operationalizing integration as a repeatable discipline rather than a one-off project, especially as estates span SaaS, APIs, and event streams. Industry narratives around Integration Ops (IntOps) and the shift toward treating integration as an operational capability point to demand for centralized observability, policy enforcement, and run-time governance across large connector catalogs and event backplanes. On the platform side, agentic automation inside integration tooling is also creating room for new product packaging (for example, native actions that invoke AI agents, secure prompt governance, and standardized agent-to-tool connectivity), supported by 2026 product cycles that embed AI into integration design and execution.
Recent Industry Developments in Integration Platform-as-a-Service Market
- April 2026: Oracle rolled out Oracle Integration 26.04, adding an AI agent invoke native action and expanding connectivity with new adapters including BigQuery, Databricks, and Microsoft Fabric. The release tightens Oracle's positioning around agentic automation inside integration workflows while improving interoperability across modern analytics and data platforms.
- December 2025: Informatica announced new integrations with Amazon Bedrock AgentCore at AWS re:Invent 2025 to extend collaboration between Intelligent Data Management Cloud (IDMC) and AWS AI services. The move strengthens Informatica's ability to serve AI-driven integration and governance use cases on AWS, aligning iPaaS workflows with hyperscaler AI ecosystems.
- June 2024: TIBCO launched The New TIBCO Platform, unifying experiences across its integration, messaging, and data grid offerings. Consolidation under a single platform experience supports cross-product adoption and simplifies operations for enterprises running mixed integration and messaging estates.
Integration Platform-as-a-Service Market Report Scope and Research Methodology
Market Definition and Coverage
This market covers revenue generated from cloud-delivered integration platforms that help organizations connect applications, data sources, APIs, and workflows across cloud and on-prem environments using a managed, subscription-based model.
Scope exclusions: We exclude pure on-prem middleware and one-time integration project services that are not sold as an ongoing iPaaS subscription.
Segments Covered in This Report
- By Deployment Model
- Public Cloud
- Private Cloud
- Hybrid Cloud
- By End-user Vertical
- BFSI
- Retail and E-commerce
- Healthcare and Life Sciences
- Manufacturing
- IT and Telecom
- Media and Entertainment
- By Organisation Size
- Large Enterprises
- Small and Mid-size Enterprises (SME)
- By Service Type
- Application Integration
- Data / ETL Integration
- API and Event Integration
- B2B / E-commerce Integration
- By Geography
- North America
- South America
- Europe
- Asia-Pacific
- Middle East and Africa
Data Sources, Market Sizing, and Validation
Desk Research
Desk research starts by building the demand context for integration spending and cloud adoption, then narrowing it to iPaaS-specific revenue pools. Public sources are used to ground baseline assumptions, such as cloud services growth and cross-border digital services trends, before interviews are used to refine what is actually counted as iPaaS.
We referenced non-paywalled sources such as the US Census Bureau, Eurostat, OECD digital economy publications, ITU indicators, NIST guidance on system interoperability, and the World Bank for macro and enterprise digitalization signals. We also reviewed company filings, product documentation, investor decks, and trusted press coverage to map pricing motions, packaging (platform versus add-on), and typical contract terms. Where needed, paid subscriptions were used only for company financial intelligence, news and financials, and patent databases to confirm timelines and product direction. These examples are illustrative, and many other sources were used for data collection, cross-checking, and clarification.
Primary Interviews and Surveys
Primary work was used to pressure-test scope boundaries, pricing, and adoption intensity across regions, then reconcile gaps seen in public reporting. We spoke with platform owners, integration architects, managed service partners, and enterprise buyers across major industries so assumptions on connector usage, average subscription value, and renewal patterns could be checked against real buyer and partner behavior.
Distribution of primary research fieldwork respondents
| Company type | Respondent position | Region |
|---|---|---|
| Top tier: 30% | CXOs: 16% | APAC: 41% |
| Mid tier: 54% | Functional/Unit leaders: 41% | EMEA: 37% |
| Smaller Players: 16% | Managers: 43% | Americas: 22% |
Market-Sizing & Forecasting
The core model uses a top-down approach where cloud software spending and integration-related budgets are reconstructed by region, and then filtered to the portion delivered as iPaaS subscriptions. To keep totals realistic, we corroborate results with selective bottom-up checks, such as sampled pricing plans, estimated active customer counts by cohort, and partner channel mix, and then adjust for double counting.
Inputs used in the model include enterprise cloud adoption pace, the number of SaaS applications per organization, API traffic and integration workload growth signals, average subscription pricing and packaging patterns (including usage-based elements), and renewal versus new logo contribution across years. When a pricing or volume input is missing for a sub-region or buyer cohort, proxy values are taken from similar markets and then tuned using interview feedback.
For the forecast, scenario analysis is applied around two main drivers, cloud modernization speed and integration complexity growth, and the scenarios are translated into yearly demand curves using a light multivariate regression check. In the final step, expert views are used to select the most practical path and to keep adoption assumptions within a reasonable range.
Data Validation & Update Cycle
Validation is done through multiple checks so that one dataset does not drive the whole outcome. Outputs are compared against independent signals, such as cloud software growth, enterprise IT budget direction, and observable shifts in integration patterns, and large variances are reviewed before sign-off.
When an anomaly appears, we re-check the scope mapping, currency conversions, and year alignment, and then re-contact selected respondents if a key assumption seems to have changed. Reports are refreshed annually, with interim updates triggered by material events that can shift adoption or pricing. Before delivery, a final analyst pass is completed so clients receive the latest updated view.
Mordor Intelligence's Integration Platform As A Service Market Estimate Compared With Other Published Estimates
Published iPaaS market values often differ because firms do not count the same revenue items, and they also use different start years and conversion timing. In practice, the biggest differences come from what is treated as platform subscription revenue versus adjacent integration services, API management bundles, or broader data integration tooling.
Some external estimates appear to fold in a wider integration software basket or include a larger share of implementation and managed services revenue. In the split-contrast approach applied here, Mordor Intelligence counts iPaaS as recurring platform revenue tied to cloud-delivered integration capabilities, and it limits services to what is packaged with the platform subscription rather than standalone project work.
Benchmark comparison
| Source | Market Size | Gaps in Research Methodology |
|---|---|---|
| Mordor Intelligence | USD 9.24 B (2026) | |
| Global Consultancy A | USD 7.25 B (2025) | Uses an earlier base year and appears to apply a faster growth path, and the scope likely includes a broader set of integration workloads beyond core iPaaS subscriptions, which shifts the starting value and trajectory. |
| Trade Journal B | USD 6.42 B (2024) | Anchors the series on a different base year and may rely more on vendor-reported headline figures without consistently separating platform subscription revenue from adjacent integration services and bundled cloud integration tools. |
The spread across sources is mostly explained by scope choices and year alignment, which then change the implied pricing and adoption curve. Our approach stays traceable to clear variables like subscription packaging, renewal behavior, and cloud integration workload growth, making the estimate easier to reproduce and update.
Key Questions Answered in the Report
What is the projected size of the Integration Platform-as-a-Service market by 2031?
The market is forecast to reach USD 20.93 billion by 2031, expanding to an 17.75% CAGR.
Which deployment model is growing fastest?
Hybrid Cloud leads growth with a 27.35% CAGR from 2026-2031 as enterprises balance cloud agility with data sovereignty.
Which industry vertical shows the strongest expansion?
Healthcare and Life Sciences grows at a 29.95% CAGR to 2031, outpacing all other verticals due to EHR interoperability mandates.
How are hyperscales affecting independent iPaaS vendors?
AWS, Microsoft, and Google bundle native integration services that pressure pricing in the mid-market, pushing independents toward multi-cloud support, vertical expertise, and advanced AI features.
Why is APAC considered the most attractive growth region?
Coordinated government digital programs, manufacturing modernization, and rapid SME digitization drive a 23.20% CAGR for iPaaS across APAC markets.
What role does generative AI play in modern integration platforms?
GenAI design assistants automate connector mapping and workflow creation, enabling business users to build complex integrations in hours instead of weeks while providers embed governance controls to protect sensitive data.