
Institutional Furniture Market Size and Share
Market Overview
| Study Period | 2020 - 2031 |
|---|---|
| Market Size (2026) | USD 244.65 Billion |
| Market Size (2031) | USD 333.59 Billion |
| Growth Rate (2026 - 2031) | 6.42 % |
| Fastest Growing Market | Asia-Pacific |
| Largest Market | North America |
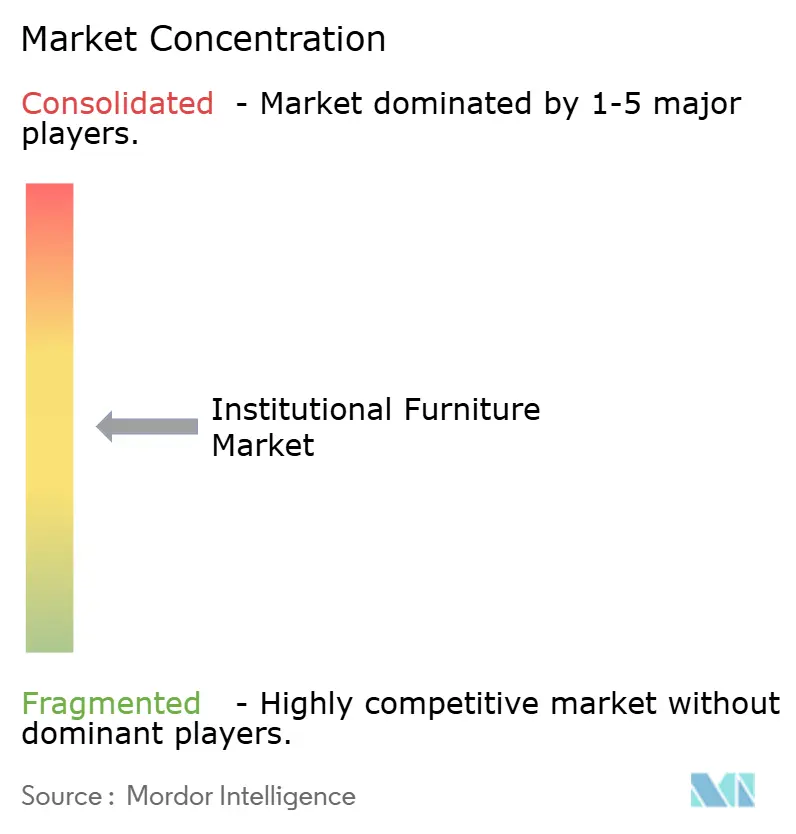
| Market Concentration | Medium |
Major Players
*Disclaimer: Major Players sorted in no particular order Image © Mordor Intelligence. Reuse requires attribution under CC BY 4.0. |
|
Institutional Furniture Market Analysis by Mordor Intelligence
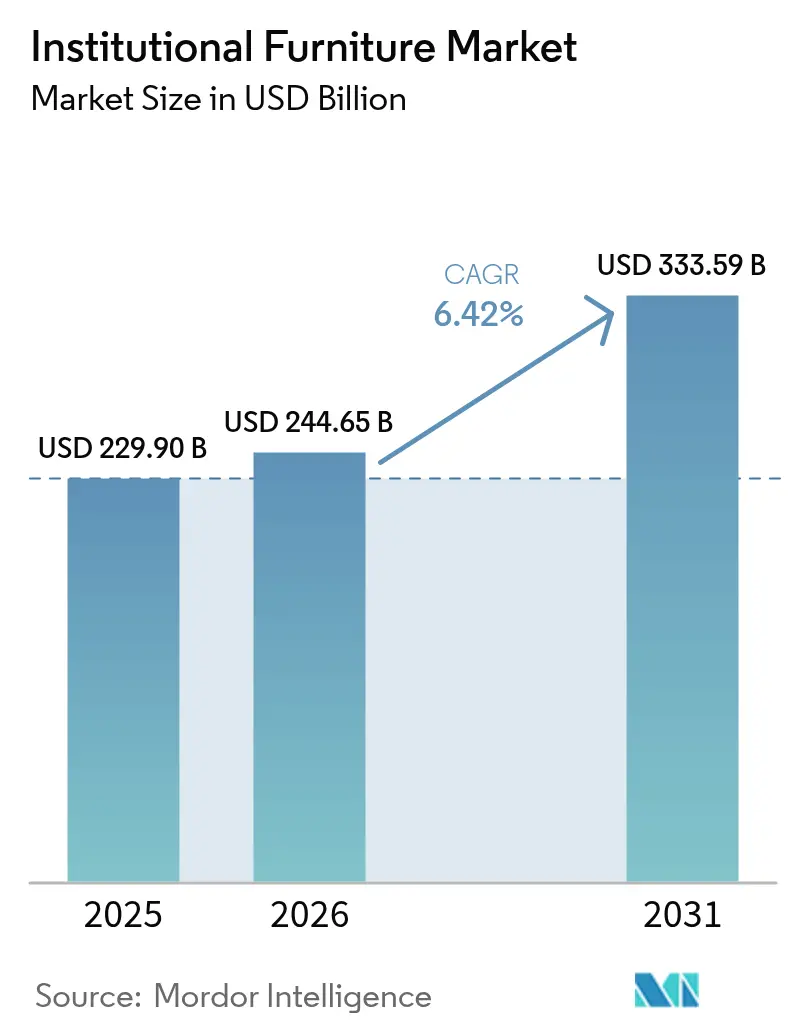
The institutional furniture market size is expected to grow from USD 229.9 billion in 2025 to USD 244.65 billion in 2026 and is forecast to reach USD 333.59 billion by 2031 at 6.42% CAGR over 2026-2031. Demand is buoyed by record student enrollments, enlarged healthcare capital budgets, and a widespread turn to hybrid work-learning formats that require furnishings able to shift from individual to group use within minutes. Buyers now insist on third-party sustainability labels, making FSC, GREENGUARD, and BIFMA LEVEL certifications baseline entry requirements. Heightened digital procurement activity, led by public e-tendering platforms, shortens buying cycles for standard lines yet raises expectations for rapid configuration support. Meanwhile, sensor-enabled seating and other connected products are opening a new data-driven services layer for manufacturers that can interpret utilization insights for clients.
Key Report Takeaways
- By product, chairs led with 35.35% of the institutional furniture market share in 2025, while sofas and soft seating are on track for a 7.03% CAGR through 2031.
- By material, wood retained a 33.40% share of the institutional furniture market size in 2025; plastic and polymer materials are projected to climb to a 6.78% CAGR.
- By price range, economy lines held 42.35% of the institutional furniture market size in 2025, whereas premium furniture is expected to grow at 6.62% CAGR to 2031.
- By end user, offices captured 44.25% of the institutional furniture market size in 2025; healthcare facilities represent the fastest growing end user at 6.45% CAGR.
- By distribution channel, dealer networks accounted for 39.10% of 2025 sales, yet online platforms registered the fastest 7.48% CAGR.
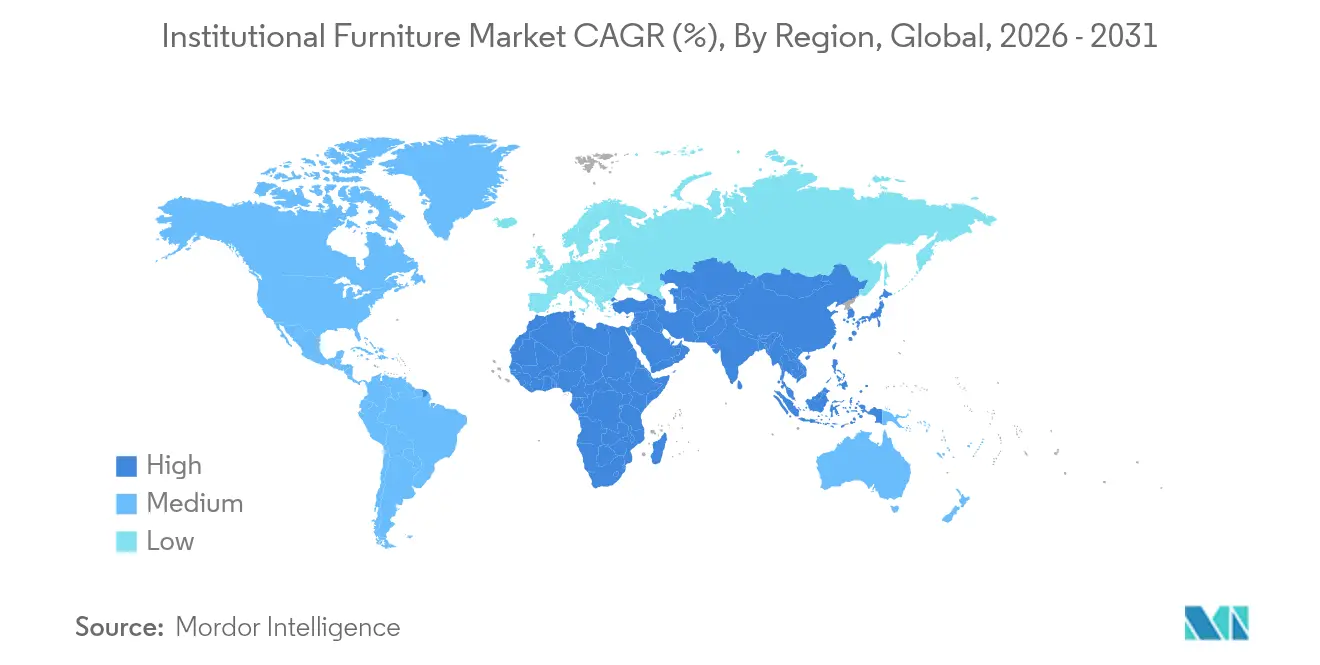
- By geography, North America dominated with 34.45% revenue in 2025; Asia-Pacific is forecast to post a 7.12% CAGR over 2026-2031.
Note: Market size and forecast figures in this report are generated using Mordor Intelligence’s proprietary estimation framework, updated with the latest available data and insights as of 2026.
Market Trends and Insights
Drivers Impact Analysis of Institutional Furniture Market*
| Driver | (~) % Impact on CAGR Forecast | Geographic Relevance | Impact Timeline |
|---|---|---|---|
| Rapid Expansion of Global Education Enrolments and Campus Construction | +1.8% | Global, with a concentration in Asia-Pacific and the Middle East | Medium term (2-4 years) |
| Growing Worldwide Spend on Healthcare Infrastructure and Patient-Centric Waiting Areas | +1.5% | North America, Europe, Asia-Pacific | Medium term (2-4 years) |
| Shift Toward Hybrid Work-Learning Models Driving Demand for Re-Configurable Multi-Use Furniture | +1.2% | Global, with early adoption in North America and Europe | Short term (≤ 2 years) |
| Rising Global Preference for Certified Sustainable Materials (FSC, GREENGUARD, BIFMA LEVEL) | +0.9% | North America, Europe, with a growing influence in Asia-Pacific | Long term (≥ 4 years) |
| Digital Procurement & E-Tendering Platforms Boosting Cross-Border B2B Furniture Sourcing | +0.7% | Global, with the strongest impact in North America and Europe | Short term (≤ 2 years) |
| Source: Mordor Intelligence | |||
Rapid Expansion of Global Education Enrolments and Campus Construction
Student populations are rising sharply, spurring the construction of new schools and universities that specify learning spaces able to morph from lectures to group tasks within the same period. In 2000, approximately 445 million children were enrolled in secondary education. By 2023, that figure surged to roughly 641 million [1]UNESCO Institute for Statistics, "Education Enrollment Data",unesco.org. As school enrollments surge, the construction of educational institutions ramps up, leading to a heightened demand for furniture solutions in schools and universities. Responding to the growing student population and the demand for contemporary, adaptable learning spaces, Shanghai Jiao Tong University broke ground on a new campus in Chenjiazhen Education Park, Chongming District, Shanghai, in October 2024. In September 2024, in a significant move to address the rising student population, Mayor Eric Adams unveiled 24 new public school buildings across New York City. This expansion, which added 11,010 K-12 seats in Brooklyn, the Bronx, Manhattan, and Queens, represents the most substantial increase in school seats since 2003 [2]The Office of the Mayor, “Mayor Adams Opens 24 New School Buildings Ahead of 2024-2025 School Year,” nyc.gov. Administrators now favor modular desks, mobile storage, and stackable seating that support open pedagogies, universal design, and technology-rich curricula. Demand for ergonomic adjustment features continues to climb as institutions address varied body sizes and accessibility mandates. Growth is strongest in Asia-Pacific and the Gulf Cooperation Council, where public budgets for K-12 and tertiary facilities remain intact despite wider fiscal pressures. As a result, the institutional furniture market sees larger bid sizes and longer call-off contracts tied to multi-phase campus projects.
Growing Worldwide Spend on Healthcare Infrastructure and Patient-Centric Waiting Areas
Hospitals and clinics are redirecting capital toward interiors that reduce stress and infection risks. Waiting zones increasingly mirror hospitality lounges, employing soft seating, calming palettes, and biophilic accents to raise patient satisfaction scores. For instance, the Asklepios Clinic in Schaufling, Germany, exemplified patient-centric design. The clinic collaborated with Appia Contract GmbH to redesign its reception area, focusing on enhancing patient comfort. The redesign featured spacious layouts, upgraded furniture, and modular seating. These improvements not only enhanced the clinic's aesthetics but also supported better hygiene practices. Furniture specifications now also include antimicrobial laminates, sealed foam cores, and fully welded frames such as those in Stance Healthcare’s Spry Seating line. Health-system mergers in the United States and Europe standardize design templates across networks, compressing decision timelines, and extending contract volumes. These trends keep healthcare the fastest-expanding end user within the institutional furniture market and reward suppliers able to verify cleanability and durability through real-time usage data.
Shift Toward Hybrid Work-Learning Models Driving Demand for Re-Configurable Multi-Use Furniture
Organizations revising real-estate footprints need furniture that lets one room become a private office in the morning and a team studio by afternoon. Height-adjustable tables, lightweight screens, and power-integrated seating are therefore moving from optional upgrades to base specifications. Manufacturers such as Steelcase report order uplifts linked directly to return-to-office programs. Early adopters in higher education are mirroring the approach, outfitting libraries and student hubs with mobile pods and touchdown benches. As hybrid policies stabilize, data-ready units that track occupancy support facility-management decisions, reinforcing the institutional furniture market’s pivot toward smart products.
Rising Global Preference for Certified Sustainable Materials
Environmental, social, and governance criteria feature prominently in tender scorecards, with many public agencies assigning minimum weights of 20-30% to sustainability credentials. Producers respond by expanding the use of recycled polymers, rapidly renewable wood such as bamboo, and low-VOC finishes. For instance, MillerKnoll’s pledge to eliminate added PFAS from all North American lines by May 2025 sets a milestone for chemical transparency in the institutional furniture market [3]MillerKnoll, “MillerKnoll is the First Office Furniture Manufacturer to Announce Elimination of PFAS from North American Brand Portfolio of Products,” millerknoll.com . Lifecycle assessments now influence not only materials but disassembly design, pushing factories toward mono-material components that simplify closed-loop recovery.
Restraints Impact Analysis of Institutional Furniture Market*
| Restraint | (~) % Impact on CAGR Forecast | Geographic Relevance | Impact Timeline |
|---|---|---|---|
| Volatility in Global Steel, Hardwood and Petrochemical Prices Impacting Input Costs | -0.8% | Global, with heightened impact in regions with limited raw material reserves | Medium term (2-4 years) |
| Intensifying Price Competition from Low-Cost Manufacturing Hubs (Vietnam, Malaysia, China) | -0.6% | North America, Europe | Long term (≥ 4 years) |
| Lengthy Public-Sector Procurement Cycles and Compliance Certifications | -0.3% | Global, with particular impact in regions with complex regulatory frameworks | Medium term (2-4 years) |
| Source: Mordor Intelligence | |||
Volatility in Global Steel, Hardwood, and Petrochemical Prices Impacting Input Costs
Volatile costs for manufacturers are significantly restraining the growth of the market. In 2024 and early 2025, benchmark steel coil and hardwood indexes fluctuated by double-digit percentages quarter-to-quarter, eroding margin visibility for contract-linked projects. Because raw materials can account for three-quarters of furniture lifecycle impact, manufacturers hedge with forward-buy strategies and alternative material R&D. Yet, sudden cost spikes still force price renegotiations or scope reductions, tempering the institutional furniture market’s overall growth pace.
Intensifying Price Competition from Low-Cost Manufacturing Hubs
Low-cost manufacturing hubs, including China, Vietnam, India, and certain Eastern European regions, are reshaping the competitive landscape of the global institutional furniture market through intensifying price competition. These nations, with their access to cheaper raw materials, labor, and scalable production capacities, empower manufacturers to offer products at prices that undercut those from higher-cost areas, such as North America and Western Europe. European buyers report widening landed-cost gaps, prompting many regional brands to emphasize design, circularity, and quick-ship services over direct price matches. Consolidation within North America—illustrated by HNI Corporation’s USD 503.7 million acquisition of Kimball International—aims to unlock scale efficiencies that preserve competitiveness, yet downward pressure on average selling prices remains a drag on the institutional furniture market.
*Our forecasts treat driver/restraint impacts as directional, not additive. The impact forecasts reflect baseline growth, mix effects, and variable interactions.
Institutional Furniture Market Segment Analysis
By Product:
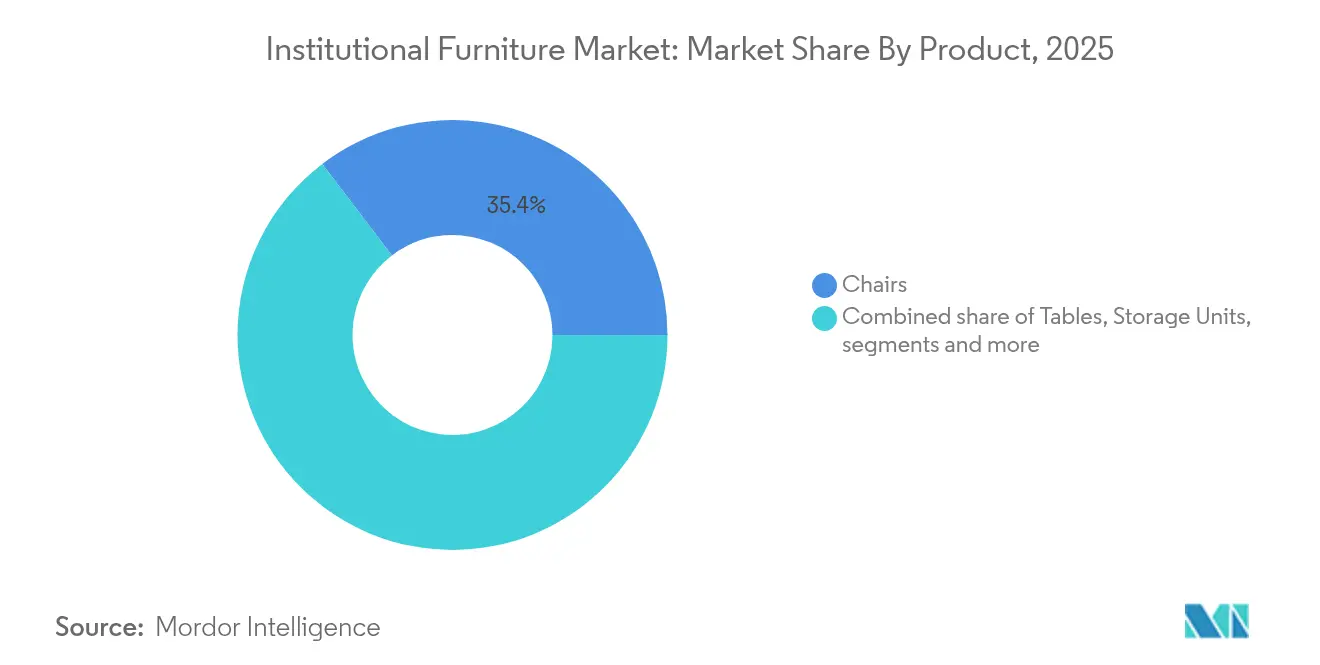
Soft Seating Redefines Collaborative SpacesThe institutional furniture market share for chairs reached 35.35% of total revenue in 2025, underscoring their universal role across campuses, clinics, and offices. Growing ergonomic awareness keeps task-chair refresh cycles short, sustaining volume even in mature regions. Sofas and other soft seating, though smaller in absolute terms, are projected to advance at a 7.03% CAGR to 2031 as institutions remodel lobbies, libraries, and break-out zones into informal collaboration areas.
A parallel trend boosts demand for acoustic pods, booths, and partition-integrated couches that mitigate noise without erecting permanent walls. Within open-plan schools, rolling ottomans and loveseat modules help educators reconï¬gure lessons swiftly, supporting inclusive pedagogy. Healthcare suites specify bariatric-rated lounge pieces that meet both durability and infection-control protocols, signaling that comfort-oriented design is becoming a clinical standard rather than a luxury. These shifts collectively steer incremental growth in the institutional furniture market, favoring vendors with broad upholstery fabrics and modular geometries.


By Material:
Polymers Challenge Wood's DominanceWood held 33.40% of the institutional furniture market share in 2025, reflecting both aesthetic appeal and long-standing purchaser familiarity. Specifiers increasingly request chain-of-custody documentation, pushing mills toward FSC-certified timber and water-based finishing systems. Plastics and advanced polymers are the fastest-rising material class, expected to post a 6.78% CAGR through 2031. Their gains stem from recycled content innovation, reduced weight for shipping cost savings, and emerging bio-based resins that match structural requirements.
Metal frames remain critical for strength and reusability; aluminum and closed-loop steel benefit from indefinite recyclability and are championed in procurement guidance from several EU member states. Hybrid composites blending natural fibers with polypropylene now appear in student chair shells and hospital recliners, balancing impact resistance with lower embodied carbon. Such material experimentation widens choice yet obliges manufacturers to maintain multi-process capabilities, adding operational complexity across the institutional furniture industry.
By Price Range:
Premium Segment Defies Economic PressuresEconomy lines commanded the largest slice of the institutional furniture market at 42.35% in 2025, serving price-sensitive public schools and regional government offices. Yet the premium tier is forecast for 6.62% CAGR as procurement teams embrace total cost-of-ownership metrics. Decision-makers now weigh extended warranties, upgrade paths, and ease of refurbishment against upfront outlay, often deciding that premium builds deliver lower lifetime expenses.
Manufacturers respond with high-pressure laminate edges, grade-A textiles, and service packages covering re-upholstery or component swap-outs. Mid-range products continue to sell on balanced specifications, but leakage to premium is evident in urban headquarters and magnet hospitals where interior branding and patient experiences tip budgets upward. As a result, the margin mix is drifting higher even while the broader institutional furniture market remains price-competitive at the entry level.
By End User:
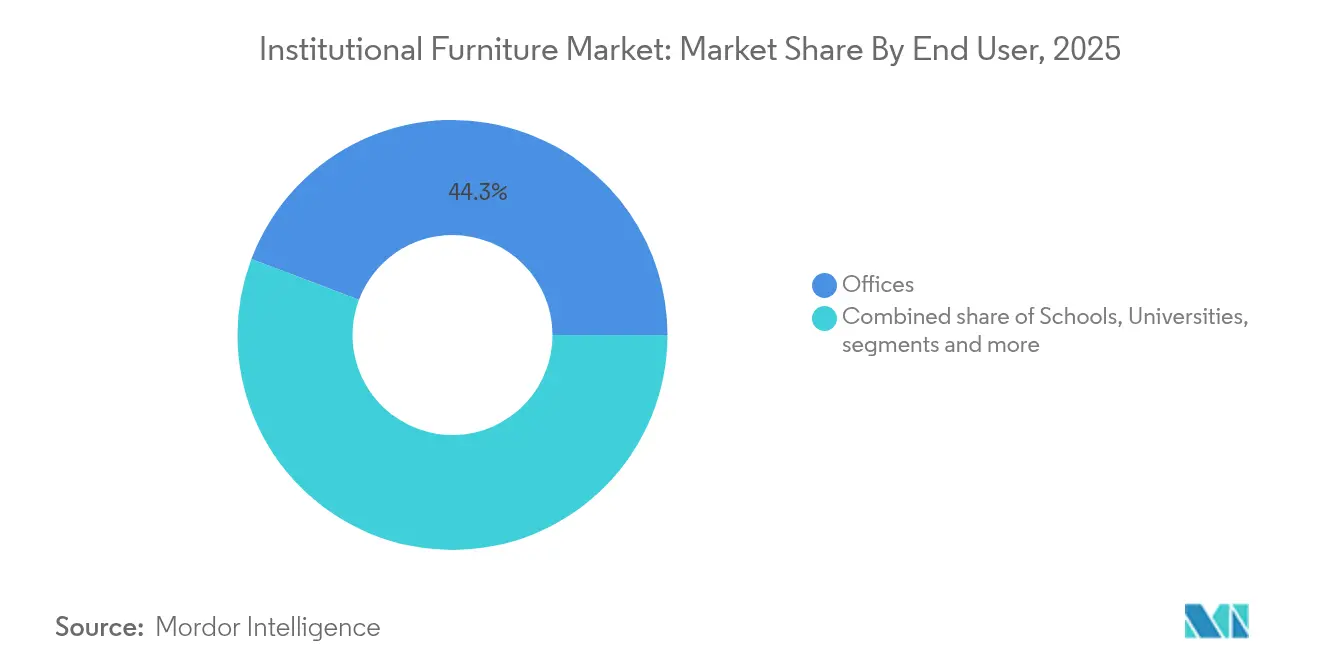
Healthcare Facilities Drive InnovationOffice environments represented 44.25% of the institutional furniture market size in 2025, anchored by ongoing space redesigns to accommodate hybrid attendance patterns. Reallocation of floorplates from dense benching to varied zones—focus nooks, social cafés, and training studios—sustains replacement cycles. In parallel, healthcare settings are forecast to outpace all other users at 6.45% CAGR as new clinics open and legacy hospitals retrofit for infection-prevention layouts.
Furniture for exam rooms and infusion bays integrate flush surfaces and easy-off upholstery covers, with several systems now offering embedded USB-C power and patient entertainment mounts. Educational bodies remain a stable demand pillar, though procurement windows often coincide with budget approvals, creating seasonal production spikes. Government ministries, courts, and civic centers continue to invest steadily, yet growth stems mainly from safety upgrades and accessibility compliance rather than square-footage expansion, moderating their contribution to overall institutional furniture market momentum.
By Distribution Channel:
Online Platforms Disrupt Traditional NetworksDealer networks controlled 39.10% of sales in 2025, leveraging installation crews and on-site design support to maintain relevance. However, web-based tendering and direct-to-client portals are scaling rapidly, reflected by a 7.48% CAGR outlook for online channels.
Manufacturers tread carefully to avoid channel conflict, often granting dealers region-exclusive finishes or bundled service agreements. Government entities increasingly utilize cooperative contracts such as OMNIA or Sourcewell, compressing bid paperwork and favoring suppliers with digital catalog syndication. Integration of 3-D visualizers and rapid quote engines on brand sites further accelerates the institutional furniture market’s online share, though complex turnkey projects still rely on dealer expertise for coordinated delivery and punch-list resolution.
Geography Analysis
North America Institutional Furniture Market
North America accounted for 34.45% of the institutional furniture market revenue in 2025, supported by large-scale commitments to refresh K-12 classrooms and modernize hospital campuses. Adoption of sit-to-stand desks, active stools, and adjustable monitor arms continues as employers seek to reduce musculoskeletal claims and enhance retention. Canada mirrors these patterns, though capital outlays concentrate in higher education laboratories and public-sector workplaces.
APAC Institutional Furniture Market
Asia-Pacific is forecast to register a 7.12% CAGR through 2031, underpinned by urban migration, rapid school construction, and public-private investment in new hospitals. Chinese regulations now restrict precious hardwoods in state furnishing, nudging demand toward engineered timber, bamboo, and recyclable metals. India’s Production-Linked Incentive scheme should spur local manufacture of plastic injection and metal fabricated furniture, trimming delivery lead times for domestic projects. Southeast Asian producers, meanwhile, expand export capacity, reinforcing the region’s dual role as consumer and supplier within the institutional furniture market.
EMEA and South America Institutional Furniture Market
Europe maintains a deep design influence. Stringent Extended Producer Responsibility laws encourage take-back programs, prompting many brands to label components for easy recycling. Nordic governments already mandate public-sector furniture to include minimum recycled content percentages, setting precedents likely to spread across the bloc. The Middle East and Africa region pursues large university and hospital schemes financed by sovereign funds, while South America’s growth is tied to Brazil’s classroom digitization push and corporate headquarters openings in São Paulo and Santiago. Collectively, these dynamics sustain the institutional furniture market’s global expansion, even as regional mix shifts toward emerging economies.

Regulatory Landscape
Institutional furniture procurement is increasingly shaped by safety, fire performance, and emissions rules that affect materials selection and testing requirements across regions. In China, the State Administration for Market Regulation issued GB 28008-2024 (technical specification for the safety of furniture structure) in June 2024, with implementation from July 1, 2025, which increases the importance of documented structural safety compliance for projects tied to public budgets and large campuses.
In Europe, chemical compliance is tightening around indoor air quality, with the EU formaldehyde emission limit under Commission Regulation (EU) 2023/1464 (REACH Annex XVII amendment) taking effect on August 6, 2026, for furniture and wood-based articles. This reinforces demand for low-emission panels, verified VOC controls, and traceable supplier declarations. In the United States, the Consumer Product Safety Commission is moving toward more digitized and verifiable import compliance, including mandatory electronic filing of Certificates of Compliance beginning July 8, 2026, which raises the operational value of standardized test records, bill-of-material traceability, and pre-shipment documentation for upholstered and casegood categories.
Value Chain Analysis
The institutional furniture value chain runs from upstream inputs (steel and aluminum sections, hardwood and engineered wood panels, foams, textiles, laminates, and polymers) to midstream design and manufacturing (metal fabrication, woodworking, molding, upholstery, finishing, and kitting). Downstream channels include dealer and distributor networks, direct-to-institution sales, online configuration and ordering, and public procurement platforms and cooperatives. Buyers increasingly specify third-party sustainability and indoor air quality credentials, such as FSC, GREENGUARD, and BIFMA LEVEL, which pushes manufacturers to formalize chain-of-custody documentation and incorporate third-party lab testing into standard product release and bid submission.
Downstream, ordering and execution are shaped by tendering and contract vehicles that compress buying for standard lines, while keeping customization and installation services within the dealer ecosystem for complex projects. Cooperative purchasing agreements, such as master intergovernmental cooperative programs used by education buyers (for example, Region 4 Education Service Center contracts effective December 17, 2024), streamline procurement and expand the role of authorized dealer partners in specification support, delivery, and post-install services. Supply risk remains concentrated in imported, standardized items sourced from Asia, while near-shoring and regional manufacturing footprints are used for quick-ship, customized, or high-durability products where lead time, compliance control, and project scheduling matter.
Competitive Landscape
The institutional furniture market features a moderate concentration of leading suppliers balanced by vibrant regional specialists. Top players—Steelcase Inc., Haworth Inc., MillerKnoll, Inc., Okamura Corporation, and HNI Corporation—extend advantage through integrated R&D, vertically owned distribution, and expanding portfolios of technology-ready products. Haworth emphasizes circular design, as seen in the Breck task chair, composed of 55.6 kg CO₂e lifetime emissions, less than half typical equivalents.
Digital-first entrants differentiate via rapid product drops, configurable modules, and data dashboards delivered as software-as-a-service subscriptions. Many established brands respond by upgrading web visualization tools and piloting subscription models that bundle furniture, sensors, and analytics into monthly rates. Sustainability commitments, such as eliminating PFAS or achieving carbon-neutral factories, serve as key tender differentiators. Acquisition pipelines remain active, with mid-sized specialists in acoustic booths, antimicrobial laminates, or demountable walls viewed as attractive bolt-ons. Competition consequently hinges less on the lowest price and more on proof of impact—ergonomic, environmental, and operational—reinforcing value-focused segmentation within the institutional furniture market.
Institutional Furniture Industry Leaders
-
HNI Corporation
-
Steelcase Inc.
-
MillerKnoll, Inc.
-
Haworth Inc.
-
Okamura Corporation
- *Disclaimer: Major Players sorted in no particular order
Institutional Furniture Market Companies Covered in this Report
- MillerKnoll, Inc.
- Steelcase Inc.
- HNI Corporation
- Haworth Inc.
- Okamura Corporation
- Krueger International (KI)
- Smith System, Inc.
- Irwin Seating Company
- Fleetwood Group
- Global Furniture Group
- Teknion Corporation
- Godrej Interio
- Virco Mfg. Corp.
- Classroom Select
- Edsal Manufacturing Co.
- Seats Inc.
- VS America
- Jiangsu Hongye Furniture
- Sedus Stoll AG
- Vitra International AG
- USM Modular Furniture
- Kimball International
- Fursys Inc.
- Bene Group

Market Opportunities and Future Outlook
A key whitespace is the services layer forming around sensor-enabled and data-ready products that help institutions manage hybrid utilization, maintenance, and space planning. In June 2026, ITOKI Corporation announced ITOKI OFFICE DEVICES, a sensor-based system integrated with office furniture to capture real-world usage data, showing how furniture makers can attach recurring software and analytics value to seating, desks, and collaborative zones rather than competing only on unit price. This aligns with the report theme that connected products are opening a utilization insights layer for clients, and it creates room for suppliers that can standardize hardware, use privacy-by-design data handling, and deliver dashboards for corporate offices and higher education hubs.
Manufacturing digitization and compliance-ready documentation are also turning into a practical opportunity as public-sector buyers ask for faster configuration support while compliance obligations tighten. The UK government-backed Made Smarter program renewal, confirmed in March 2026, provides furniture and joinery businesses access to structured digital transformation workshops and technology roadmaps, supporting operational upgrades such as scheduling, traceability, and quality systems that reduce rework and improve delivery reliability for large institutional projects. With online platforms and e-tendering shortening buying cycles for standard lines, suppliers that pair rapid quoting tools with documented material and emissions compliance can win share in cooperative and portal-driven purchasing while meeting project execution requirements.
Recent Industry Developments in Institutional Furniture Market
- July 2026: Perdue Office Interiors (Suddath) acquired American Business Interiors (ABI) to extend its commercial interiors coverage into Florida's Space Coast. The deal expands a Steelcase-aligned dealer's service footprint and reinforces the role of large dealer platforms in delivering turnkey institutional projects that require design, installation, and ongoing workplace support.
- May 2026: HNI Corporation reported first-quarter 2026 results and highlighted the termination of Steelcase's multi-year ERP implementation to streamline operations and eliminate further ERP investment. The move signals a tighter focus on operational simplification and cost discipline during integration, affecting lead times, order management, and network execution across major institutional furniture channels.
- August 2024: Humanscale launched a branded online store dedicated to refurbished office furniture. The initiative expands circular procurement options for institutions and supports take-back and refurbishment models that align with tender sustainability scoring and total cost-of-ownership priorities.


Institutional Furniture Market Report Scope and Research Methodology
Market Definition and Coverage
For this study, the institutional furniture market covers purpose-built, movable furniture bought for institutional settings such as schools, healthcare facilities, government and religious premises, and corporate offices. The focus is on heavy-use furniture that is typically specified to meet safety, fire, and ergonomic requirements.
Scope exclusions: We exclude household furniture and decor, kitchen cabinetry, and single-use decorative accessories that are not purchased under institutional specifications.
Segments Covered in This Report
-
By Product
- Chairs
- Tables
- Storage Units
- Sofas/Soft Seating
- Waiting Benches
- Other Products (stools, booths and partition, etc.)
-
By Material
- Metal
- Wood
- Plastic and Polymer
- Other Materials
-
By Price Range
- Economy
- Mid-range
- Premium
-
By End User
- Schools (K-12)
- Universities & Colleges
- Offices
- Healthcare Facilities (Hospitals, Clinics)
- Government & Public Administration
- Religious Institutions
- Others (Theaters & Auditoriums, etc.)
-
By Distribution Channel
- Direct Sales (from manufacturers to end-users)
- Dealer or Distributor Networks
- Online
- Other Distribution Channels (through government procurement portals, architectural firms or contractors, home centers, etc.)
-
By Geography
-
North America
- Canada
- United States
- Mexico
-
South America
- Brazil
- Peru
- Chile
- Argentina
- Rest of South America
-
Europe
- United Kingdom
- Germany
- France
- Spain
- Italy
- BENELUX (Belgium, Netherlands, and Luxembourg)
- NORDICS (Denmark, Finland, Iceland, Norway, and Sweden)
- Rest of Europe
-
Asia-Pacific
- India
- China
- Japan
- Australia
- South Korea
- South East Asia (Singapore, Malaysia, Thailand, Indonesia, Vietnam, and Philippines)
- Rest of Asia-Pacific
-
Middle East And Africa
- United Arab of Emirates
- Saudi Arabia
- South Africa
- Nigeria
- Rest of Middle East And Africa
-
North America
Data Sources, Market Sizing, and Validation
Desk Research
Desk work is used to build the initial market boundaries and the demand signals that explain why institutions buy furniture in each region. We typically begin with public construction and investment indicators, then connect education and healthcare capacity additions to furniture replacement and fit-out cycles.
Sources referenced include, for example, US Census Bureau construction statistics, International Trade Centre trade data for furniture categories, World Bank and OECD macro series used for normalization, and procurement and standards bodies such as BIFMA and FSC for specification context. We also review company annual reports, investor presentations, and reputable business press to understand channel structure and pricing direction, and we selectively use paid databases for company financials, patent intelligence, and shipment-level import and export checks where they help validate scale. These are illustrative sources only, and many other public and internal reference points are also used for data collection, validation, and clarification.
Primary Interviews and Surveys
Primary inputs are used to pressure-test the demand pool, replacement cadence, and price movement assumptions across key institutional end users. We speak with manufacturers, distributors, specifiers, facility managers, and procurement teams across major regions, and gaps from desk research are closed with confirmation of assumptions using real buying behavior.
Distribution of primary research fieldwork respondents
| Company type | Respondent position | Region |
|---|---|---|
| Top tier: 32% | CXOs: 22% | APAC: 45% |
| Mid tier: 46% | Functional/Unit leaders: 23% | EMEA: 37% |
| Smaller Players: 22% | Managers: 55% | Americas: 18% |
Market-Sizing & Forecasting
Sizing starts with a top-down build where institutional construction activity, facility expansion, and refurbishment intensity are translated into furniture demand by applying fit-out and replacement rates, then expressed in value using region-level pricing. The totals are corroborated with selective bottom-up approximations, such as sampled manufacturer and channel revenue roll-ups, and ASP times volume checks for high-use categories, which helps us adjust for undercounting in fragmented channels.
In the model, key inputs include institutional construction spending, additions in classrooms and hospital beds, office refurbishment and churn cycles, tender activity in public procurement, and reported pricing movement for wood, metal, and engineered materials that influence selling prices. Where direct volume visibility is limited, gaps are handled using proxy indicators like import trends for institutional-grade furniture categories and normalized spend-per-seat or spend-per-bed assumptions validated through interviews.
For forecasting, we rely on scenario analysis supported by multivariate regression for the larger regions because demand is tied to a small set of repeatable drivers, such as construction starts, public budget cycles, and replacement timing. Assumptions are kept consistent across regions, and changes are made only after the variable movements are explained and rechecked with primary respondents.
Data Validation & Update Cycle
Outputs are validated through multiple checks that compare the modeled totals to independent signals, such as trade flows, construction and institutional capacity series, and the direction of price inputs, and then reviewed again at the regional level before sign-off. When a variance looks unusual, we recheck the scope boundary, rerun the pricing and demand drivers, and re-contact sources if the gap cannot be explained by a clear market event.
The report is refreshed annually, and interim updates are made when material events change demand or pricing direction in a meaningful way. Before delivery, a final pass is completed so the latest macro indicators and any new procurement or standards developments are reflected in the numbers clients receive.
Mordor Intelligence's Institutional Furniture Market Size Compared Against Other Published Estimates
Published market sizes for institutional furniture often do not match because firms draw the boundary differently and use different validation evidence. The differences usually come from what settings are included, whether values reflect institutional-grade specifications, and how pricing is converted and updated across regions.
Trade-category imports and exports, along with construction and institutional capacity signals, are the evidence checks that keep Mordor Intelligence's estimate tied to institutional procurement volumes instead of narrower contract-only definitions. Other figures can also shift if they mix in only selected end uses, use a conservative or aggressive price progression, or do not refresh currency timing and material cost movement in the same way.
Benchmark comparison
| Source | Market Size | Gaps in Research Methodology |
|---|---|---|
| Mordor Intelligence | USD 244.65 B (2026) | |
| Market Database A | USD 26.30 B (2025) | Uses a much narrower revenue pool and appears to treat institutional furniture as a limited set of applications, which can exclude broad corporate office and large-scale institutional fit-outs counted in wider definitions. |
| Industry Statistics Portal B | USD 9.60 B (2024) | Tracks institutional contract furniture only, which typically excludes parts of institutional purchasing that occur through non-contract channels and may omit several institutional settings included in full market coverage. |
The spread in values mainly reflects scope boundaries, especially whether the estimate is limited to institutional contract furniture or expanded to cover full institutional-grade purchasing across offices, education, healthcare, and public facilities. When the scope is made explicit and checked against measurable demand signals and pricing logic, the final market size becomes easier to reproduce and to compare across regions.


Key Questions Answered in the Report
What is the current value of the institutional furniture market?
The institutional furniture market is valued at USD 244.65 billion in 2026 and is projected to reach USD 333.59 billion by 2031.
Which region is growing fastest?
Asia-Pacific posts the quickest trajectory with a forecast 7.12% CAGR driven by urbanization and government infrastructure spend.
What product segment is expected to grow most rapidly?
Sofas and other soft seating lead growth at a 7.03% CAGR as institutions redesign collaborative and waiting areas for comfort and flexibility.
How are sustainability requirements shaping procurement?
FSC, GREENGUARD, and BIFMA LEVEL certifications are now baseline tender requirements, and several manufacturers are eliminating chemicals such as PFAS to win bids.
Page last updated on:


 Your data is secure and never sold or shared.


