
Inspection Machines Market Size and Share
Market Overview
| Study Period | 2020 - 2031 |
|---|---|
| Market Size (2026) | USD 34.62 Billion |
| Market Size (2031) | USD 47.51 Billion |
| Growth Rate (2026 - 2031) | 6.53 % |
| Fastest Growing Market | Asia-Pacific |
| Largest Market | North America |
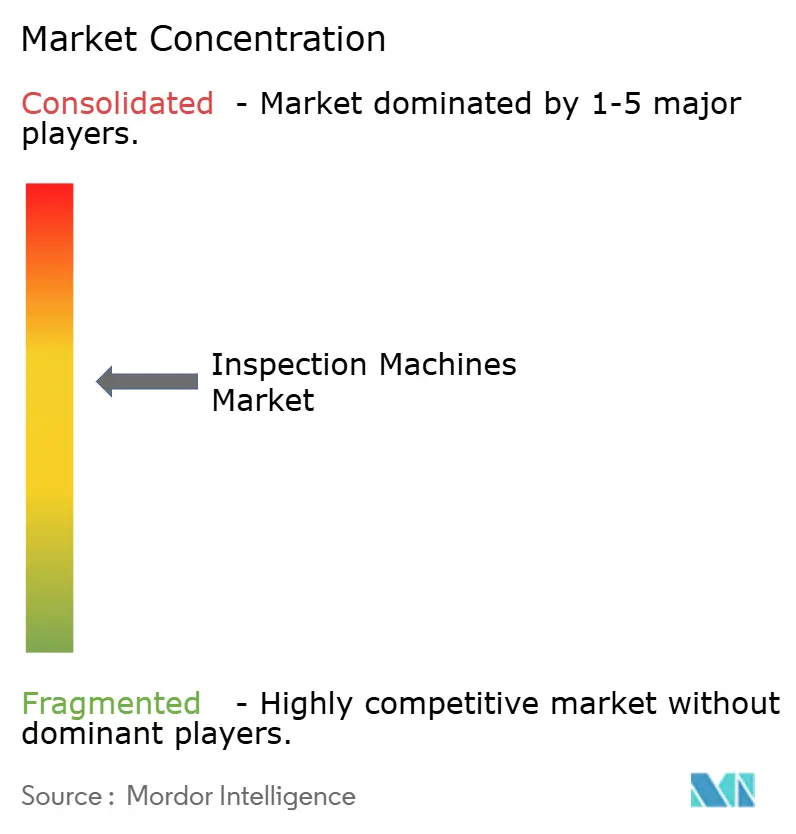
| Market Concentration | Medium |
Major Players *Disclaimer: Major Players sorted in no particular order Image © Mordor Intelligence. Reuse requires attribution under CC BY 4.0. | |
Inspection Machines Market Analysis by Mordor Intelligence
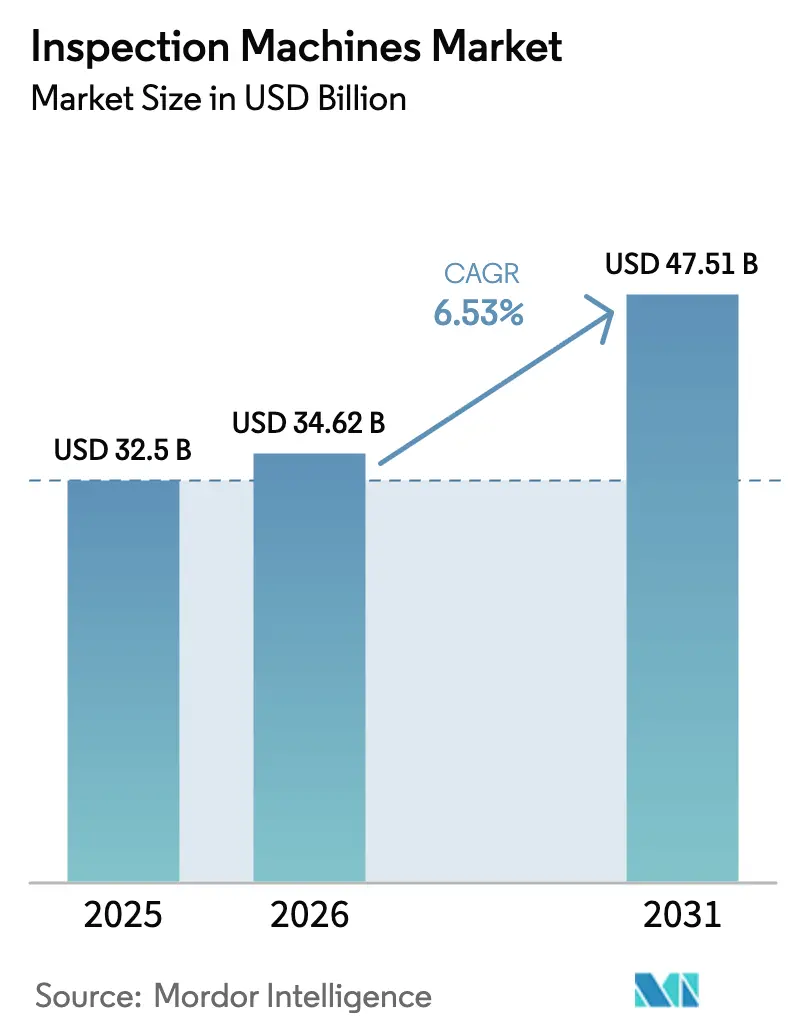
The Inspection Machines Market size is projected to be USD 32.5 billion in 2025, USD 34.62 billion in 2026, and reach USD 47.51 billion by 2031, growing at a CAGR of 6.53% from 2026 to 2031.
In fiscal 2024, the U.S. FDA heightened regulatory scrutiny by issuing 105 warning letters and resuming unannounced foreign inspections, driving increased capital expenditures. Concurrently, the European Union's Falsified Medicines Directive (FMD) and the U.S. Drug Supply Chain Security Act (DSCSA) are enforcing stricter requirements for unit-level serialization and defect detection. Edge-AI engines are now processing hyperspectral images in under 50 milliseconds, delivering a 30%-40% reduction in false-positive reject rates compared to rule-based systems. Contract development and manufacturing organizations (CDMOs) are streamlining operations by standardizing integrated vision, X-ray, and checkweigher platforms to accelerate tech-transfer timelines. Biologics manufacturers are adopting laser-based particle counters to ensure compliance with USP <788>/<1787> particulate limits. Capital requirements remain substantial, with fully validated multi-technology lines often surpassing USD 5 million. Furthermore, the addition of IEC 62443 cyber-security certification introduces extra validation layers. Despite these costs, manufacturers justify the investments, as a single Class I recall can result in losses exceeding USD 50 million.
Key Report Takeaways
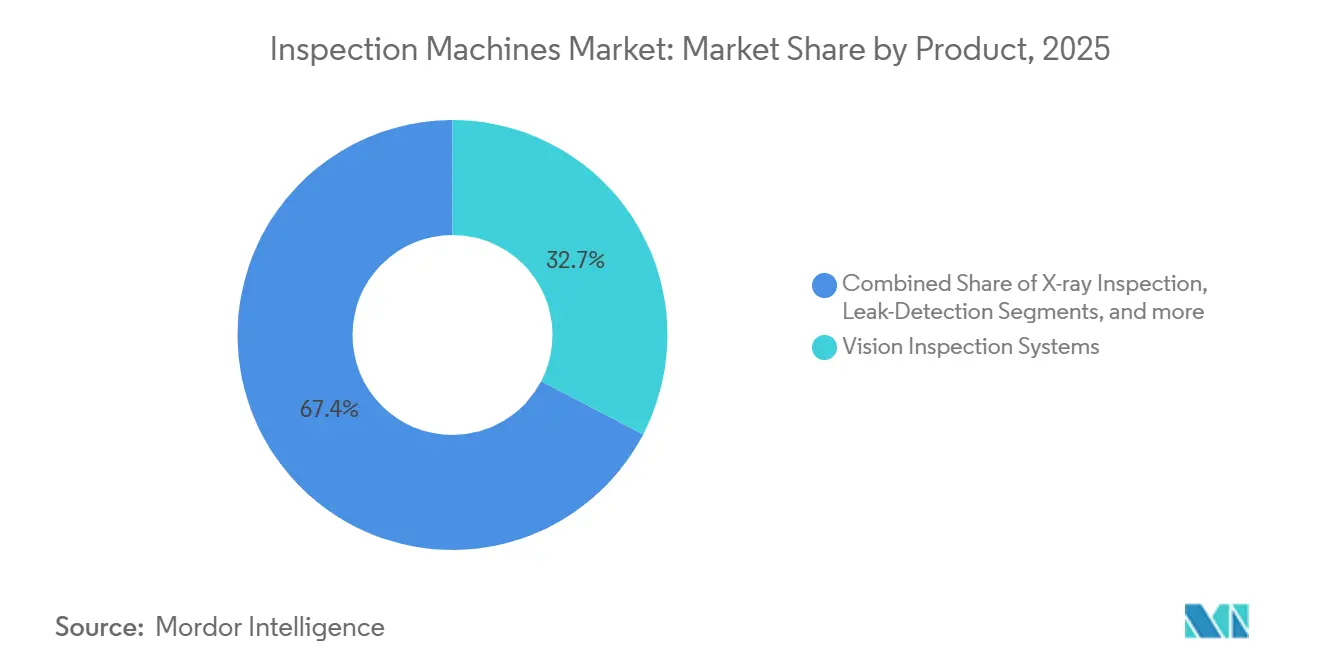
- By product category, vision inspection systems led with 32.65% revenue share in 2025, while X-ray platforms are projected to expand at an 8.54% CAGR through 2031.
- By machine type, fully automated architectures accounted for 56.43% of the inspection machines market in 2025 and are advancing at a 8.21% CAGR over 2026-2031.
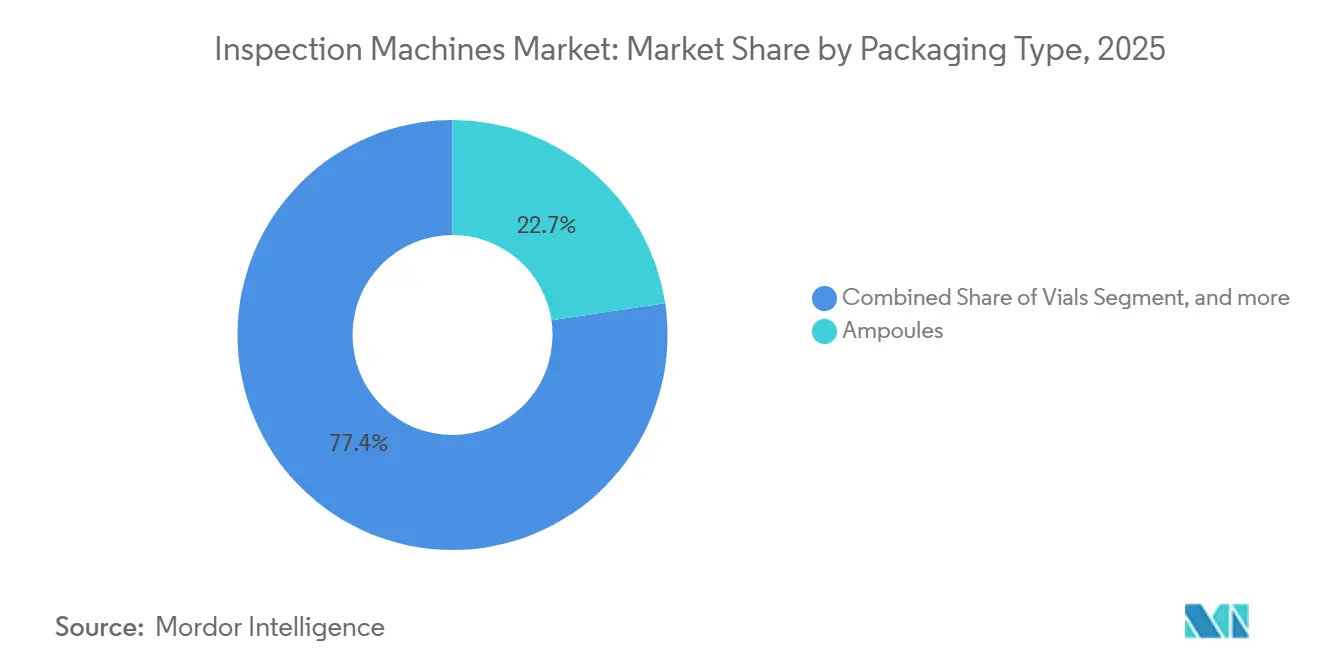
- By packaging type, ampoules retained 22.65% share of the inspection machines market size in 2025, whereas syringes and cartridges are forecast to grow at an 8.87% CAGR to 2031.
- By end user, pharmaceutical manufacturers held 68.65% share in 2025 and CDMOs are expected to record the fastest 9.32% CAGR through 2031.
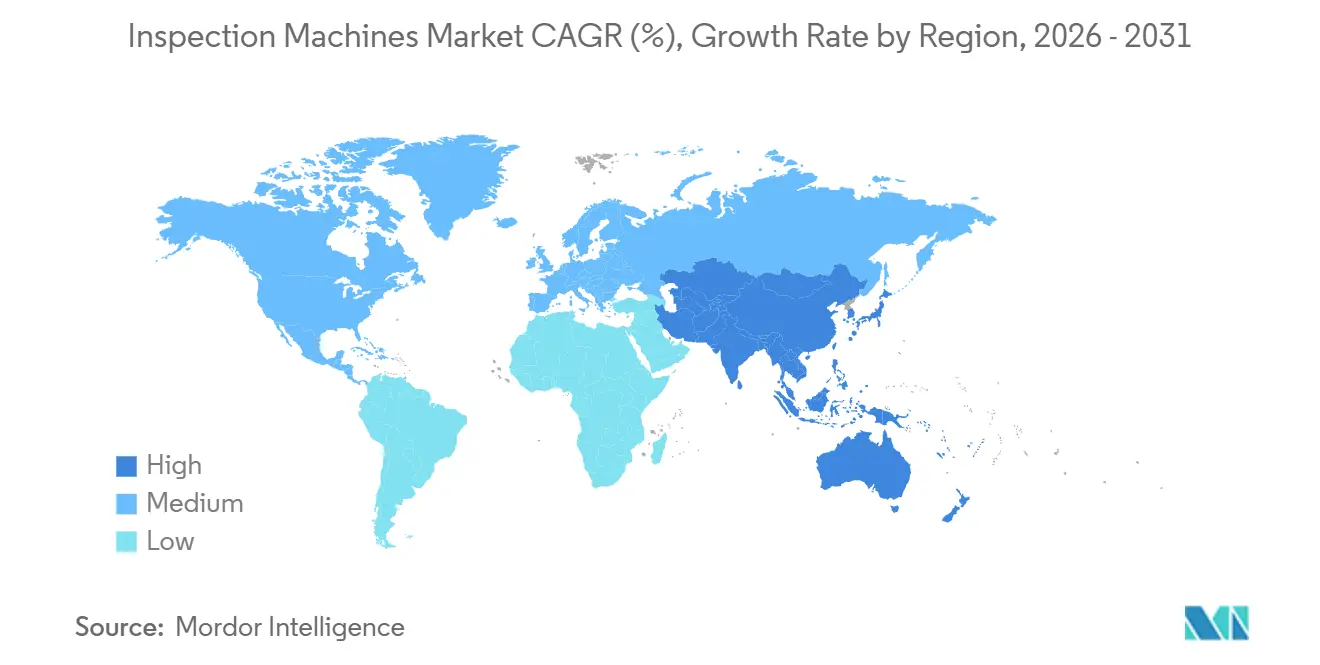
- By geography, North America captured 42.76% inspection machines market share in 2025, while Asia-Pacific is set to post a 7.43% CAGR through 2031.
Note: Market size and forecast figures in this report are generated using Mordor Intelligence’s proprietary estimation framework, updated with the latest available data and insights as of January 2026.
Market Trends and Insights
Drivers Impact Analysis of Inspection Machines Market*
| Driver | (~) % Impact on CAGR Forecast | Geographic Relevance | Impact Timeline |
|---|---|---|---|
| Stringent Regulatory Compliance Requirements | +1.8% | Global, peak enforcement in North America & EU | Medium term (2-4 years) |
| Rising Global Product Recall Incidents | +1.2% | Global, acute in North America | Short term (≤ 2 years) |
| Growing Adoption of Production-Line Automation | +1.0% | North America, EU, Japan, high-labor-cost APAC | Medium term (2-4 years) |
| Increased Implementation of Pharmaceutical Serialisation Programs | +1.5% | North America, EU, China | Medium term (2-4 years) |
| Deployment of Edge-AI for Real-Time Defect Analytics | +1.1% | North America & APAC core, spill-over to EU | Long term (≥ 4 years) |
| Emergence of Hyperspectral 3-D Vision Technologies | +0.9% | Early adoption in EU, Japan; pilots in North America | Long term (≥ 4 years) |
| Source: Mordor Intelligence | |||
Stringent Regulatory Compliance Requirements
Regulators are intensifying inspection protocols to address data-integrity issues and restore trust in the drug manufacturing process. In 2024, the FDA conducted 621 foreign inspections, marking a 28% increase from 2023, and issued 105 warning letters targeting unvalidated automated systems under 21 CFR Part 11. In January 2025, China’s NMPA updated GMP Annex 1, requiring 100% automated visual inspection for parenterals and proof of statistical control across three consecutive validation batches[1]. Additionally, the EMA’s EUDAMED database, launched in May 2025, now links adverse-event reports to plant identifiers, increasing scrutiny of facilities with high reject ratios. To comply with these evolving regulations, vendors are integrating time-stamped audit-trail modules that record every image, decision, and operator override. These measures help companies address FDA Form 483 citations and maintain ISO 13485 certification. The regulatory demands are driving retrofits in legacy plants and accelerating capital investments in new facilities, particularly among CDMOs managing multiple sponsor quality systems.
Rising Global Product Recall Incidents
In fiscal 2024, the FDA initiated 260 drug recalls, primarily driven by labeling errors, particulate contamination, and container-closure failures. Class I recalls accounted for 18% of these cases, up from 12% in 2023. A notable recall in January 2025 involved 1.2 million epinephrine syringes due to contamination with glass fragments, prompting the implementation of laser-diffraction counters and stricter reject verification protocols. Regulatory responses to nitrosamine contamination incidents from 2019 to 2023 have led to mandates for hyperspectral near-infrared spectroscopy to confirm active pharmaceutical ingredients (APIs), addressing limitations in standard vision systems. The financial impact of a single Class I recall can exceed USD 50 million, including product recall costs, fines, and lost sales. Consequently, investments in AI-enabled inspection lines, often costing over USD 3 million, are increasingly justified. Additionally, insurers are adjusting liability premiums based on the validation status of inspection systems, further incentivizing manufacturers to adopt advanced analytics and online statistical process control.
Growing Adoption of Production-Line Automation
Unit-level serialization has transformed inspection workflows, driving efficiency and compliance. With the full enforcement of the DSCSA in November 2024, U.S. dispensers are required to verify product IDs, while manufacturers must maintain interoperable electronic records. The EU's Falsified Medicines Directive (FMD) now covers 47 countries, achieving 10 billion identifier scans in 2025 through the European Medicines Verification System. In China, regulations will mandate the use of 2D Data Matrix codes on all prescription drugs by December 2026. Antares Vision reported that 68% of its 2025 backlog consisted of integrated inspection-serialization lines, reflecting strong demand for compact systems and streamlined validation processes. Additionally, edge modules with on-device code verification eliminate cloud latency on high-speed blister or bottle lines, reducing false rejects and enhancing overall equipment effectiveness.
Increased Implementation of Pharmaceutical Serialisation Programs
Edge architectures are transforming neural-network inference by integrating it into embedded controllers, enabling significant latency reduction and real-time optimization of illumination, exposure, and rejection criteria. Cognex’s In-Sight D900, introduced in March 2025, delivers a remarkable 99.7% classification accuracy on a dataset of 500,000 defect images. Keyence’s XG-X system leverages hyperspectral imaging to detect sub-50 µm cracks in glass syringes, identifying defects that RGB cameras cannot capture. By retaining data on-premises, edge devices ensure compliance with IEC 62443-4-2 standards while streamlining cyber-security audits. Manufacturing plants have reported a 30%-40% decrease in false positives, resulting in cost savings of USD 200,000-USD 500,000 per production line, particularly when dose values exceed USD 1,000. These cost efficiencies are especially critical in biologics and gene-therapy production, where the loss of even a single vial represents a substantial financial impact.
Restraints Impact Analysis of Inspection Machines Market*
| Restraint | (~) % Impact on CAGR Forecast | Geographic Relevance | Impact Timeline |
|---|---|---|---|
| High Capital Expenditure & Lengthy Validation Cycles | -0.9% | Global, acute in emerging APAC markets | Short term (≤ 2 years) |
| Availability of Lower-Cost Refurbished Equipment | -0.4% | Latin America, Middle East, parts of APAC | Short term (≤ 2 years) |
| Integration Challenges with Legacy MES | -0.3% | Mature plants in North America & EU | Medium term (2-4 years) |
| Cyber-Security Concerns in Connected Inspection Ecosystems | -0.6% | North America & EU, emerging in APAC | Medium term (2-4 years) |
| Source: Mordor Intelligence | |||
Availability of Lower-Cost Refurbished Equipment
Integrated inspection lines, combining vision, X-ray, and weighing technologies, are priced at over USD 5 million. Implementing full IQ-OQ-PQ protocols, in line with FDA 21 CFR Part 11, EU Annex 11, and ISO 13485, typically requires 12-18 months. Consequently, cost-sensitive generic manufacturers are opting for semi-automated benches priced between USD 100,000 and USD 300,000, though these systems lack serialization capabilities. Refurbished systems, offered at 40%-50% discounts, drive fragmented demand across Latin America, the Middle East, and parts of the Asia-Pacific. However, challenges such as parts shortages and software obsolescence pose risks to audit readiness. Establishing statistical equivalence across ampoules, vials, and syringes increases the need for additional camera setups, lighting profiles, and defect libraries. This complexity gives large multinationals with dedicated validation teams a competitive edge, further widening the technology gap between tier-1 and tier-2 firms.
Cyber-Security Concerns in Connected Inspection Ecosystems
Integrating inspection lines with MES and cloud analytics has increased OT networks' exposure to ransomware attacks and data breaches. The IEC 62443-4-2 standard, introduced in October 2024, defines security levels for automation components. However, as of early 2026, fewer than 30% of operational pharmaceutical inspection systems comply with SL 2 requirements. In February 2025, a ransomware attack targeted a European CDMO, encrypting vision-system files and shutting down four fill-finish lines for 72 hours, resulting in a revenue loss of USD 8 million. Manufacturers remain cautious about networking legacy equipment without implementing hardware security modules, intrusion detection systems, and segmented zones, which can increase costs by USD 200,000 to USD 500,000 per line, along with additional re-validation expenses. Smaller vendors face difficulties securing IEC certification, creating barriers to entry that protect established players while slowing the adoption of AI-ready, cloud-enabled systems.
*Our forecasts treat driver/restraint impacts as directional, not additive. The impact forecasts reflect baseline growth, mix effects, and variable interactions.
Inspection Machines Market Segment Analysis
By Product:
X-Ray Platforms Accelerate Amid Integrity MandatesX-ray systems are forecast to grow at an 8.54% CAGR, eclipsing the 6.53% pace of the overall inspection machines market, because regulators now require 100% container-closure-integrity checks for lyophilized oncology and gene-therapy vials. Vision inspection dominated the inspection machines market with 32.65% market share in 2025, given its breadth across cosmetic and label tasks, but its inability to detect subsurface cracks is ceding ground to dual-energy X-ray platforms such as Mettler-Toledo’s X38, which scans 400 syringes per minute.
Laser-diffraction particle counters and hyperspectral imagers command high price premiums, confining uptake to biologics and counterfeit-detection lines. Leak testers using vacuum decay or helium mass spectrometry remain niche for now due to slow cycle times. Combination checkweigher-vision-X-ray units appeal to CDMOs seeking narrow footprints and simplified validation, with WIPOTEC-OCS booking a 42% rise in 2025 orders.

By Machine Type:
Automation Captures Labor-Driven GainsFully automated equipment held 56.43% inspection machines market size in 2025 and is projected to post an 8.21% CAGR to 2031 as Western labor inflation makes robotic loading attractive for batches above 50,000 units. Removing three to four operators per shift saves USD 300,000-USD 500,000 annually in Europe and USD 150,000-USD 250,000 in the U.S., offsetting capex quickly.
Semi-automated rigs suit mid-volume generics producers constrained by budget yet wary of manual inspection’s compliance risks. Benchtop systems under USD 150,000 remain relevant for clinical-trial material but lack electronic audit trails and serialization hooks, limiting scalability. Retrofit kits that bolt AI vision onto semi-automated frames help owners extend asset life while improving data integrity.
By Packaging Type:
Syringes & Cartridges Outpace Legacy GlassAmpoules led revenue with 22.65% market share in inspection machines in 2025, yet syringes and cartridges will grow fastest at an 8.87% CAGR through 2031 as drug makers pivot to ready-to-administer formats that cut dosing errors. Vials still dominate lyophilized biologics and vaccine workflows, necessitating X-ray vacuum checks for stopper integrity and vision cameras for crimp quality.
Pre-filled syringes for subcutaneous biologics and autoinjectors require 360-degree cosmetic scans and needle-shield verification. Cartridges used in pen injectors require API uniformity checks via hyperspectral imaging. Blister packs and bottles continue to rely on high-speed vision and checkweighers, but growth lags as oral solid doses face price pressure and fewer pipeline innovations.
By End User:
CDMOs Capture Outsourced MomentumPharmaceutical manufacturers accounted for 68.65% of 2025 revenue, but CDMOs will expand the fastest at a 9.32% CAGR as sponsors outsource fill-finish to partners with validated infrastructure. The BIOSECURE Act accelerated reshoring to U.S. CDMOs, many of which invested in fully automated cells linked to electronic batch records.
CDMOs amortize equipment across multiple clients, easing capital burdens and fostering rapid tech adoption, such as edge AI and hybrid platforms. Virtual pharmaceutical firms that outsource all manufacturing amplify this effect, diverting inspection demand from captive plants to contract providers. Biotechnology companies often straddle both models: leasing CDMO capacity for clinical stages, then repatriating processes at launch, creating a two-wave buying pattern.
Geography Analysis
North America Inspection Machines Market
North America retained 42.76% of global revenue in 2025, buoyed by the DSCSA’s serialization deadline and BIOSECURE Act incentives that steered fill-finish contracts to domestic CDMOs. Seven Mexican greenfield projects announced in 2024-2025 will install over USD 200 million in automated inspection by 2027, while Canada leverages regulatory harmonization to streamline validation.
APAC Inspection Machines Market
Asia-Pacific is set to log the fastest 7.43% CAGR to 2031, driven by China’s December 2026 serialization cutoff and India’s goal to add 200 WHO-prequalified injectable sites by 2028. Japan and South Korea deploy AI analytics to mitigate labor shortages and sustain biologics exports, whereas capital constraints and refurbished imports shape demand in Southeast Asia.
EMEA and South America Inspection Machines Market
Europe represented roughly 28% of 2025 sales. Germany leads Industry 4.0 integration, yet IEC 62443 cyber rules add USD 200,000-USD 500,000 per line. The U.K.’s post-Brexit divergence doubles validation for dual-market suppliers, and southern Europe upgrades legacy vision systems to meet FMD codes. The Middle East, Africa and South America remain emerging territories, balancing price with compliance through semi-automated or refurbished purchases.
Regulatory Landscape
Regulatory requirements for inspection machines are tightening across both pharmaceutical production and regulated medical-device manufacturing, increasing the emphasis on validated systems that can support data integrity and traceability. In the United States, FDA enforcement intensity has focused on automated systems under 21 CFR Part 11, and the Quality Management System Regulation (QMSR) becoming effective in February 2026 reinforces this direction by incorporating ISO 13485:2016 into 21 CFR Part 820 and updating the Inspection of Medical Device Manufacturers Compliance Program (CP 7382.850).
In Europe, MDR (Regulation (EU) 2017/745) continues to shape quality and documentation demands for device manufacturers, and the European Commission adopted Commission Implementing Regulation (EU) 2026/977 in May 2026 to set uniform requirements for notified bodies performing conformity assessment activities. Together with pharma-focused serialization regimes such as the EU Falsified Medicines Directive and the US DSCSA, these updates support demand for inspection machines that produce time-stamped, auditable records and can be deployed with cybersecurity-aligned configurations in connected production environments.
Value Chain Analysis
The inspection machines value chain begins with upstream suppliers of imaging sensors, optics, lighting, X-ray sources/detectors, precision mechanics, robotics, and embedded compute, then moves to OEM design and software development, including vision or AI algorithms, audit trails, and recipe management, followed by factory acceptance testing. Component availability for specialized chips and high-performance imaging parts remains a key dependency, and it affects lead times for new builds as well as retrofits.
Midstream, OEMs and automation specialists integrate inspection platforms into packaging and fill-finish lines, then support validation (IQ/OQ/PQ) against requirements such as FDA 21 CFR Part 11, EU Annex 11 expectations for computerized systems used in GMP, and ISO 13485 practices. Downstream, pharmaceutical manufacturers, biotechnology companies, and CROs/CDMOs procure inspection systems as standalone units or as integrated inspection-serialization cells, typically through direct sales with application engineering and global service coverage, while value increasingly shifts toward connectivity layers linking inspection outcomes to MES, electronic batch records, and serialization repositories.
Competitive Landscape
The inspection machines market is moderately concentrated, with top suppliers Körber, Antares Vision, Mettler-Toledo, Cognex, and Thermo Fisher collectively accounting for 45%-50% of global revenue. However, none of these players holds more than a 15% share. These incumbents maintain their competitive edge through proprietary software, global service networks, and turnkey validation solutions compliant with 21 CFR Part 11 and EU Annex 11. Meanwhile, challengers such as Keyence and Omron are targeting greenfield CDMO and biotech projects by leveraging deep learning and edge AI technologies. WIPOTEC-OCS is capitalizing on the growing demand for combination platforms, reporting a 42% increase in orders for 2025.
Technology remains the primary differentiator in this market. Cognex’s In-Sight D900 neural network, for example, has reduced false rejects by 35%, enabling it to replace legacy systems at three European CDMOs. The competition in R&D is intensifying, as evidenced by a surge in hyperspectral and laser-particle patents, with 127 global grants recorded for 2024-2025. Smaller vendors are facing rising costs associated with AI and service offerings, driving market consolidation. Teledyne’s 2024 acquisition of TapTone to enhance its leak-test portfolio exemplifies this trend.
Cybersecurity has become a critical factor for market players. Körber’s VIS 300 edge-AI line achieved IEC 62443-4-2 SL 2 certification in 2025, securing EUR 22 million (USD 24 million) in European orders. Vendors lacking strong cybersecurity credentials risk being excluded from tenders as regulators and insurers impose stricter requirements on OT-network security.
Inspection Machines Industry Leaders
-
Robert Bosch GmbH
-
Cognex Corporation
-
Mettler-Toledo International Inc
-
Jekson Vision
-
Körber AG
- *Disclaimer: Major Players sorted in no particular order
Inspection Machines Market Companies Covered in this Report
- ACG Worldwide
- Anritsu Corporation
- Antares Vision Group
- Brevetti CEA SpA
- CMP Phar.ma
- Cognex
- Ishida Co. Ltd
- Jekson Vision
- Keyence Corporation
- Körber AG (Seidenader)
- Mettler Toledo
- Minebea Intec
- OMRON
- OPTEL Group
- Sesotec GmbH
- TapTone (Teledyne)
- Teledyne Technologies
- Thermo Fisher Scientific
- Uhlmann Pac-Systeme
- WIPOTEC-OCS
Market Opportunities and Future Outlook
Regulatory harmonization and rising audit-readiness expectations create a clearer target for inspection vendors that can bundle validated hardware with digital evidence generation, including time-stamped image retention, electronic audit trails, and cybersecurity-aligned configurations. The February 2026 FDA QMSR shift to ISO 13485:2016 by reference also raises the bar for medical-device manufacturers, which supports demand for inspection systems that can generate objective inspection and metrology records without relying on heavy manual intervention.
A second opportunity cluster is centered on integrated automation and edge-AI architectures that reduce false rejects and help streamline tech transfer, especially for CDMOs standardizing platforms across multiple clients. Market activity supporting this direction includes Optimax launching the AURA K4D automated system in May 2026 to combine defect identification and metrology in one workflow, along with large-scale manufacturing expansions that embed modern automation, cleanroom, and metrology capabilities, such as Otsuka ICU Medical LLC announcing an over USD 500 million IV solutions manufacturing expansion in July 2026 in North America. These moves point to continued demand for scalable inspection platforms that unify vision, X-ray, and leak detection with data connectivity to speed qualification and support more consistent outcomes in high-throughput regulated production.
Recent Industry Developments in Inspection Machines Market
- May 2026: Cognex launched the In-Sight 3900 embedded AI vision system powered by Qualcomm Dragonwing platforms. The release supports the shift toward compact, embedded edge-AI inspection nodes that reduce reliance on external PCs and help simplify validation and line integration for high-speed inspection applications.
- April 2026: Cognex launched the In-Sight 6900 Vision Controller powered by NVIDIA Jetson technology to deliver higher-capacity AI processing at the edge. This expands capacity for advanced defect classification and supports faster on-line decisioning where inference latency and local data processing matter for regulated manufacturing environments.
- March 2025: Cognex introduced OneVision, a cloud platform for AI-powered machine vision. The platform-level move supports standardization of model development and deployment across multiple plants and lines, aligning with the growing need for traceability and scalable inspection program management.
Inspection Machines Market Report Scope and Research Methodology
Market Definition and Coverage
For this methodology, the inspection machines market covers factory-deployed systems used to detect defects, contamination, or packaging issues during or after production. It includes inspection hardware with the required control software modules.
Scope exclusions: We exclude standalone handheld testers, refurbished equipment, on-site service contracts, and aftermarket spare parts.
Segments Covered in This Report
- By Product
- Vision Inspection Systems
- X-Ray Inspection Systems
- Leak-Detection Systems
- Metal Detectors
- Combination Checkweigher-Vision-X-Ray Systems
- Other Inspection Systems
- By Machine Type
- Fully-Automated
- Semi-Automated
- Manual / Benchtop
- By Packaging Type
- Ampoules
- Vials
- Blister Packs
- Syringes & Cartridges
- Bottles & Containers
- By End User
- Pharmaceutical Manufacturers
- Biotechnology Companies
- CROs & CDMOs
- Geography
- North America
- United States
- Canada
- Mexico
- Europe
- Germany
- United Kingdom
- France
- Italy
- Spain
- Rest of Europe
- Asia-Pacific
- China
- Japan
- India
- Australia
- South Korea
- Rest of Asia-Pacific
- Middle East & Africa
- GCC
- South Africa
- Rest of Middle East & Africa
- South America
- Brazil
- Argentina
- Rest of South America
- North America
Data Sources, Market Sizing, and Validation
Desk Research
Desk research built the starting structure for the market, especially for which industries buy inspection machines and how demand moves with manufacturing output. We reviewed public and official sources such as US Census Bureau manufacturing statistics, Eurostat production data, UN Comtrade trade flows, the US FDA recalls database, and ISO publications that describe common inspection and quality requirements.
To link demand to supply-side realities, we also used company annual reports, investor presentations, technical brochures, and trusted press coverage of plant expansions and compliance actions. Where available, we referenced paid databases for company financials and news screening, patent activity, and shipment-level import and export checks to validate installed-base signals. This list is not exhaustive, and we reviewed additional sources for data collection, validation, and clarification.
Primary Interviews and Surveys
Primary work focused on validating what gets counted as an inspection machine sale, and how pricing changes by application and compliance requirements. We spoke with a mix of machine makers, automation partners, distributors, and quality managers across major manufacturing hubs, which helped us close gaps on adoption rates, replacement cycles, and typical system configurations by end use.
Distribution of primary research fieldwork respondents
| Company type | Respondent position | Region |
|---|---|---|
| Top tier: 25% | CXOs: 15% | APAC: 48% |
| Mid tier: 56% | Functional/Unit leaders: 34% | EMEA: 32% |
| Smaller Players: 19% | Managers: 51% | Americas: 20% |
Market-Sizing & Forecasting
Sizing was built using a top-down approach where manufacturing activity and compliance-driven inspection intensity were used to reconstruct demand by region, before translating totals into revenue using realistic price bands. To keep the model grounded, we corroborated the totals using selective bottom-up checks such as sampled supplier revenue splits, channel feedback on order volumes, and ASP times unit shipments for common machine categories.
Key inputs included manufacturing production indices, recall and quality incident trends that trigger inspection upgrades, automation investment cycles, typical replacement and calibration-driven refresh periods, and pricing moves tied to sensor and camera bill-of-material costs. Where product mixes were unclear, we used conservative mix assumptions, then adjusted them after interview feedback and trade-flow direction checks.
For forecasting, we used scenario analysis informed by expert consensus on how fast regulated manufacturing expands, how quickly automated inspection penetrates mid-sized plants, and how pricing shifts as software functions increase. The final outlook was checked for realism against regional capacity additions and equipment lead-time commentary captured during interviews.
Data Validation & Update Cycle
Outputs were checked through triangulation across at least three angles, namely demand indicators, supply-side signals, and pricing reality checks, followed by a variance scan to flag outliers by region and end use. When a region showed a jump that did not match manufacturing output, trade movement, or interview commentary, we revisited assumptions and corrected the underlying driver.
Before sign-off, the model goes through multi-step analyst review where calculations, unit conversions, and currency timing are rechecked, and any large changes versus the prior edition are documented. Reports are refreshed annually, with interim updates made when material events occur such as major regulatory shifts, large plant closures, or step changes in equipment pricing. Right before delivery, we run a final pass so clients receive the latest updated view.
Mordor Intelligence's Inspection Machines Market Size Compared With Other Published Estimates
Published market sizes for inspection machines can look far apart because the term is used loosely, and some studies bundle in adjacent automation or quality categories without stating it clearly. Differences can also come from the chosen base year, currency timing, and whether pricing is modeled as a simple uplift or rebuilt from application-level price bands.
By tracking the included machine types and refresh cadence in the model, Mordor Intelligence keeps the total tied to factory-installed vision, X-ray, leak detection, checkweighing, and metal detection systems, instead of counting service revenue or refurbished equipment that can inflate totals.
Benchmark comparison
| Source | Market Size | Gaps in Research Methodology |
|---|---|---|
| Mordor Intelligence | USD 34.62 B (2026) | |
| Trade Journal A | USD 4.71 B (2025) | Often narrower scope that reads closer to automatic inspection machines used mainly in discrete manufacturing, and it may exclude checkweighers, metal detection, and regulated packaging inspection use cases. |
| Industry Research Publisher B | USD 0.84 B (2024) | Typically limited to a subset of inspection systems sold into a few end uses, with reduced regional coverage and less explicit treatment of software modules and installed line integration. |
The spread in the table is mainly explained by what each source counts as an inspection machine and whether adjacent revenues are included. Our approach stays repeatable because the totals are built from clear demand drivers, practical price bands, and documented exclusions, which makes the estimate easier to audit and update year after year.
Key Questions Answered in the Report
What is the current value of the inspection machines market?
The inspection machines market size stands at USD 34.62 billion in 2026.
How fast is demand for X-ray inspection equipment growing?
X-ray platforms are forecast to expand at an 8.54% CAGR through 2031.
Which region shows the highest growth momentum?
Asia-Pacific is projected to record a 7.43% CAGR on the back of China and India's regulatory upgrades.
Why are CDMOs increasing their share of equipment purchases?
Sponsors outsource fill-finish, and CDMOs spread inspection capex across multiple clients, driving a 9.32% CAGR for the segment.
How does edge-AI improve inspection performance?
Edge-AI cuts inference latency below 50 milliseconds and lowers false-positive rejects by up to 40%, boosting yield and compliance.