
Insomnia Treatment Market Size and Share
Market Overview
| Study Period | 2020 - 2031 |
|---|---|
| Market Size (2026) | USD 3.95 Billion |
| Market Size (2031) | USD 5.07 Billion |
| Growth Rate (2026 - 2031) | 5.09 % |
| Fastest Growing Market | Asia-Pacific |
| Largest Market | North America |
| Market Concentration | Low |
Major Players *Disclaimer: Major Players sorted in no particular order Image © Mordor Intelligence. Reuse requires attribution under CC BY 4.0. | |
Insomnia Treatment Market Analysis by Mordor Intelligence
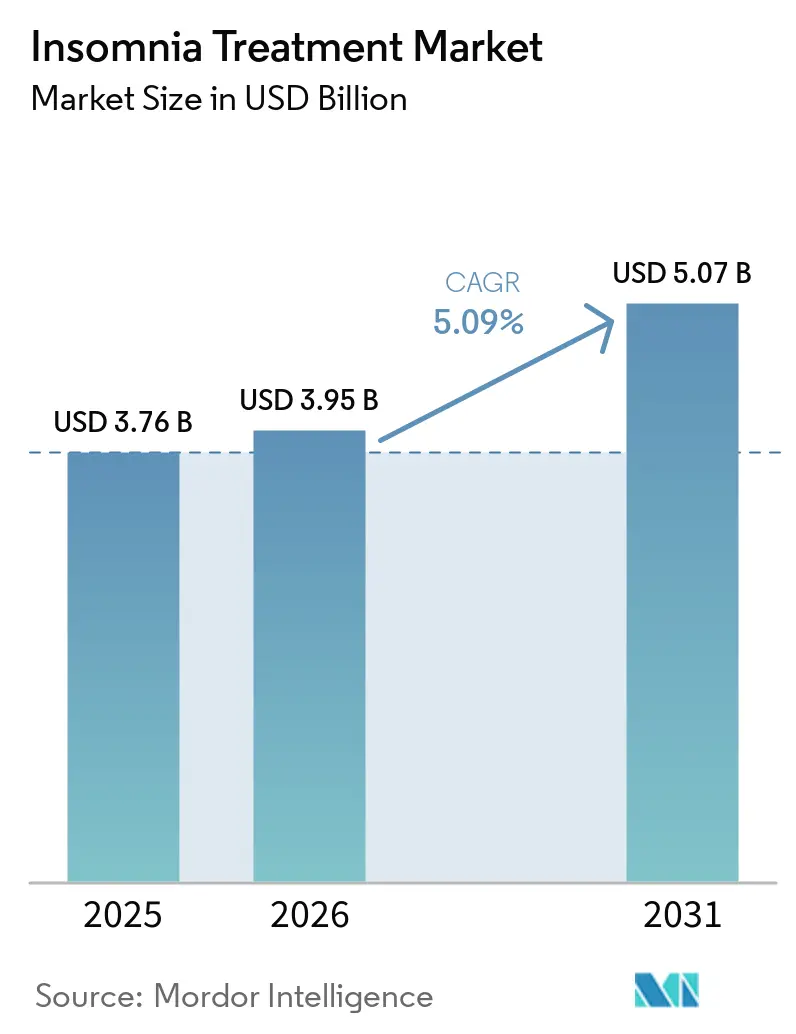
The insomnia treatment market size is expected to grow from USD 3.76 billion in 2025 to USD 3.95 billion in 2026 and is forecast to reach USD 5.07 billion by 2031 at 5.09% CAGR over 2026-2031. Demographic aging, higher stress levels, and accelerating digital therapeutics adoption are combining to lift prescription volumes, expand non-drug options, and open new reimbursement pathways. Dual orexin receptor antagonists are reshaping clinical practice by improving sleep architecture without the dependency risks of long-standing hypnotics, while employer‐sponsored wellness programs expand patient access. Remote monitoring devices, artificial-intelligence-driven phenotyping, and expanding telehealth coverage further reinforce a technology‐enabled growth flywheel that favors integrated care platforms. Cannabis-based over-the-counter alternatives, heightened payer scrutiny of chronic pharmacotherapy, and generic erosion following patent expiries temper upside but do not derail the mid-single-digit trajectory.
Key Report Takeaways
- By treatment type, pharmacological products captured 76.72% of insomnia treatment market share in 2025; non-pharmacological options are advancing at a 5.39% CAGR through 2031.
- By insomnia type, primary cases led with 61.88% revenue share in 2025, while comorbid insomnia is projected to expand at a 5.98% CAGR to 2031.
- By patient age group, adults commanded 56.13% of the insomnia treatment market size in 2025; pediatric use is the fastest-growing cohort, rising at a 5.83% CAGR to 2031.
- By care setting, outpatient and ambulatory channels generated 63.27% of 2025 revenue; homecare and self-administration are forecast to grow at 6.14% CAGR through 2031.
- By geography, North America accounted for 37.64% of 2025 revenue, while Asia-Pacific is set to lead growth at a 6.63% CAGR throughout the forecast horizon.
Note: Market size and forecast figures in this report are generated using Mordor Intelligence’s proprietary estimation framework, updated with the latest available data and insights as of 2026.
Market Trends and Insights
Drivers Impact Analysis of Insomnia Treatment Market*
| Driver | (~) % Impact on CAGR Forecast | Geographic Relevance | Impact Timeline |
|---|---|---|---|
| Rising prevalence of stress-related insomnia | +1.2% | Global, with highest impact in North America and Europe | Medium term (2-4 years) |
| Ageing population with comorbid sleep disorders | +1.0% | Global, concentrated in developed markets | Long term (≥ 4 years) |
| Commercial launch of next-gen orexin antagonists | +0.8% | North America, Europe, expanding to Asia-Pacific | Short term (≤ 2 years) |
| Expansion of digital CBT-I platforms via telehealth | +0.7% | Global, with early adoption in North America | Medium term (2-4 years) |
| Wearable-based phenotyping enabling personalised dosing | +0.5% | North America and Europe initially | Long term (≥ 4 years) |
| Employer-sponsored sleep-health benefits boosting prescriptions | +0.4% | Primarily North America, expanding to Europe | Medium term (2-4 years) |
| Source: Mordor Intelligence | |||
Aging population with comorbid sleep disorders
One in four adults aged 65-79 years reports chronic insomnia, versus 16% in younger cohorts. Age-related polypharmacy, cognitive decline, and cardiovascular comorbidities complicate care and elevate interest in orexin antagonists, which preserve sleep architecture without marked next-day impairment. The 2025 FDA approval of suvorexant for mild-to-moderate Alzheimer’s dementia enlarged the elder addressable pool and validated age-specific dosing strategies. Pharma pipelines now prioritize geriatric-friendly formulations to capture this expanding segment.
Commercial launch of next-gen orexin antagonists
Daridorexant and lemborexant have shifted treatment focus from GABA modulation to orexin pathway inhibition, reducing sleep latency by up to 35 minutes and trimming wake-after-sleep onset by 29 minutes in pivotal trials. China’s 2025 approval of DAYVIGO opened a 172.5 million-patient market, underscoring global appetite for this mechanism. Patent protection to 2033 shields innovators, giving them margin headroom and investment runway.
Expansion of digital CBT-I platforms via telehealth
Digital CBT-I delivers symptom remission in 76% of users and cuts sleep onset time by 54%. The American Academy of Sleep Medicine’s 2024 call for permanent telehealth coverage legitimizes virtual insomnia care. Partnerships such as Green Shield Canada–HALEO show 94% clinical resolution after five-week protocols and illustrate payer acceptance. Wearable integration provides objective sleep metrics, strengthening clinical credibility.
Expansion of digital CBT-I platforms via telehealth
Digital CBT-I delivers symptom remission in 76% of users and cuts sleep onset time by 54%. The American Academy of Sleep Medicine’s 2024 call for permanent telehealth coverage legitimizes virtual insomnia care. Partnerships such as Green Shield Canada–HALEO show 94% clinical resolution after five-week protocols and illustrate payer acceptance. Wearable integration provides objective sleep metrics, strengthening clinical credibility.
Restraints Impact Analysis of Insomnia Treatment Market*
| Restraint | (~) % Impact on CAGR Forecast | Geographic Relevance | Impact Timeline |
|---|---|---|---|
| Patent expiries driving rapid generic erosion | -0.9% | Global, with immediate impact in developed markets | Short term (≤ 2 years) |
| Dependency & safety concerns of hypnotics | -0.6% | Global, particularly in regulated markets | Medium term (2-4 years) |
| Shift to cannabis-based OTC sleep aids | -0.4% | North America primarily, expanding globally | Medium term (2-4 years) |
| Tighter reimbursement scrutiny on long-term pharmacotherapy | -0.3% | Developed markets with public healthcare systems | Long term (≥ 4 years) |
| Source: Mordor Intelligence | |||
Patent expiries driving rapid generic erosion
Zolpidem’s loss of exclusivity spawned 13 generic approvals and re-set price points, illustrating margin compression that typically reaches 80% within 18 months. Branded holders counter via extended-release formats and lifecycle tactics, but the effect remains a net drag on premium drug revenue. The 2024 sale of Ambien brands to Cosette for USD 39 million signals continuing though diminished brand equity in post-LOE environments.
Dependency & safety concerns of hypnotics
Stronger U.S. boxed warnings on complex sleep behaviors and European data showing 17.8-week average Z-drug use despite 4-week guidance intensify prescriber caution. Falls in elderly populations and cognitive impairment risks shift preference toward shorter courses, non-pharmacological care, or newer orexin options with cleaner safety profiles.
*Our forecasts treat driver/restraint impacts as directional, not additive. The impact forecasts reflect baseline growth, mix effects, and variable interactions.
Insomnia Treatment Market Segment Analysis
By Treatment Type:
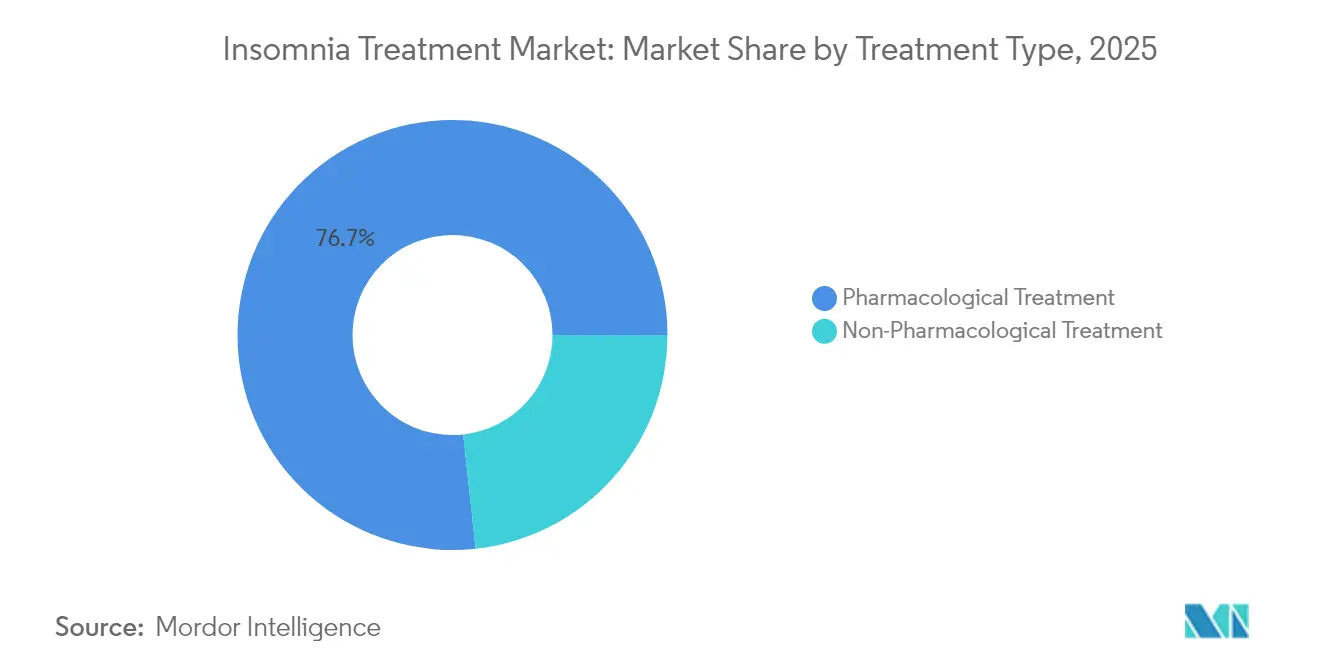
Pharmacological Dominance Faces Digital DisruptionThe pharmacological segment generated 76.72% of insomnia treatment market revenue in 2025 given entrenched prescribing habits and rapid symptom relief expectations. Non-benzodiazepine Z-drugs and legacy benzodiazepines comprised most scripts, but orexin receptor antagonists captured a growing slice following multiple 2024-2025 approvals. Non-pharmacological solutions, led by digital CBT-I, delivered the fastest growth at a 5.39% CAGR, reflecting payer acceptance and consumer preference for non-drug options. Over-the-counter products, including cannabidiol, attracted self-medicating users reporting 62.9% sleep-quality improvement.
Converging care models now bundle drugs with sleep-coaching apps, remote monitoring, and behavioral nudges to optimize adherence. Prescription digital therapeutics cleared by the FDA validate reimbursement and set the stage for hybrid regimens that improve long-term efficacy. Companies with integrated platforms tap dual revenue streams while strengthening real-world evidence packages demanded by payers. The shift implies rising competition on holistic outcomes rather than molecule-level distinctions, rewarding firms that marry pharmacology with technology.

By Insomnia Type:
Comorbid Cases Drive GrowthPrimary insomnia delivered 61.88% of 2025 revenue yet grows slower than comorbid insomnia, which is forecast to expand at 5.98% CAGR and widen its contribution to the insomnia treatment market size through 2031. Multi-morbidity involving depression, anxiety, and cardiovascular disease calls for coordinated management strategies and favors medications with minimal interaction liabilities such as orexin antagonists. The 2025 label expansion of suvorexant to Alzheimer’s dementia elevated disease-specific opportunities and spurred research into neurodegenerative comorbidities.
Digital therapeutics capable of addressing both insomnia and underlying mood disorders through targeted modules strengthen the value proposition for integrated care. Insurers increasingly reimburse bundled solutions that treat root causes, encouraging health-system partnerships. As healthcare shifts toward outcome-based reimbursement, comorbid cases become a strategic growth lever given their higher overall economic burden.
By Patient Age Group:
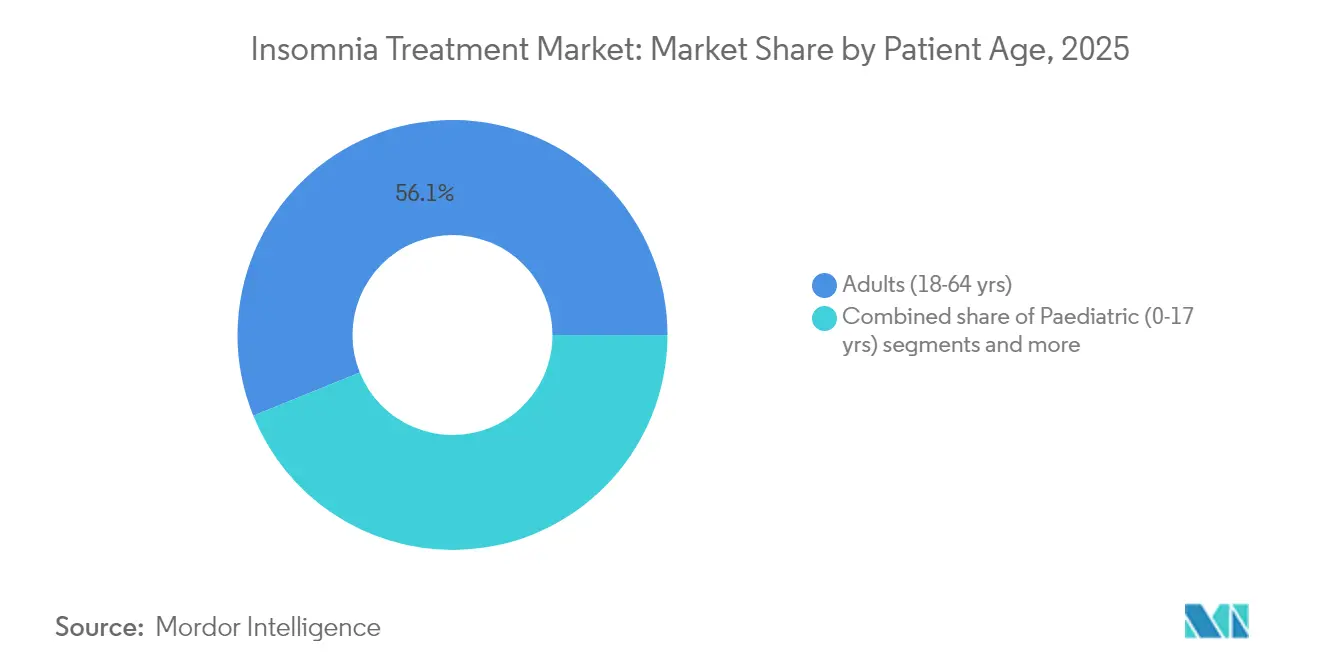
Adult Segment Leads, Pediatric Shows PromiseAdults aged 18-64 years accounted for 56.13% of 2025 revenue, underpinned by work stress and employer benefits that facilitate treatment access. The insomnia treatment market share among geriatric patients is rising due to aging demographics, but dosing complexities and fall risk necessitate differentiated formulations. Pediatrics, while under 10% of current prescriptions, is projected to chart a 5.83% CAGR as clinicians recognize the developmental impact of chronic sleep loss. Ongoing trials for daridorexant in adolescents could unlock pediatric labeling and broaden therapeutic reach.
Wearables appeal across age groups but hold particular promise for adolescents and young adults accustomed to mobile health ecosystems. For older adults, simplified dosing and clear safety profiles remain decisive. Market entrants that tailor delivery forms—liquid suspensions, low-dose tablets, or chewables—stand to build early franchise strength in pediatric segments.
By Care Setting:
Outpatient Dominance, Homecare AccelerationOutpatient clinics and ambulatory centers generated 63.27% of 2025 revenue as most insomnia evaluations and prescriptions occur in community settings. Hospital inpatient demand is limited to severe, comorbid, or postoperative cases. Telehealth-enabled homecare is the fastest-growing channel at 6.14% CAGR, supported by payer coverage for virtual CBT-I and remote monitoring. FDA-cleared overnight oximetry wearables allow clinicians to titrate doses without in-person visits, cutting costs and accommodating patient preference for home-based care.
Sleep clinics maintain a role for polysomnography and complex differential diagnosis. However, as insurers cap reimbursements for in-lab testing, clinics are diversifying into subscription-based virtual coaching and device sales. Vendors that supply integrated hardware-software ecosystems to clinics and patients capture value across the care continuum.
Geography Analysis
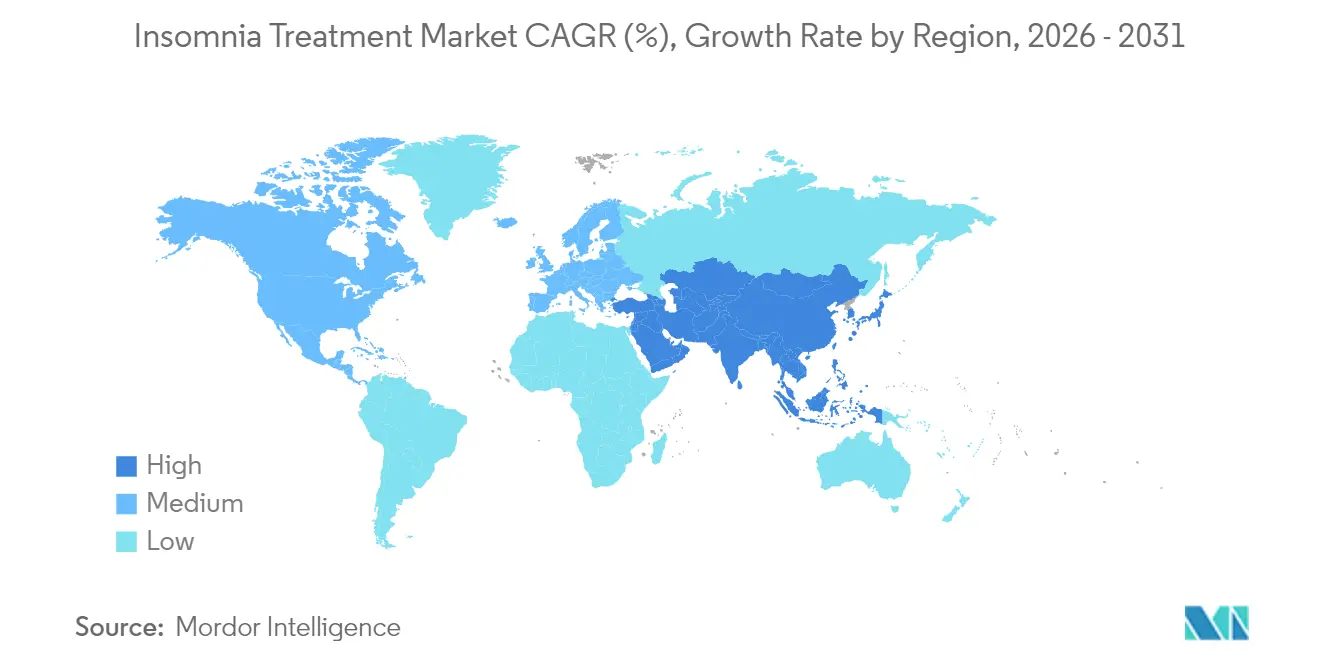
North America and Europe Insomnia Treatment Market
North America’s leadership rests on sophisticated payer systems, employer wellness integration, and the FDA’s supportive stance toward digital therapeutics. North America accounted for 37.64% of 2025 revenue. Medicare covers key sleep studies but still excludes chronic insomnia polysomnography, encouraging uptake of lower-cost home studies. Europe provides reliable but slower growth; the EMA approved daridorexant yet rejected ramelteon, reflecting stringent evidence standards. Adoption gaps remain, with benzodiazepines often over-prescribed despite guideline limits.
APAC, South America and Middle East Insomnia Treatment Market
Asia-Pacific outpaces other regions at a 6.63% CAGR; China’s 2025 lemborexant launch and South Korea’s ongoing daridorexant Phase 3 trial exemplify rapid regulatory movement. Japan’s early embrace of orexin agents demonstrates high physician receptivity, while Australia’s telehealth expansion widens rural access. Cannabinol products, legal since 2020 in Japan, present a parallel over-the-counter market and compel prescription brands to differentiate on clinical data. South America and the Middle East remain nascent but invest in diagnostic infrastructure, positioning them for above-average long-term growth. Multinationals cultivate local generics alliances to navigate pricing and distribution complexities in these regions.
Regulatory Landscape
Regulation spans prescription hypnotics, controlled-substance oversight, and emerging digital therapeutics pathways. In the United States, FDA labeling and post-market controls continue to shape use of long-standing Z-drugs. Updated zolpidem tartrate labeling became effective in January 2026, reinforcing short-term use guidance and interaction warnings that influence prescriber behavior and payer utilization management. FDA actions also affect competitive intensity in mature molecules, such as the July 2026 determination that TOVALT ODT (zolpidem tartrate) was not withdrawn for safety or efficacy, which supports continued ANDA activity for comparable formulations.
In Europe, the EMA and EU institutions are tightening evidence requirements and refining system-wide rules. The EMA CHMP confirmed in March 2026 its refusal (on re-examination) to expand Hetlioz (tasimelteon) for pediatric sleep disturbances in Smith-Magenis syndrome, signaling a high bar for pediatric sleep-related indications. Separately, the European Parliament and Council reached political agreement in December 2025 on reform of EU pharmaceutical legislation, setting up a multi-year (2026-2028) transition that marketing authorization holders must track for changes affecting development incentives, authorization processes, and lifecycle compliance across EU member states.
Value Chain Analysis
The value chain starts with discovery and clinical development (including orexin-pathway innovation and digital CBT-I program design), then moves through regulatory submission, API and finished-dose manufacturing, packaging, and distribution to hospitals, sleep clinics, retail pharmacies, and increasingly direct-to-patient telehealth channels for behavioral therapy. For established pharmacological therapies, cost and continuity depend heavily on API sourcing and controlled-substance compliance. Schedule IV insomnia drugs such as zolpidem and lemborexant operate under quota systems (for example, DEA aggregate and individual manufacturing quotas in the United States), which can cap production independent of demand and requires careful capacity planning.
Recent supply-side actions show a shift from cost-optimized to resilience-focused networks as orexin antagonist volumes broaden geographically. Nxera Pharma received manufacturing approval in October 2025 to add an API site in Asia to support QUVIVIQ (daridorexant) supply for Japan and wider APAC, illustrating how innovators and partners are building redundancy as commercialization expands. Downstream, payer requirements and channel mix (outpatient, homecare, and digital therapeutics) increase the role of real-world evidence generation, adherence programs, and device or app integration, pushing manufacturers and platform providers to coordinate pharmacovigilance, patient support, and distribution logistics across multiple jurisdictions.
Competitive Landscape
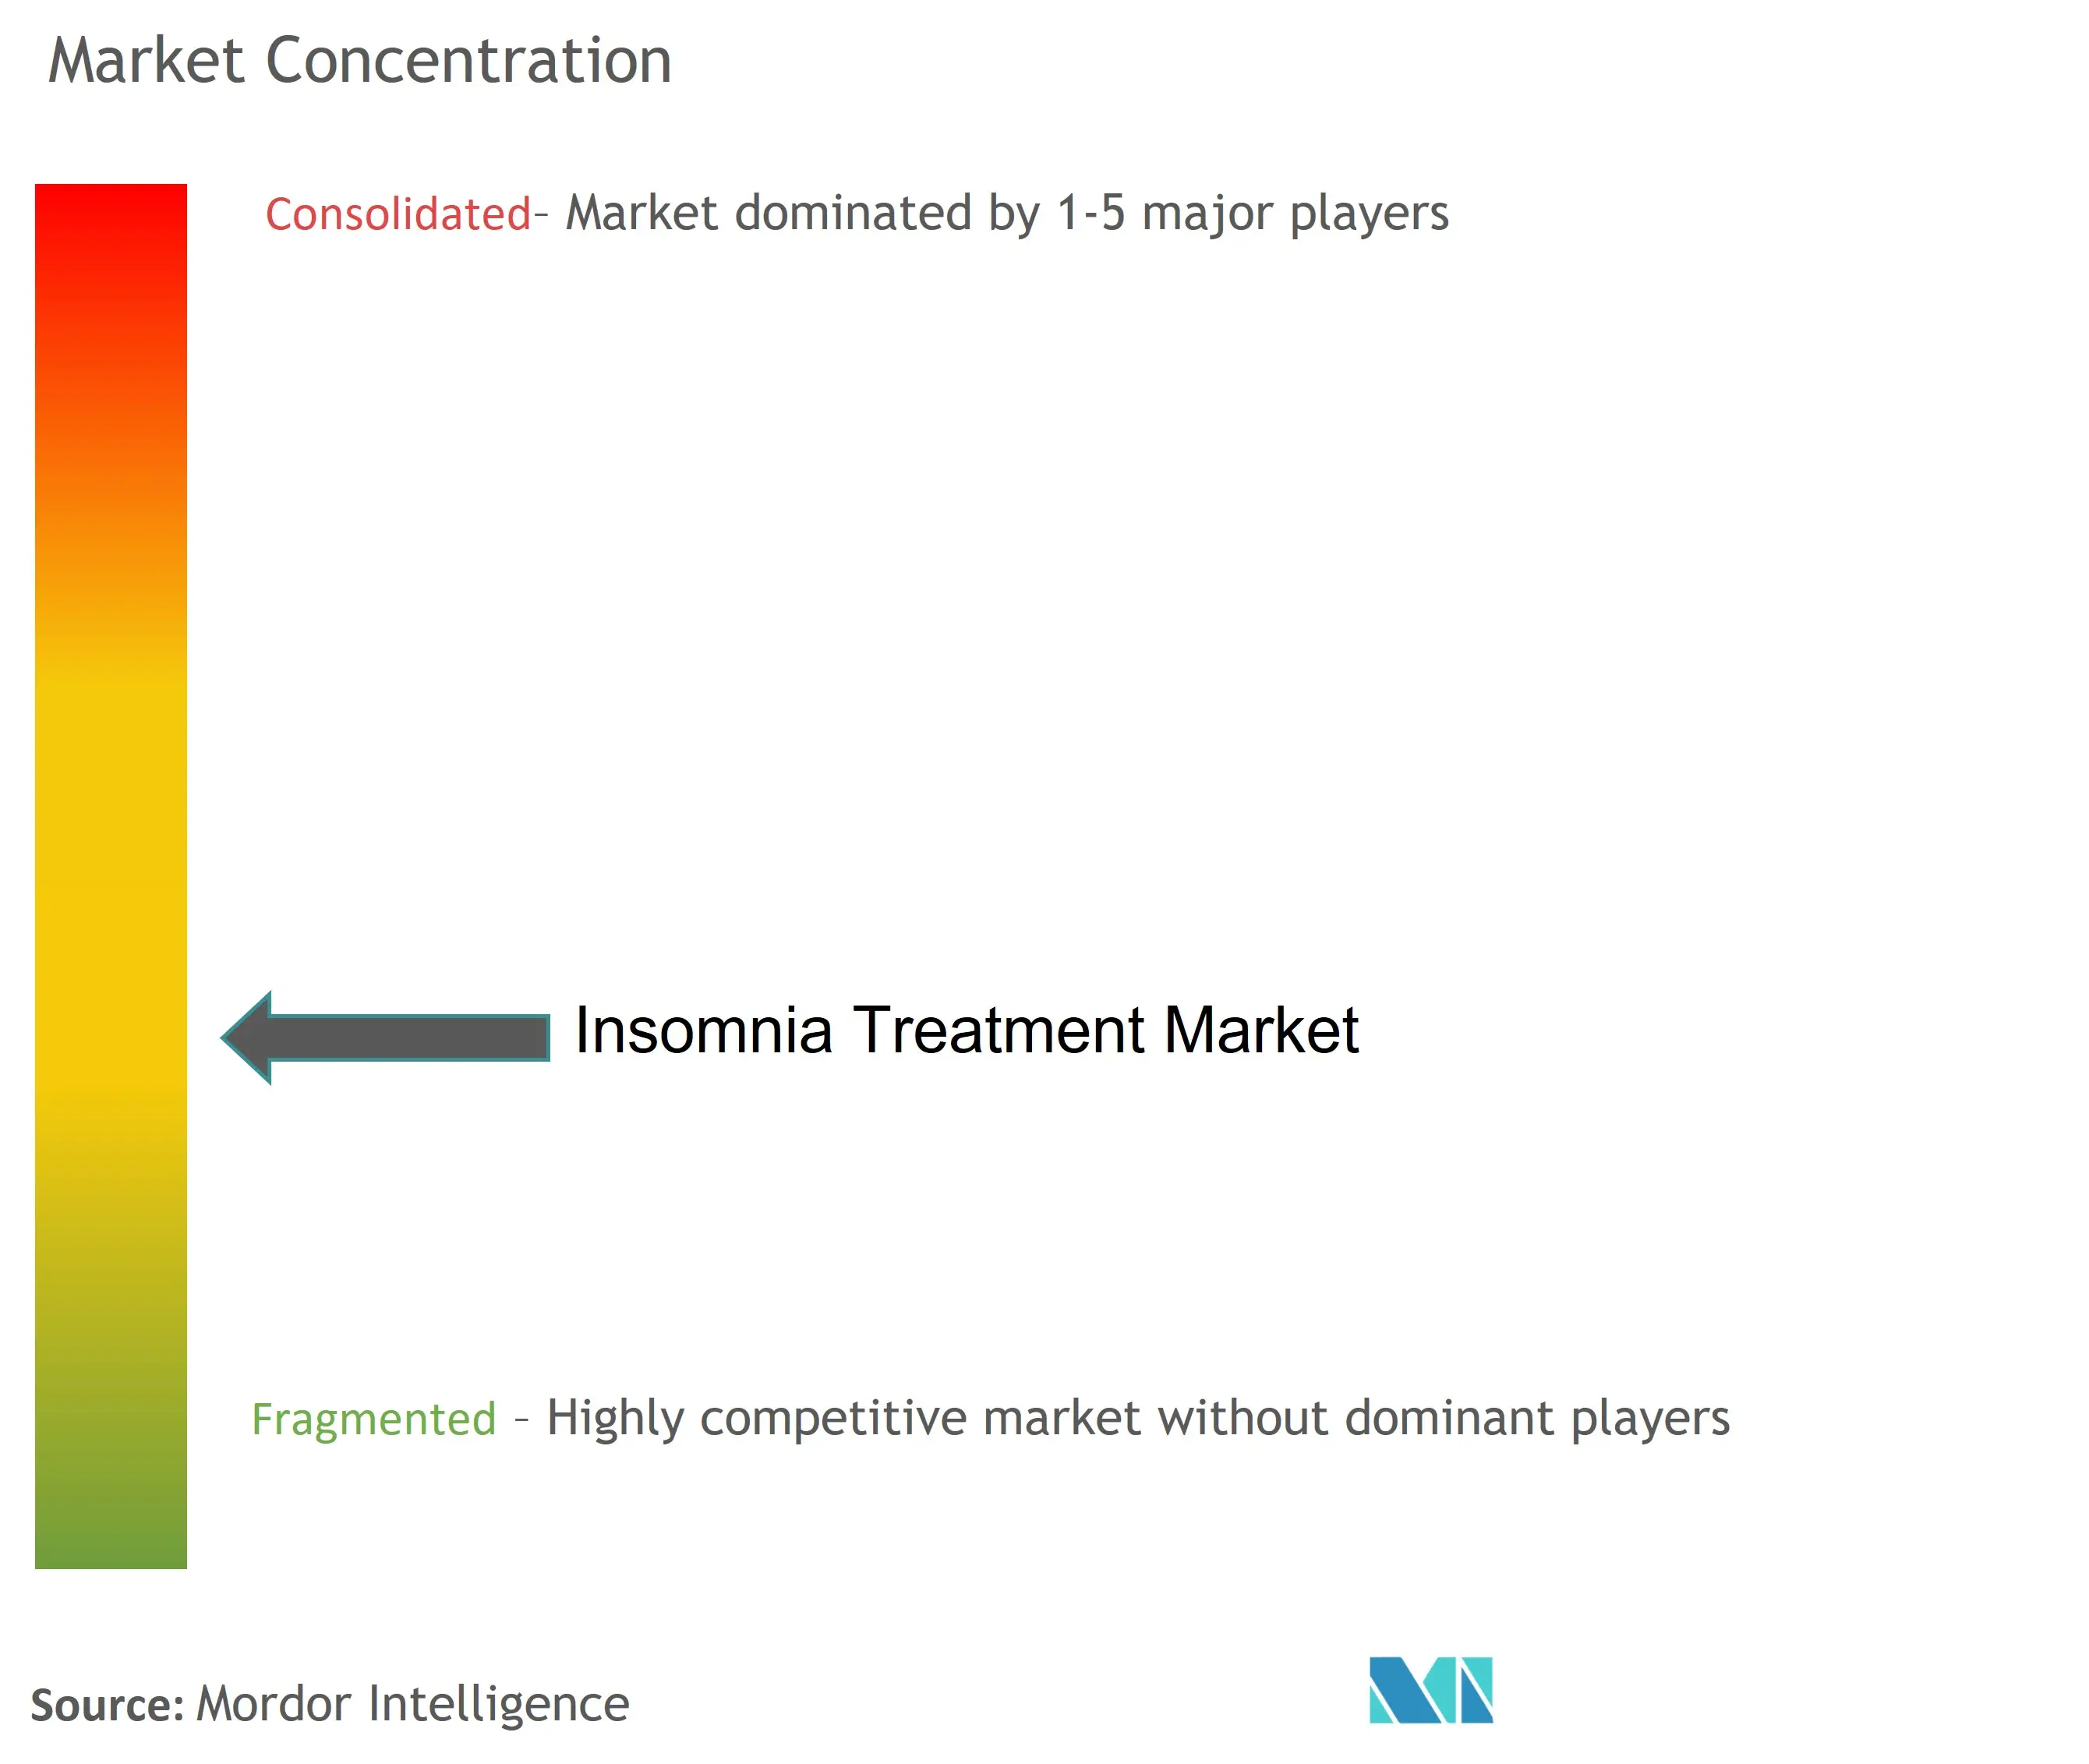
The insomnia treatment market hosts established pharmaceutical brands, emerging digital therapeutics firms, and a growing generic cohort, resulting in moderate fragmentation. Recent M&A activity, while offering scale, correlates with a 24.3% higher likelihood of drug shortages, spotlighting supply-chain resilience as a competitive lever. Innovators deploy lifecycle management—new delivery formats, combination packs, limited-distribution REMS programs—to offset exclusivity loss.
Technology integration separates leaders. Eisai and Idorsia embed wearable compatibility into patient support apps, while Big Health and Somryst leverage prescription digital platforms linking clinicians, payers, and patients. Jazz Pharmaceuticals’ Xywav success illustrates the commercial impact of reformulations that address sodium intake while sustaining efficacy. Generic entrants target imminent Z-drug and melatonin agonist expiries, increasing price competition.
White-space opportunities span pediatric indications, comorbid neurodegenerative disorders, and AI-driven phenotyping. Companies able to bundle hardware, software, and therapeutics into a single reimbursable solution gain strategic advantage as payers pivot toward value-based frameworks.
Insomnia Treatment Industry Leaders
-
Pfizer Inc.
-
Sanofi S.A.
-
Takeda Pharmaceutical Company Ltd.
-
Merck & Co.
-
Electromedical Products International Inc.
- *Disclaimer: Major Players sorted in no particular order
Insomnia Treatment Market Companies Covered in this Report
- Eisai
- Merck
- Idorsia Ltd
- Sumitomo Pharma Co., Ltd.
- Takeda Pharmaceuticals
- Sanofi
- Pfizer
- Viatris
- Teva Pharmaceutical Industries
- Dr. Reddy’s Laboratories Ltd.
- Bayer
- GlaxoSmithKline
- Johnson & Johnson
- Procter & Gamble
- Reckitt Benckiser Group
- Vanda Pharmaceuticals
- H. Lundbeck
- Eli Lilly and Company
- Avadel Pharmaceuticals plc
- Aurobindo Pharma Ltd.
Market Opportunities and Future Outlook
Orexin-mechanism expansion across new geographies and patient segments is opening whitespace beyond legacy hypnotics, especially where regulators and payers scrutinize long-term safety and next-day functioning. In China, Sky Pharma launched Fazamorexant Tablets (Mengping) in May 2026 as a domestic dual orexin receptor antagonist for adult insomnia, adding local competition and broadening category access in a market already primed by prior orexin approvals. In Europe, Eisai's UK MHRA acceptance (July 2026) of a marketing authorization application for lemborexant creates a concrete pathway to expand access in a major non-EU European market, with likely knock-on effects for regional pricing, supply planning, and medical education investments.
Non-pharmacological and hybrid care models are moving from adjunct to reimbursable frontline options, supported by regulatory clearance and telehealth normalization. Big Health received US FDA clearance for SleepioRx in August 2024, reinforcing the prescription digital therapeutic route for chronic insomnia and encouraging payers and employer plans to consider app-based CBT-I as an alternative or complement to drug therapy. Pediatric and comorbid-insomnia programs also represent near-term development whitespace: Idorsia reported statistically significant Phase 2 results for daridorexant in pediatric insomnia (ages 10-18) in March 2026, and EMA activity such as the April 2024 acceptance of a modified pediatric investigation plan for seltorexant underscores ongoing regulatory engagement around adolescent populations with insomnia symptoms.
Recent Industry Developments in Insomnia Treatment Market
- July 2026: Eisai Korea and SK chemicals announced a co-promotion partnership to support the launch of Dayvigo (lemborexant) in South Korea following marketing approval on June 23, 2026. The arrangement strengthens in-country commercialization capabilities for an orexin-based insomnia therapy and increases competitive pressure on legacy hypnotics through faster prescriber reach.
- April 2026: Nxera Pharma received approval from the Taiwan Food and Drug Administration to market QUVIVIQ (daridorexant) for the treatment of adult insomnia. The authorization adds another APAC market for a dual orexin receptor antagonist and supports regional scale-up in supply, distribution, and medical affairs execution.
- August 2024: Big Health received US FDA clearance for SleepioRx, a digital therapeutic for chronic insomnia. This clearance expands the regulatory-backed toolkit for non-pharmacological insomnia care and helps employers, payers, and clinicians operationalize CBT-I pathways through telehealth-friendly delivery.
Insomnia Treatment Market Report Scope and Research Methodology
Market Definition and Coverage
For this methodology, the insomnia treatment market covers solutions used to manage insomnia symptoms in diagnosed and self-reported patients, across prescription medicines and structured non-drug therapies that are delivered through formal care and consumer channels.
Scope exclusions: We exclude general wellness sleep products that are not positioned for insomnia management and do not have a clear treatment or therapeutic use case.
Segments Covered in This Report
- By Treatment Type (Value)
- Pharmacological Treatment
- Prescription Drugs
- Non-Benzodiazepines (Z-drugs)
- Benzodiazepines
- Orexin Receptor Antagonists
- Melatonin Receptor Agonists
- Antidepressants & Others
- Over-the-Counter Drugs
- Prescription Drugs
- Non-Pharmacological Treatment
- Cognitive Behavioural Therapy
- Device-based Therapy
- Pharmacological Treatment
- By Insomnia Type (Value)
- Primary Insomnia
- Comorbid Insomnia
- By Patient Age Group (Value)
- Paediatric (0-17 yrs)
- Adults (18-64 yrs)
- Geriatric (≥65 yrs)
- By Care / Service Setting (Value)
- Hospital In-patient
- Sleep Clinics & Specialty Centres
- Out-patient / Ambulatory Care
- Homecare / Self-administration
- By Geography (Value)
- North America
- United States
- Mexico
- Canada
- Europe
- Germany
- United Kingdom
- France
- Italy
- Spain
- Rest of Europe
- Asia-Pacific
- China
- India
- Japan
- South Korea
- Australia
- Rest of Asia-Pacific
- South America
- Brazil
- Argentina
- Rest of South America
- Middle East and Africa
- GCC
- South Africa
- Rest of Middle East and Africa
- North America
Data Sources, Market Sizing, and Validation
Desk Research
Desk research is used to build the base demand pool and to anchor the model with repeatable public indicators before we move into pricing and channel assumptions. Sources reviewed include, such as the CDC and NIH sleep-related publications, WHO health statistics, and OECD health data for care access and demographic context.
To translate the demand pool into treatment value, we also reviewed sources such as FDA and EMA drug labels and approvals for therapy availability, ClinicalTrials.gov for pipeline signals, and peer reviewed journals for treatment practice trends. Company filings, investor presentations, and reputable press coverage helped cross-check therapy mix changes and launch timing, while a paid subscription for company financials and another for patents were used selectively to validate product exposure and innovation intensity. These are illustrative examples only, and many other sources were also used for data collection, validation, and clarification during the work.
Primary Interviews and Surveys
Primary work focused on validating which therapies are actually used in routine care, how prescribing is shifting between legacy sedatives and newer mechanisms, and what typically happens to patient persistence over time. Interviews and surveys were done with clinicians, pharmacy and channel stakeholders, payor or access-focused experts, and industry participants across APAC, EMEA, and the Americas so the model assumptions could be corrected where secondary data was thin.
Distribution of primary research fieldwork respondents
| Company type | Respondent position | Region |
|---|---|---|
| Top tier: 38% | CXOs: 19% | APAC: 47% |
| Mid tier: 40% | Functional/Unit leaders: 22% | EMEA: 30% |
| Smaller Players: 22% | Managers: 59% | Americas: 23% |
Market-Sizing & Forecasting
Sizing was built using a top-down demand pool approach where prevalence and treated-share assumptions were applied by region, and then converted into value using therapy mix and typical annualized cost of treatment. Where secondary splits were not consistent across countries, we kept the structure simple and only added detail when it could be defended in primary conversations.
Key inputs that were tracked include insomnia prevalence by age bands, diagnosis and care-seeking rates, share treated with prescription therapy versus structured non-drug therapy, switching and discontinuation behavior, and average therapy cost progression after generic entry or new launches. The totals were then corroborated through selective bottom-up checks using sampled volume-by-channel logic and supplier or channel feedback on relative therapy shares, which helped flag outlier assumptions. For forecasting, scenario analysis was used around access and adoption variables, and the final trajectory was aligned to expert consensus on drivers like aging, stress-linked incidence, and availability of newer drug classes, while keeping currency conversion timing consistent across the series.
Data Validation & Update Cycle
Validation was handled through triangulation across prevalence signals, treatment mix logic, and independent checks like launch timing and channel availability, followed by variance checks at region and global levels. When a country result looked too high or low versus its demographic and care-access profile, we revisited the assumptions, checked the math flow, and re-contacted sources to confirm whether a one-off factor was present.
Before sign-off, the model and outputs go through multi-step analyst review so the same market drivers are applied consistently across years. The report is refreshed annually, and interim updates are made when material events occur, such as major approvals, safety updates, or notable reimbursement changes. Right before delivery, a final pass is done to ensure the latest public signals and expert feedback are reflected in the numbers clients receive.
Mordor Intelligence's Insomnia Treatment Market Size Compared With Other Published Estimates
Different published market sizes can vary quite a bit in insomnia treatment, even when they sound like they cover the same topic. In most cases, the spread comes from differences in what is counted as treatment, which years are used as the current base, and how therapy pricing is carried forward over time.
The main gap comes from whether non-pharmacological treatment value is included alongside drugs, and how that therapy mix is carried across regions, which is why Mordor Intelligence keeps the scope tied to both pharmacological and structured non-drug care and then stress-tests the mix through clinician and channel feedback before finalizing the totals.
Benchmark comparison
| Source | Market Size | Gaps in Research Methodology |
|---|---|---|
| Mordor Intelligence | USD 3.76 B (2025) | |
| Global Consultancy A | USD 2.89 B (2024) | Reported as insomnia therapeutics, which is typically limited to drug revenues, and it also uses a different base year that can shift the apparent market level. |
| Industry Publisher B | USD 3.13 B (2024) | Scoped to pharmacological treatment sales revenue, which can exclude structured non-drug therapies, and the slower growth path can reflect conservative uptake assumptions for newer classes. |
Reading the table together, the differences are explainable once scope and year choices are made explicit. Our approach tries to keep the market tied to a clear treated population and a transparent therapy mix, and then it is adjusted only when independent checks point to a practical mismatch.
Key Questions Answered in the Report
What is the current value of the global insomnia treatment market?
It is valued at USD 3.95 billion in 2026 with a forecast to hit USD 5.07 billion by 2031.
Which treatment category is growing fastest?
Non-pharmacological options, led by digital CBT-I, are expanding at a 5.39% CAGR through 2031.
Why are orexin receptor antagonists considered a breakthrough?
They improve sleep architecture without benzodiazepine-like dependency, driving rapid uptake after recent global approvals.
Which region is projected to show the highest growth?
Asia-Pacific is set to record a 6.63% CAGR as awareness and healthcare spending rise.
How are employers influencing demand for insomnia therapies?
About 25% of large employers now fund sleep-health programs, boosting both prescription and digital-therapy volumes.
What role do wearables play in insomnia management?
Smart devices supply continuous sleep data that supports personalized dosing and remote monitoring, enhancing treatment outcomes.