
Insight Engine Market Size and Share
Market Overview
| Study Period | 2020 - 2031 |
|---|---|
| Market Size (2026) | USD 2.85 Billion |
| Market Size (2031) | USD 8.93 Billion |
| Growth Rate (2026 - 2031) | 25.66 % |
| Fastest Growing Market | Asia Pacific |
| Largest Market | North America |
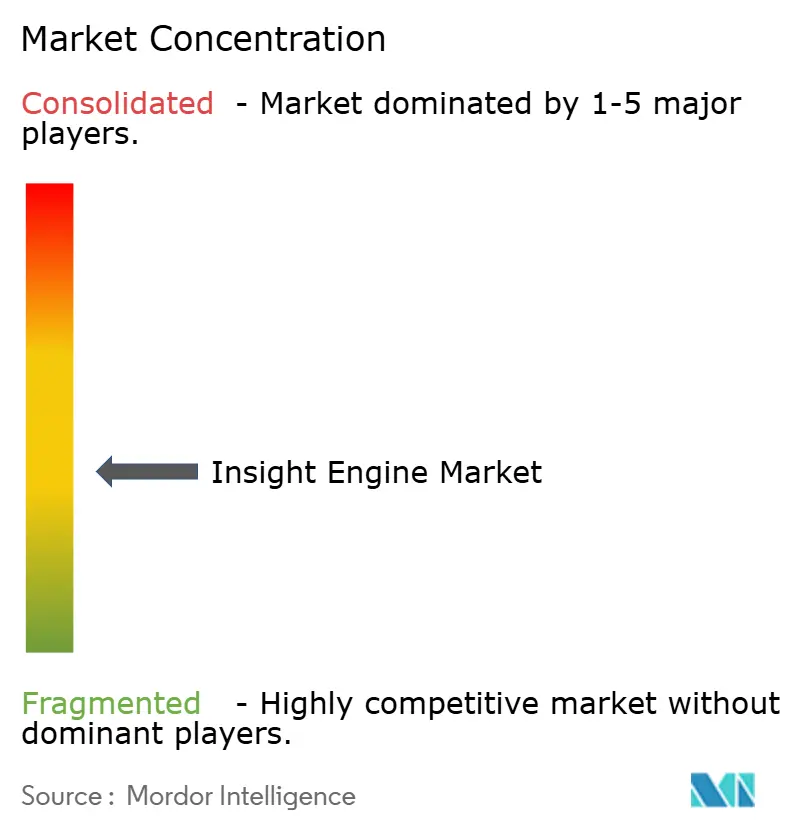
| Market Concentration | Medium |
Major Players *Disclaimer: Major Players sorted in no particular order Image © Mordor Intelligence. Reuse requires attribution under CC BY 4.0. | |
Insight Engine Market Analysis by Mordor Intelligence
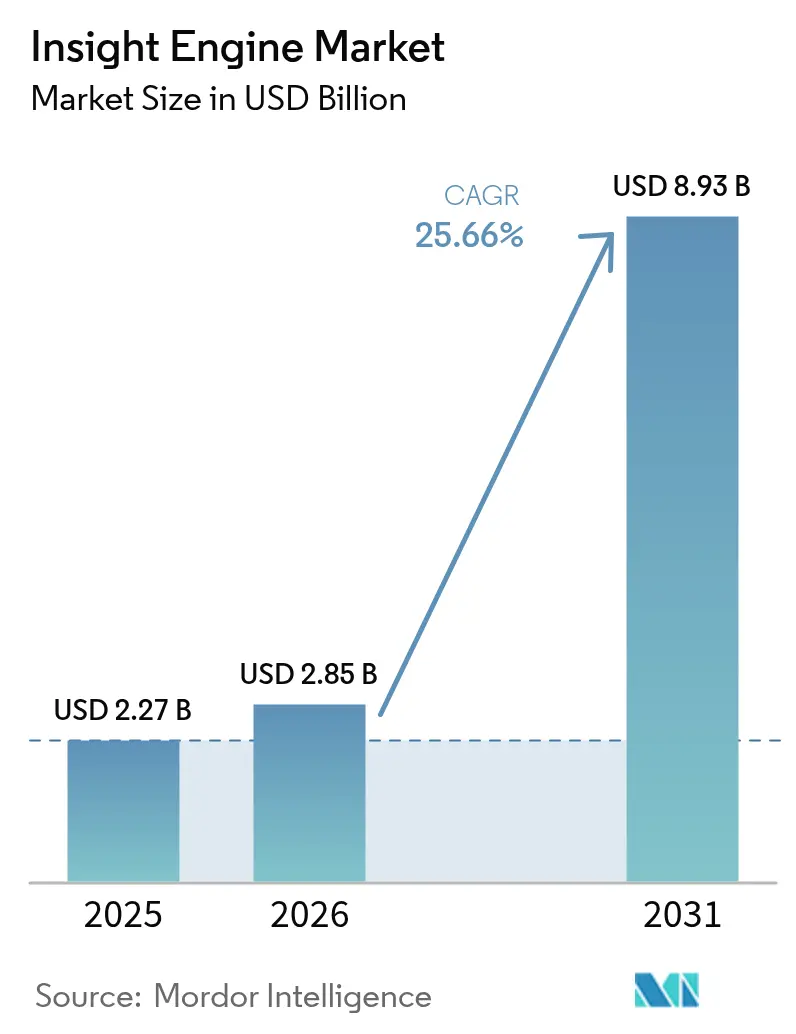
The Insight Engine Market size is expected to grow from USD 2.27 billion in 2025 to USD 2.85 billion in 2026 and is forecast to reach USD 8.93 billion by 2031 at 25.66% CAGR over 2026-2031.
Accelerated adoption of large language models, rising cloud-native deployments, and mounting regulatory scrutiny in data-intensive sectors are reshaping demand patterns. Enterprises are migrating from keyword search toward semantic, multimodal retrieval that unifies text, image, and structured content, cutting information-seeking time for knowledge workers from minutes to seconds. Vector database implementations that support retrieval-augmented generation strengthen user confidence by grounding generative answers in verifiable corporate sources. At the same time, falling infrastructure barriers enable mid-size firms to access capabilities once restricted to global conglomerates, broadening the insight engines market addressable base. Competitive activity revolves around embedding contextual search in security, DevOps, and customer service workflows, creating sticky, outcome-oriented use cases that sustain multi-year contracts.
Key Report Takeaways
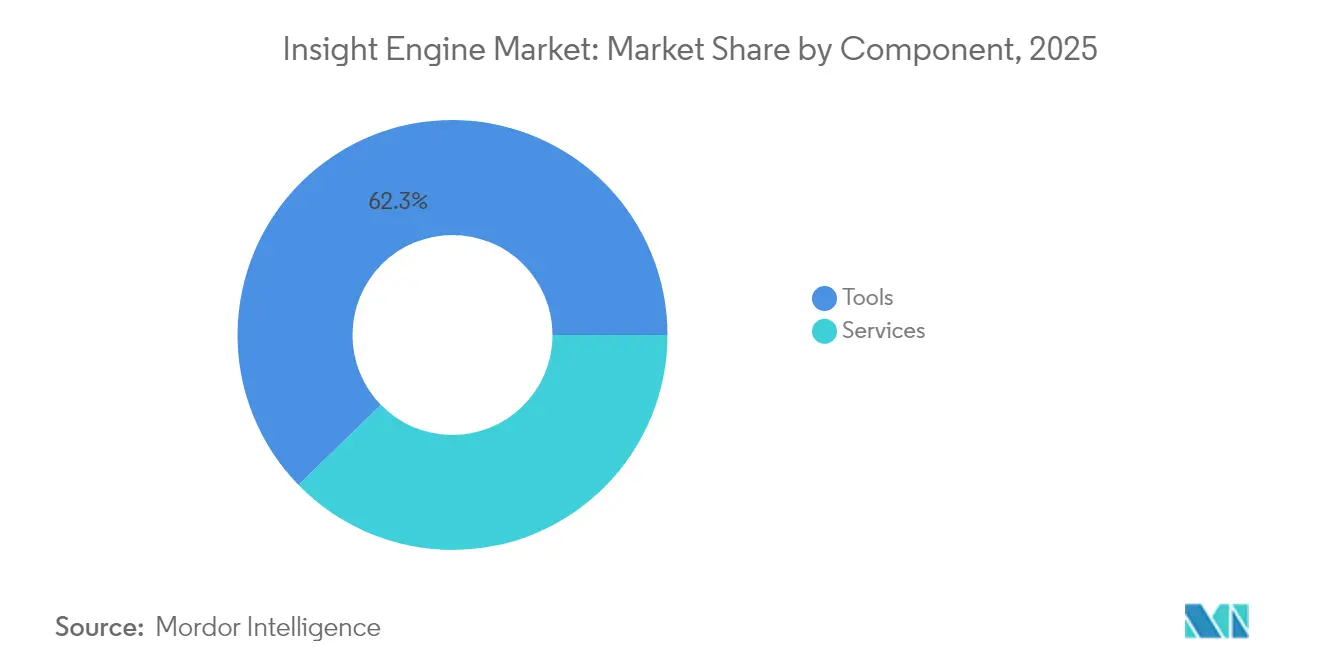
- By component, Tools led with 62.30% revenue share in 2025; Services are projected to expand at a 27.24% CAGR through 2031.
- By deployment mode, Public Cloud held 57.40% of the insight engines market share in 2025 and is advancing at a 31.15% CAGR to 2031.
- By insight type, Contextual Search commanded a 34.60% share of the insight engines market size in 2025, while Conversational Search is set to grow at a 29.05% CAGR through 2031.
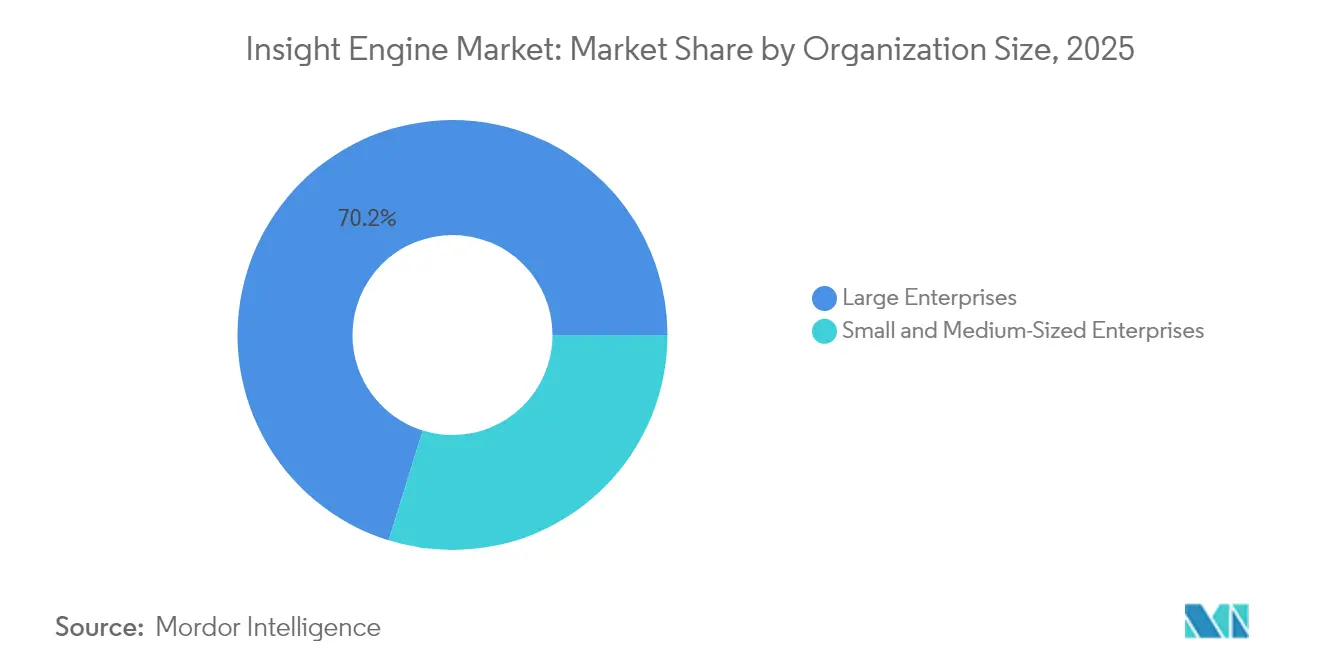
- By organization size, Large Enterprises controlled 70.20% share in 2025; Small and Medium Enterprises recorded the fastest growth at 33.00% CAGR.
- By end-user industry, BFSI captured a 26.70% share in 2025, whereas Healthcare and Life Sciences is forecast to post a 28.55% CAGR to 2031.
- By geography, North America retained a 45.60% share in 2025, while Asia Pacific displays the quickest trajectory at 25.80% CAGR
Note: Market size and forecast figures in this report are generated using Mordor Intelligence’s proprietary estimation framework, updated with the latest available data and insights as of 2026.
Market Trends and Insights
Drivers Impact Analysis of Insight Engine Market*
| Driver | (~) % Impact on CAGR Forecast | Geographic Relevance | Impact Timeline |
|---|---|---|---|
| Explosion of unstructured enterprise data volumes | +4.2% | Global, highest in North America and Asia Pacific | Medium term (2-4 years) |
| Mainstream adoption of GenAI-augmented enterprise search | +5.8% | Global, led by North America, expanding to Europe and APAC | Short term (≤ 2 years) |
| Shift toward cloud-native SaaS insight platforms | +3.9% | Global, strongest in North America and Europe | Medium term (2-4 years) |
| Rise of search-based GenAI copilots in SecOps and DevOps | +2.7% | North America and Europe, expanding to APAC | Short term (≤ 2 years) |
| Regulatory-driven surge in e-discovery and ESG investigations | +2.1% | North America and Europe, with spillover to APAC | Long term (≥ 4 years) |
| Embedding of vector DB-RAG architectures enabling multimodal search | +4.5% | Global, with early adoption in North America and APAC | Medium term (2-4 years) |
| Source: Mordor Intelligence | |||
Explosion of Unstructured Enterprise Data Volumes
Unstructured content constituted 90% of new corporate data in 2024, and global volumes are on track to exceed 73,000 exabytes within two years. Organizations analyze barely half of this information, leaving sizeable value locked in emails, technical manuals, and multimedia assets. Georgia-Pacific’s collaboration with Amazon Web Services illustrates the monetary upside: digitizing decades of plant knowledge through AI chat interfaces is projected to save millions in annual production downtime.[1]Financial institutions replicate the model to surface contextual insights that curb fraud and raise conversion rates. As data footprints balloon, the insight engines market grows because firms require architectures that index billions of vectors while enforcing semantic coherence across evolving knowledge graphs.
Mainstream Adoption of GenAI-Augmented Enterprise Search
Large language models are entering daily workflows as internal copilots. A 2025 cross-industry survey found 63% of firms piloting GenAI first on employee-facing use cases to safeguard brand and privacy.[2] Cisco’s implementation reduced average query latency by 73% and enabled support teams to resolve 90% of tickets on first contact, saving 5,000 staff hours monthly.[3] Natural-language interfaces empower users to ask “why did revenue dip in Q2?” instead of stringing Boolean clauses, trimming decision cycles across banking, healthcare, and manufacturing. The productivity proof points are catalyzing board-level commitments that propel the insight engines market.
Shift toward Cloud-Native SaaS Insight Platforms
Public-cloud deployments capture the largest slice of the insight engines market because scalability and managed security outweigh on-premise control concerns. Mining conglomerates moving to Amazon OpenSearch cut query runtimes from hours to seconds while avoiding capital-intensive refresh cycles. Google Cloud’s native integration of Elasticsearch lets developers ground Gemini responses in enterprise data without custom plumbing. Subscription pricing appeals to finance chiefs seeking predictable OPEX, further accelerating penetration among mid-size firms and emerging markets.
Rise of Search-Based GenAI Copilots in SecOps and DevOps Workflows
Security teams lose time swiveling between SIEM dashboards, ticketing systems, and threat feeds. AI-native platforms that blend high-fidelity threat intel with semantic retrieval cut investigation effort by up to 50%, letting analysts neutralize incidents before lateral movement occurs. DevOps groups mirror the approach, querying large language models for code snippets and automated tests; early adopters report productivity lifts of 20–55% once repetitive scripting work is abstracted away. These tangible benefits spur budget reallocations that enlarge the insight engines market footprint inside cyber-resilience and software delivery toolchains.
Restraints Impact Analysis of Insight Engine Market*
| Restraint | (~) % Impact on CAGR Forecast | Geographic Relevance | Impact Timeline |
|---|---|---|---|
| Data-privacy and governance compliance complexity | –2.8% | Global, highest in Europe and North America | Short term (≤ 2 years) |
| Integration hurdles with legacy knowledge repositories | –3.1% | Global, impacting large enterprises | Medium term (2-4 years) |
| High GPU compute costs for on-prem embeddings | -1.9% | Global, with higher impact in cost-sensitive SME segment | Short term (≤ 2 years) |
| Open-source LLM commoditization of search features | -1.4% | Global, affecting proprietary solution providers | Long term (≥ 4 years) |
| Source: Mordor Intelligence | |||
Data-Privacy and Governance Compliance Complexity
The EU’s GDPR and incoming Digital Operational Resilience Act raise the bar for evidence logging, consent management, and model explainability. Financial institutions regard high-quality data lineage as a prerequisite for GenAI rollouts, with 77% citing it as a gating factor. Multinationals therefore funnel resources into encryption, anonymization, and audit trails, elongating project timelines and trimming near-term insight engines market uptake among compliance-heavy sectors.
Integration Hurdles with Legacy Knowledge Repositories
Enterprises hold petabytes of contracts, CAD drawings, and incident tickets inside aging on-premise systems. Two-thirds of IT leaders are migrating users off legacy platforms, yet inconsistent metadata schemes and brittle APIs add 12–18 months to full deployment schedules.[4] Manufacturers face extra work extracting tacit know-how from PDF manuals and call-center logs before it can be embedded. These frictions delay ROI and can redirect budgets toward incremental upgrades rather than net-new insight engines market rollouts.
*Our forecasts treat driver/restraint impacts as directional, not additive. The impact forecasts reflect baseline growth, mix effects, and variable interactions.
Insight Engine Market Segment Analysis
By Component:
Services Accelerate Despite Tools DominanceTools captured 62.30% of 2025 revenue, reflecting buyer preference for configurable software that dovetails with existing IT stacks. Vendors bundle advanced vector search, ranking algorithms, and relevancy tuning dashboards that out-of-the-box lift retrieval precision beyond keyword baselines. Yet the services segment is projected to grow 27.24% annually as organizations seek advisory partners to integrate domain ontologies, migrate content, and calibrate governance. Services already underpin 55% of total cost of ownership for highly regulated deployments, anchoring sticky multi-year engagements. ServiceNow’s recent Raytion buyout underscores the strategic weight placed on implementation expertise. The dual-track dynamic keeps the insight engines market balanced between product innovation and consultative value capture.
Enterprises adopting industry-specific models demand blueprints for compliance mapping, embedding redaction, and performance monitoring. Specialist integrators differentiate on accelerators that shrink time-to-insight for healthcare, BFSI, or public-sector use cases. Managed services models, delivered via subscription, shift upkeep to vendors and unlock capacity for in-house teams. This transition aligns with CFO goals to turn capex into opex, reinforcing growth momentum in the services slice of the insight engines market.

By Deployment Mode:
Public Cloud Dominates GrowthPublic cloud accounted for 57.40% of the insight engines market share in 2025 and is set to expand 31.15% per year as customers trade data-center lock-in for elastic compute. Cloud providers integrate GPU instances, vector databases, and policy-driven access controls, letting clients deploy pilots in days rather than quarters. On-premise installations persist in defense, government, and highly regulated finance where data sovereignty or air-gap mandates override convenience. Hybrid models bridge regulated datasets with global SaaS apps, yet operational complexity limits their appeal to organizations with mature DevOps cultures.
The cost economics of storing billions of embeddings favour object storage tiers coupled with serverless query front-ends. Consumption-based billing resonates with SMEs, widening the funnel for the insight engines market size among companies previously priced out of enterprise-grade search. As model weights shrink through quantization and distillation, compute overheads fall, further tilting economics toward cloud-delivered platforms.
By Insight Type:
Conversational Search Transforms User ExperienceContextual search maintained 34.60% revenue in 2025, excelling at facet-aware ranking that aligns results with user intent. Conversational interfaces, however, are climbing at a 29.05% CAGR as natural-language questions replace Boolean syntax. The fusion of retrieval-augmented generation with chat UIs produces synthesized answers that cite corporate sources, raising trust and accelerating decision cycles. Predictive and prescriptive analytics modules add scenario modeling, helping planners evaluate “what-if” outcomes inside a single workspace.
Healthcare shows real-world gains: pharmaceutical teams query trial data across siloed registries and condense literature reviews from months to hours. Manufacturing maintenance crews ask handheld copilots for step-by-step repair actions, drawing on historical sensor logs and manuals. Retailers use conversational search to coach customer-service agents on product features in real time. These tangible efficiencies reinforce buyer confidence and fortify the insight engines market trajectory.
By Organization Size:
SMEs Drive Adoption AccelerationLarge enterprises commanded 70.20% of spending in 2025, leveraging scale to build cross-functional knowledge layers that support thousands of employees. Yet SMEs post the quickest climb, clocking 33.00% CAGR as cloud SaaS slashes infrastructure prerequisites. Turnkey packages with pre-built connectors, enterprise-grade security, and pay-as-you-grow licensing answer the budget constraints typical of firms with under 500 employees. Survey data shows 91% of AI-adopting small businesses reporting revenue bumps within a year.
SMEs gravitate toward use-case templates such as AI help desks, sales-intelligence digests, and policy search bots. Limited IT headcount magnifies the appeal of managed platforms that abstract patching, scaling, and model upgrades. As open-source language models shrink inference costs, smaller firms access capabilities comparable to Fortune 500 peers, deepening the insight engines market penetration within the mid-market tier.
By End-User Industry:
Healthcare Accelerates Beyond BFSI LeadershipBFSI retained the top spot with 26.70% share in 2025 due to stringent e-discovery, anti-money-laundering, and customer-service mandates. Audit trails and explainability features native to enterprise search align with risk-averse banking cultures. Healthcare and Life Sciences, however, is set to outrun BFSI with a 28.55% CAGR through 2031. Drug-discovery teams use semantic search to correlate gene targets with literature citations, expediting candidate identification. Hospitals deploy chat-based interfaces that aggregate patient histories, lab results, and imaging notes into coherent snapshots, trimming diagnosis cycles.
Manufacturing continues digitizing tribal knowledge as baby-boomer experts retire, embedding repair manuals and incident logs into searchable knowledge graphs. Government bodies experiment with multilingual policy bots that speed constituent responses while respecting archival mandates. These sector-specific pain points drive the insight engines industry toward configurable frameworks that overlay domain ontologies and compliance guardrails, sustaining multi-vertical growth.
Geography Analysis
North America Insight Engine Market
North America generated 45.60% of 2025 revenue, reflecting deep cloud adoption, high digital-talent density, and early-stage GenAI pilots funded by abundant venture capital. Cisco’s documented 73% latency reduction exemplifies how firms convert semantic search into service-cost savings, reinforcing board-level support. Federal agencies also bankroll AI-first knowledge-management programs, cementing a robust reference base that fuels regional network effects within the insight engines market.
Europe Insight Engine Market
Europe trails in topline share but pushes vendors to elevate governance tooling. German developer IntraFind embeds GDPR-compliant anonymization and consent tracking, enabling manufacturers and insurers to scale search while satisfying strict privacy statutes. Funding programmes under Horizon Europe spur public–private consortia that pilot multilingual retrieval across cross-border datasets. These dynamics position Europe as a test bed for explainable AI features likely to propagate globally.
APAC Insight Engine Market
Asia Pacific records the fastest climb at 25.80% CAGR as governments roll out strategic blueprints and allocate research grants. Singapore’s AI Verify initiative certifies model robustness, lending credibility to local deployments. Japanese and South Korean conglomerates layer conversational search on decades of PDF manuals to preserve institutional know-how. Cloud connectivity expansions in India, Indonesia, and the Philippines widen access for SMEs, inflating the insight engines market size across emerging economies. Yet skills shortages and bandwidth constraints still hamper rural adoption, suggesting a staggered maturation curve.

Regulatory Landscape
Regulation affecting insight engines increasingly centers on transparency, auditability, and data governance for AI-enabled search and retrieval-augmented generation used in regulated workflows. In the European Union, the EU AI Act introduces provider and deployer transparency obligations for AI systems (including chatbot disclosure and synthetic-content labeling) and sets a clear compliance milestone as European Commission enforcement powers for general-purpose AI providers become active from August 2026. These requirements translate into concrete product demands in enterprise search, including explainable answer citations, retention and logging controls for e-discovery, and evidence-grade access governance across multilingual and multimodal content.
In the United States, the lack of a single federal AI statute leaves governance fragmented across procurement expectations and emerging legislation, which elevates recognized standards as practical compliance anchors. The NIST AI Risk Management Framework is widely used as a reference for managing AI risk and demonstrating responsible practices, and NIST signaled additional guidance in April 2026 via a concept note for an AI RMF Profile focused on Trustworthy AI in Critical Infrastructure. For global vendors and buyers, these developments increase the need for configurable policy controls, data lineage, and model-risk documentation that can be mapped across jurisdictions without rebuilding ingestion and retrieval pipelines for each region.
Value Chain Analysis
The insight engines value chain starts with enterprise data sources and content producers (documents, emails, tickets, knowledge bases, multimedia, and structured records) and progresses through ingestion and normalization using connectors to ECM/ERP/CRM systems and event streams. Enrichment (OCR, NLP/NER, metadata and taxonomy alignment) then leads into embedding generation and indexing into vector databases and/or hybrid search stacks, often alongside knowledge graph management for entity resolution and relationship-based retrieval. The application layer delivers contextual and conversational experiences through APIs and front ends embedded into workflows such as customer service, security operations, and e-discovery.
Value capture clusters around three areas: (i) governed connectivity and orchestration (connectors, ACL-aware indexing, and pipeline monitoring), (ii) retrieval quality and trust (ranking, grounding, citations, and evaluation), and (iii) deployment and integration services that migrate legacy repositories and align ontologies. Technical reference architectures such as Microsoft Fabric real-time intelligence patterns reflect how heavily these systems depend on reliable data integration and streaming to keep indexes current. The tooling ecosystem spans vector stores (for example, pgvector, Qdrant, and ChromaDB) and knowledge graphs (for example, Neo4j). As architectures shift toward multi-agent, workflow-driven retrieval pipelines, connector standardization and legacy-system integration remain common bottlenecks, which keeps system integrators and managed-service providers central to end-to-end delivery.
Competitive Landscape
Top Companies in Insight Engines Market
Competitive intensity is moderate. IBM, Microsoft, and Google leverage integrated stacks that bundle vector databases, model hubs, and governance consoles. IBM’s Granite 3.0 foundation models augment watsonx search with transparency scores that flag low-confidence passages. Microsoft embeds enterprise search across Teams, Outlook, and Azure OpenAI Service, creating switching costs through workflow ubiquity. Google federates Gemini with cloud-native ground-truth connectors, simplifying rollouts for multilingual corporations.
Specialist vendors carve niches via focused innovation. Elastic fuses log analytics with generative answers, courting DevSecOps buyers. Coveo pairs relevance engines with e-commerce merchandising to lift conversion rates. Sinequa’s neural ranking excels at multi-lingual industrial documentation, now reinforced by ChapsVision’s post-acquisition resources. Open-source ecosystems erode entry barriers: Weaviate, Milvus, and LlamaIndex let startups craft bespoke retrieval pipelines at lower cost, intensifying mid-market competition inside the insight engines market.
Merger and funding activity underlines strategic urgency. ServiceNow bought Raytion and, more recently, data.world to enrich its Workflow Data Fabric. OpenAI’s purchase of Rockset signals ambition to blend real-time analytics with chat interfaces. Perplexity AI leveraged a USD 500 million raise to buy Carbon, sharpening retrieval-augmented generation accuracy for consumer and enterprise users. Vendors unable to couple strong data-ingest pipelines with transparent governance risk marginalization as buyers prioritize end-to-end compliance.
Insight Engine Industry Leaders
-
IBM Corporation
-
Mindbreeze GmbH
-
Sinequa SAS
-
LucidWorks, Inc.
-
Coveo Solutions Inc.
- *Disclaimer: Major Players sorted in no particular order
Insight Engine Market Companies Covered in this Report
- IBM Corporation
- Microsoft Corporation
- Google LLC
- Elastic NV
- Coveo Solutions Inc.
- Mindbreeze GmbH
- Sinequa SAS
- ServiceNow Inc. (Attivio)
- Lucidworks Inc.
- Amazon.com Inc. (AWS Kendra)
- OpenSearch LLC
- Yext Inc.
- Algolia Inc.
- Expert System SpA
- Micro Focus Intl. plc
- Dassault Systemes SE
- Funnelback Pty Ltd
- IntraFind Inc.
- IHS Markit Ltd
- EPAM Systems Inc. (InfoNgen)
Market Opportunities and Future Outlook
A major opportunity is the shift from standalone enterprise search to agentic, workflow-embedded insight engines that can retrieve, reason, and execute multi-step tasks with governance controls. Vendor actions in 2026 support this direction, including Accenture Ventures announcing a strategic investment and partnership with AlphaSense (June 2026) to integrate market intelligence into agentic workflows, and Mindbreeze introducing pre-built Insight Touchpoints and automated Insight Journeys to standardize enterprise AI workflows. That combination creates whitespace for packaged, domain-specific workflows (for example, BFSI investigations, healthcare literature and trial synthesis, and SecOps triage) that ship with evaluation harnesses, audit logs, and citation-first answer experiences rather than generic chat interfaces.
A second opportunity is in the infrastructure layer, as buyers modernize data platforms to support hybrid search (full-text plus vector) and retrieval-augmented generation at enterprise scale. Apache Doris publishing an AI-native roadmap with integrated vector/full-text search and RAG-oriented functions (March 2026) shows how database and lakehouse-adjacent stacks are absorbing capabilities previously delivered only by specialist search platforms. At the same time, tightening governance expectations, including EU AI Act transparency obligations with enforcement powers from August 2026 and broader use of NIST AI RMF in the US, expand demand for policy-aware ingestion, ACL-preserving retrieval, and evidence-grade lineage across multimodal corpora. This supports stronger monetization for policy tooling and services that reduce deployment friction in compliance-heavy sectors.
Recent Industry Developments in Insight Engine Market
- May 2026: IBM announced IBM Concert, an AI-powered operations platform that unifies application, infrastructure, and network monitoring signals. By consolidating operational knowledge and surfacing contextual insights across fragmented toolchains, it reinforces the move toward embedding insight engine capabilities directly into mission-critical IT workflows.
- March 2026: Mindbreeze introduced Insight Touchpoints and Insight Journeys, adding pre-built applications and automated multi-step workflows for Mindbreeze Insight Workplace. This standardizes enterprise AI experiences beyond ad hoc chat, supporting repeatable deployments where governance and process consistency are required.
- August 2024: ChapsVision strengthened its AI capabilities with the acquisition of Sinequa and completed a new EUR 90 million funding round. The transaction broadened resources behind Sinequa's enterprise search and knowledge discovery stack, supporting scaled product development and expansion efforts under a larger platform owner.
Insight Engine Market Report Scope and Research Methodology
Market Definition and Coverage
For this methodology, the market covers revenue earned from insight engine software and related services that help organizations find, understand, and use knowledge from enterprise data and content through search, natural language, and relevance techniques.
Scope exclusions: We exclude general web search advertising, standalone content storage tools, and non-enterprise consumer search use that is not sold as an insight engine offering.
Segments Covered in This Report
- By Component
- Tools / Software
- Services
- By Deployment Mode
- On-premise
- Public Cloud
- Private and Hybrid Cloud
- By Insight Type
- Contextual Search
- Conversational / NLP Search
- Recommendation and Personalization
- Predictive and Prescriptive Analytics
- By Organization Size
- Large Enterprises
- Small and Medium-Sized Enterprises
- By End-user Industry
- BFSI
- Retail and eCommerce
- IT and Telecom
- Healthcare and Life Sciences
- Manufacturing
- Government and Public Sector
- Media and Entertainment
- By Geography
- North America
- United States
- Canada
- Mexico
- South America
- Brazil
- Argentina
- Rest of South America
- Europe
- Germany
- United Kingdom
- France
- Italy
- Spain
- Russia
- Rest of Europe
- Asia Pacific
- China
- India
- Japan
- South Korea
- ASEAN
- Rest of Asia Pacific
- Middle East and Africa
- Middle East
- Saudi Arabia
- UAE
- Turkey
- Rest of Middle East
- Africa
- South Africa
- Rest of Africa
- Middle East
- North America
Data Sources, Market Sizing, and Validation
Desk Research
Desk work started with building a clear picture of how enterprise search and knowledge discovery spending is tracked in public data, and where it is not. We used sources such as OECD and World Bank digital economy indicators to understand broad IT spending direction, and WIPO patent databases to spot product focus areas like semantic search and NLP that affect adoption cycles.
We then layered in company filings, annual reports, and investor presentations to map how revenue is discussed across software subscriptions, professional services, and managed services where applicable. Reputed press, conference papers from IEEE and ACM, and public procurement notices were also used to cross-check the pace of enterprise rollouts, especially in regulated industries. Where useful, we referenced a paid company financials and intelligence subscription and a patent database subscription to fill gaps on private company scale and product activity. These sources are illustrative only, and many other public and proprietary references were also used for data collection, validation, and clarification.
Primary Interviews and Surveys
Primary inputs came from interviews and surveys with product leaders, delivery partners, and enterprise buyers who manage search, knowledge management, analytics, and digital workplace programs. We used these discussions to confirm what is typically purchased as an insight engine, how cloud pricing is structured, and how usage grows after pilot deployments across APAC, EMEA, and the Americas.
Distribution of primary research fieldwork respondents
| Company type | Respondent position | Region |
|---|---|---|
| Top tier: 31% | CXOs: 15% | APAC: 42% |
| Mid tier: 53% | Functional/Unit leaders: 25% | EMEA: 32% |
| Smaller Players: 16% | Managers: 60% | Americas: 26% |
Market-Sizing & Forecasting
Sizing began from a top-down build where enterprise software and services spend was narrowed step by step into the share allocated to search, knowledge discovery, and insight-oriented deployments, and then split by region using adoption and cloud migration signals. To keep the totals practical, we corroborated this with selective bottom-up checks like sampled vendor revenue disclosures, channel feedback on deal sizes, and a volume by average selling price approximation for subscription deployments.
The model uses inputs that buyers and suppliers repeatedly pointed to as value drivers, such as the installed base of enterprise content repositories, cloud versus on-premises mix, average contract duration, typical seat or usage based pricing progression, and the share of deployments tied to regulated workflows (for example, BFSI and government use cases). Where disclosure is limited, gaps were handled through peer group ranges and sanity checks against headcount capacity in implementation teams, before the final totals were locked.
Forecasting was run through scenario analysis supported by a simple multivariate regression view, where growth was linked to cloud adoption, search modernization budgets, and the rate of NLP driven feature rollouts. Assumptions were reviewed with primary respondents, and the final trajectory was adjusted only when the implied deal volumes and renewal patterns remained realistic by region.
Data Validation & Update Cycle
Validation was done through triangulation across the modeled outputs, interview learnings, and independent signals like public spending trends, hiring patterns in search and data roles, and patent activity direction. Large variances were flagged, and then the inputs that usually cause drift, such as cloud price ramp assumptions or service attachment rates, were rechecked and corrected if needed.
Before sign-off, outputs go through multi-step analyst reviews so the calculations, units, and currency handling stay consistent across regions and years. The report is refreshed annually, with interim updates when material events occur that can shift budgets or adoption. Before delivery, a final pass is completed so clients receive the latest updated view rather than an older draft cut.
Mordor Intelligence's Insight Engines Market Size Compared Against Other Published Estimates
Published estimates for insight engines rarely line up because the market label is used differently across sources, and the counting rules often change between software only and software plus services. Differences also come from how cloud subscriptions are annualized, how multi-year contracts are treated in the base year, and how quickly pricing is assumed to rise as NLP features expand.
In our work, the biggest gap drivers were whether adjacent categories like broad enterprise search platforms, knowledge management suites, or generic analytics tools were bundled into the same total, and whether services were counted as ongoing revenue or treated as one-time implementation spend. Currency conversion timing and the refresh cadence also matter because fast growth years can look larger or smaller depending on the exact cut date and assumed cloud migration speed.
Benchmark comparison
| Source | Market Size | Gaps in Research Methodology |
|---|---|---|
| Mordor Intelligence | USD 2.85 B (2026) | |
| Global Consultancy A | USD 2.40 B (2026) | Uses a narrower view that counts mainly software subscriptions, and it applies conservative renewal and usage uplift assumptions that reduce cloud expansion in the near term. |
| Industry Association B | USD 3.30 B (2026) | Folds in adjacent enterprise search and knowledge management revenues, and it scales pricing using a broad digital workplace average that can overstate pure insight engine spend. |
The spread across sources mainly reflects how tightly the product scope is defined and how cloud pricing ramps are treated year to year. By separating insight engine software and related services from adjacent search and content tooling, and then rechecking the implied deal and renewal math with practitioners, the 2026 total is kept traceable to repeatable inputs, a modeling choice applied by Mordor Intelligence.
Key Questions Answered in the Report
What is the current size of the insight engines market?
The insight engines market is worth USD 2.85 billion in 2026 and is projected to grow to USD 8.93 billion by 2031 at a 25.66% CAGR.
Which component segment is growing the fastest?
Services are expanding at a 27.24% CAGR as enterprises seek integration, data-migration, and managed-services expertise to maximize ROI.
Why is public-cloud deployment gaining popularity?
Public-cloud options offer elastic GPU capacity, integrated security, and consumption-based pricing, helping the segment capture 57.40% share and achieve a 31.15% CAGR.
Which region is projected to grow the quickest?
Asia Pacific is forecast to post a 25.80% CAGR through 2031 as government AI strategies and expanding cloud connectivity spur adoption.
How are SMEs benefiting from insight engines?
Cloud-native, turnkey packages let SMEs deploy semantic and conversational search without heavy infrastructure, leading to the segment’s 33.00% CAGR.
What is restraining faster market expansion?
Tough privacy regulations and the complexity of integrating legacy knowledge repositories create compliance costs and lengthen deployment timelines, reducing overall CAGR by an estimated 5.9%.