
Infrastructure As A Service Market Size and Share
Market Overview
| Study Period | 2020 - 2031 |
|---|---|
| Market Size (2026) | USD 225.47 Billion |
| Market Size (2031) | USD 551.08 Billion |
| Growth Rate (2026 - 2031) | 19.58% CAGR |
| Fastest Growing Market | Asia Pacific |
| Largest Market | Asia Pacific |
| Market Concentration | Medium |
Major Players *Disclaimer: Major Players sorted in no particular order Image © Mordor Intelligence. Reuse requires attribution under CC BY 4.0. | |
Infrastructure As A Service Market Analysis by Mordor Intelligence
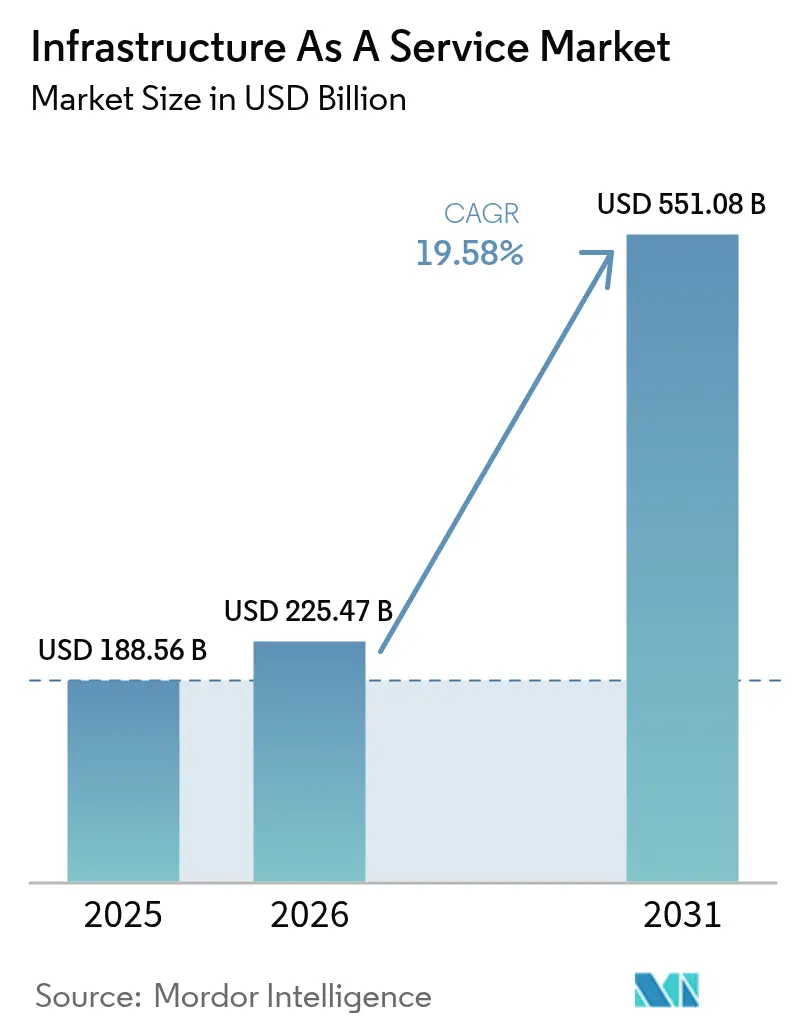
The Infrastructure As A Service Market size is expected to grow from USD 188.56 billion in 2025 to USD 225.47 billion in 2026 and is forecast to reach USD 551.08 billion by 2031 at 19.58% CAGR over 2026-2031.
Demand from generative-AI training, accelerating enterprise hybrid migrations, and hyperscaler capital expenditure above USD 250 billion per year underpin this trajectory. Liquid-cooled data-center designs, edge deployments supporting 5G latency, and sovereign AI initiatives together keep investment levels high. Competition intensifies as hyperscalers chase regional capacity while domestic providers leverage data-residency mandates. Power-purchase agreements for renewables are growing in length and scale because operators need to mitigate grid constraints and meet tightening sustainability targets. Collectively, these forces propel the cloud infrastructure market into its next phase of geographically distributed, AI-ready growth.
Key Report Takeaways
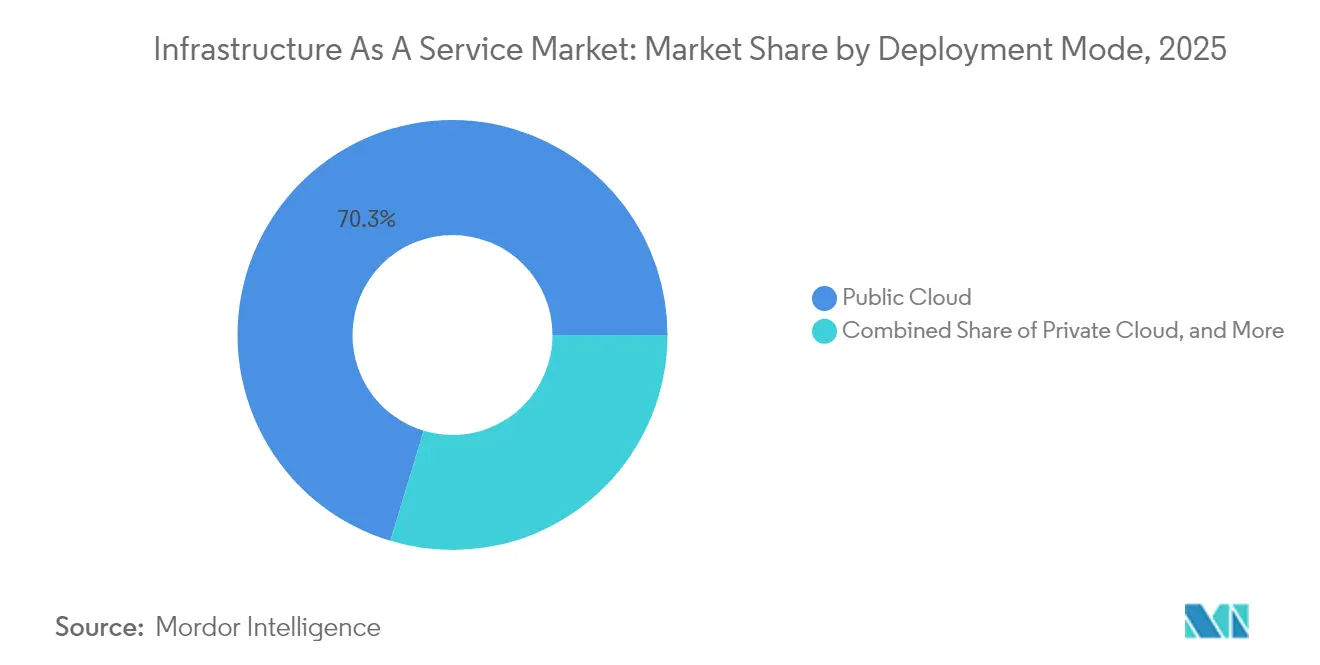
- By deployment mode, public cloud led with 70.34% of the cloud infrastructure market share in 2025, while hybrid cloud is projected to advance at a 23.68% CAGR to 2031.
- By service type, compute as a service accounted for 42.44% of the cloud infrastructure market size in 2025; database/analytics as a service is forecast to expand at a 27.21% CAGR between 2026-2031.
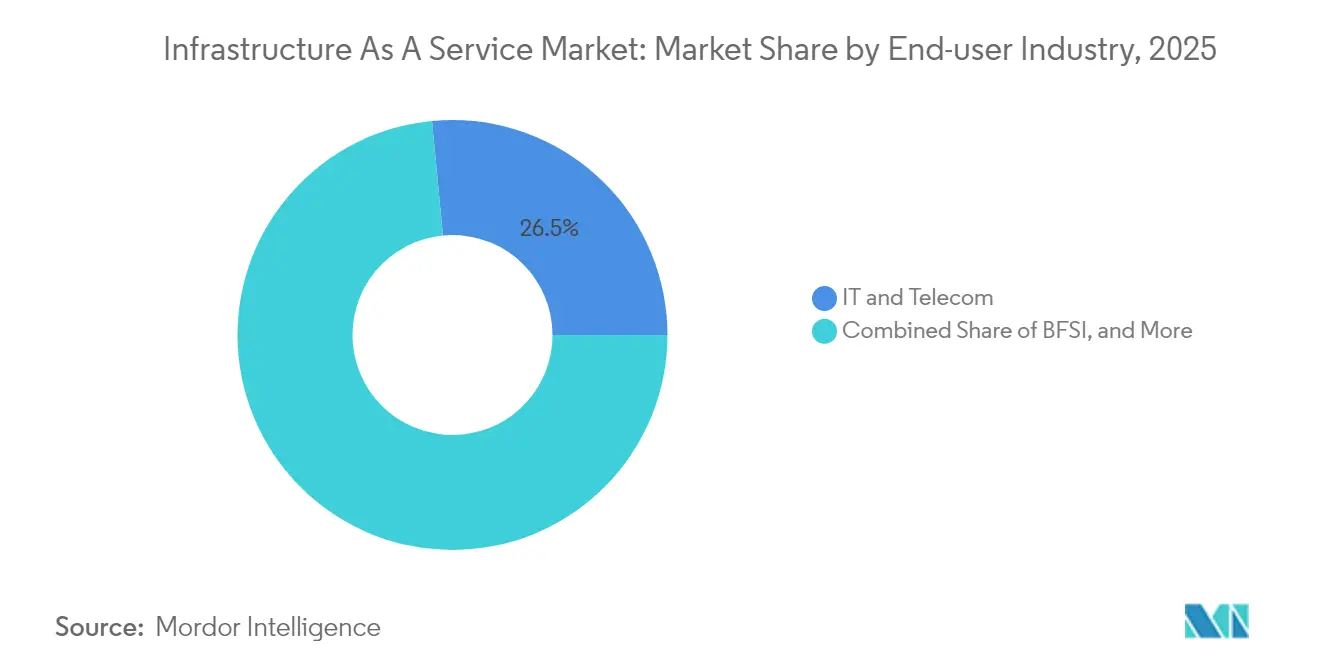
- By end-user industry, IT & Telecom held 26.52% revenue share of the cloud infrastructure market in 2025; manufacturing & automotive is poised for the fastest 24.33% CAGR through 2031.
- By geography, Asia Pacific captured 42.86% of the cloud infrastructure market size in 2025 and continues to post the highest 21.02% CAGR through 2031.
- Amazon Web Services, Microsoft Azure, and Google Cloud maintained a combined 62% share of global hyperscale capacity in 2024.
Note: Market size and forecast figures in this report are generated using Mordor Intelligence’s proprietary estimation framework, updated with the latest available data and insights as of 2026.
Global Infrastructure As A Service Market Trends and Insights
Drivers Impact Analysis*
| Driver | (~) % Impact on CAGR Forecast | Geographic Relevance | Impact Timeline |
|---|---|---|---|
| Accelerating Gen-AI infrastructure demand | +6.20% | Global, concentrated in North America & APAC | Medium term (2-4 years) |
| Enterprise hybrid & multi-cloud migration spike | +4.80% | Global, led by North America & Europe | Short term (≤ 2 years) |
| Hyperscaler CAPEX race (> USD 250 billion in 2025) | +5.10% | Global, APAC expansion focus | Medium term (2-4 years) |
| Edge-to-core latency requirements in 5G era | +2.30% | APAC core, spill-over to North America | Long term (≥ 4 years) |
| Long-duration green-energy PPAs unlocking new DC sites | +1.20% | North America & EU, expanding to APAC | Long term (≥ 4 years) |
| Government “sovereign-AI sandboxes” mandating local IaaS nodes | +1.80% | APAC & EU, selective North America adoption | Medium term (2-4 years) |
| Source: Mordor Intelligence | |||
Accelerating Gen-AI Infrastructure Demand
Generative-AI training clusters require GPU racks drawing 700 W per chip, pushing liquid cooling adoption from 10% of data halls in 2024 to an estimated 20% in 2025. Hyperscalers now redesign campuses around 1 MW liquid-cooled racks, standardizing 400 V DC power distribution to curtail conversion losses, [3]Rich Miller, “Mt. Diablo Project standardizes 400V DC,” Data Center Frontier, datacenterfrontier.comDataCenterFrontier. Enterprises echo the trend: nearly 40% of data-center operators plan to use liquid cooling by 2026 to host AI workloads. These technical shifts reshape facility blueprints, making AI-ready designs a default requirement across the cloud infrastructure market.
Enterprise Hybrid and Multi-Cloud Migration Spike
Organizations now spread workloads across multiple clouds to balance cost and compliance. IBM’s USD 6.4 billion HashiCorp acquisition in 2024 deepens automation for multi-cloud orchestration. Oracle’s and Google’s multicloud tie-up eliminates egress fees for Oracle Database inside Google regions, removing a long-standing barrier to workload portability. Banking adoption is especially strong: 70% of institutions have moved beyond pilots, spurred by data-residency rules and operational-resilience tests.[2]Birlasoft Banking Cloud Study 2025, birlasoft.com As hybrid patterns scale, specialized service providers find new revenue in governance and security advisory, reinforcing a virtuous cycle for the cloud infrastructure market.
Hyperscaler CAPEX Race Exceeding USD 250 Billion
Amazon, Microsoft, and Google together surpassed USD 250 billion in capital outlays during 2025, carving regional moats for AI services. AWS’s USD 15 billion commitment to Japanese expansion serves clients like Nomura and Asahi Group. A USD 100 billion AI Infrastructure Partnership anchored by Microsoft and BlackRock signals a consortium model for pooling energy and compute assets.[1]“Thermal limits of NVIDIA H100,” ScienceDirect, sciencedirect.comOracle’s USD 8 billion Japan push underscores how sovereignty clauses now dictate where facilities rise. These investments amplify scale economics that keep smaller rivals at arm’s length, yet they also lock hyperscalers into long-term asset cycles vulnerable to regulatory shifts.
Edge-to-Core Latency Requirements in the 5G Era
Sub-10 millisecond response times demanded by autonomous vehicles and smart factories necessitate edge nodes in proximity to users. BMW’s iFactory runs real-time quality loops on such nodes. Telecom operators deploy 5G Core-as-a-Service, delivered jointly by Ericsson and Google Cloud across 42 regions, to accelerate rollout. Regional providers like EdgeConneX develop micro-datacenters that complement hyperscale estates. As 5G densifies, edge assets integrate into mainstream planning, extending the cloud infrastructure market towards distributed topologies.
Restraints Impact Analysis*
| Restraint | (~) % Impact on CAGR Forecast | Geographic Relevance | Impact Timeline |
|---|---|---|---|
| Escalating energy-grid constraints | -3.20% | Global, acute in North America & EU | Short term (≤ 2 years) |
| Data-sovereignty & extraterritoriality conflicts | -2.10% | EU & APAC, selective North America impact | Medium term (2-4 years) |
| Capital intensity of liquid-cooling retrofits | -1.50% | Global Tier-1 markets | Medium term (2-4 years) |
| Surging insurance premiums for >100 MW hyperscale campuses | -0.7% | Global, peak impact in North America and Europe | Short term (≤ 2 years) |
| Source: Mordor Intelligence | |||
Escalating Energy-Grid Constraints
Data centers already drew 4.4% of US electricity in 2023; the share may hit 12% by 2028, stressing legacy grids. Northern Virginia and Texas, once prime hubs, now ration megawatt allocations, sending operators to Indiana or Mississippi for fresh capacity. Ireland anticipates up to 70% of national power heading to digital loads by 2030, prompting moratoriums in some counties. Operators respond with immersion cooling that cuts facility power use by 95%, yet those retrofits demand fresh capital and extended build timelines. Limited electricity, therefore, slows the near-term expansion of the cloud infrastructure market.
Data-Sovereignty and Extraterritoriality Conflicts
The EU’s Digital Operational Resilience Act obliges financial firms to retain operational visibility over outsourced IT, pushing workloads to domestically controlled zones. China’s East Data-West Computing program earmarks CNY 400 billion annually for inland clusters, ring-fencing national data. Japan issues subsidies for decentralized facilities that meet local processing mandates. Each regime fragments capacity pools, raises compliance overhead, and may limit global load-balancing efficiencies, tempering growth in the cloud infrastructure market.
*Our forecasts treat driver/restraint impacts as directional, not additive. The impact forecasts reflect baseline growth, mix effects, and variable interactions.
Segment Analysis
By Deployment Mode: Hybrid Cloud Drives Enterprise Transformation
Public cloud held 70.34% of revenue in 2025, a reflection of a decade-long migration away from on-premises stacks. The hybrid tier, however, records the fastest 23.68% CAGR through 2031 as regulated industries mesh on-prem control with off-prem scale. Financial-services leaders credit hybrid setups for meeting customer-experience targets while passing regulatory audits. The cloud infrastructure market size for hybrid deployments is projected to reach USD 163.4 billion by 2031, underscoring its role in balancing latency-sensitive and compliance-critical workloads.
A sharp increase in private connectivity options such as AWS Outposts and Azure Stack supports this hybrid wave. CME Group’s private Google Cloud region in Aurora illustrates how mission-critical trading stays local yet leverages public-cloud tooling. Multifaceted orchestration software—boosted by IBM’s HashiCorp deal—lowers complexity barriers. As maturity rises, the cloud infrastructure industry increasingly views deployment decisions as a portfolio exercise rather than a binary choice.


By Service Type: Database & Analytics Accelerate AI Adoption
Compute services remained the revenue anchor at 42.44% in 2025, yet database/analytics services grow the fastest at 27.21% CAGR. The segment’s ascent mirrors enterprises’ pivot from infrastructure consumption to insight generation. Healthcare providers seek predictive models for patient pathways, while manufacturers deploy analytics for equipment telemetry. The cloud infrastructure market share for database-as-a-service is forecast at 32.24% by 2031 as AI model training proliferates.
Complementary services—storage, networking, and disaster recovery—expand steadily because AI pipelines require resilient data paths. Managed hosting persists for workloads with deterministic performance needs. Altogether, these tiers reinforce the cloud infrastructure market as a layered value chain where higher-order services capture margin even as base compute becomes commoditized.
By End-User Industry: Manufacturing Digitalization Accelerates
IT & Telecom still commands 26.52% of 2025 spending thanks to continuous platform upgrades. Manufacturing & automotive, however, posts a 24.33% CAGR, propelled by Industry 4.0 roadmaps and connected-vehicle telemetry. BMW, Toyota, and emerging EV makers rely on real-time analytics for production quality and autonomous driving simulations. Consequently, the cloud infrastructure market size aligned with manufacturing workloads is on track to exceed USD 108.7 billion by 2031.
BFSI, healthcare, and media each maintain healthy trajectories, driven by mobile-first banking, precision medicine, and streaming demand, respectively. Government digitization, highlighted by the US Department of Defense’s Fulcrum strategy, ensures public-sector participation. In aggregate, widening vertical uptake strengthens the structural growth profile of the cloud infrastructure market.
Geography Analysis
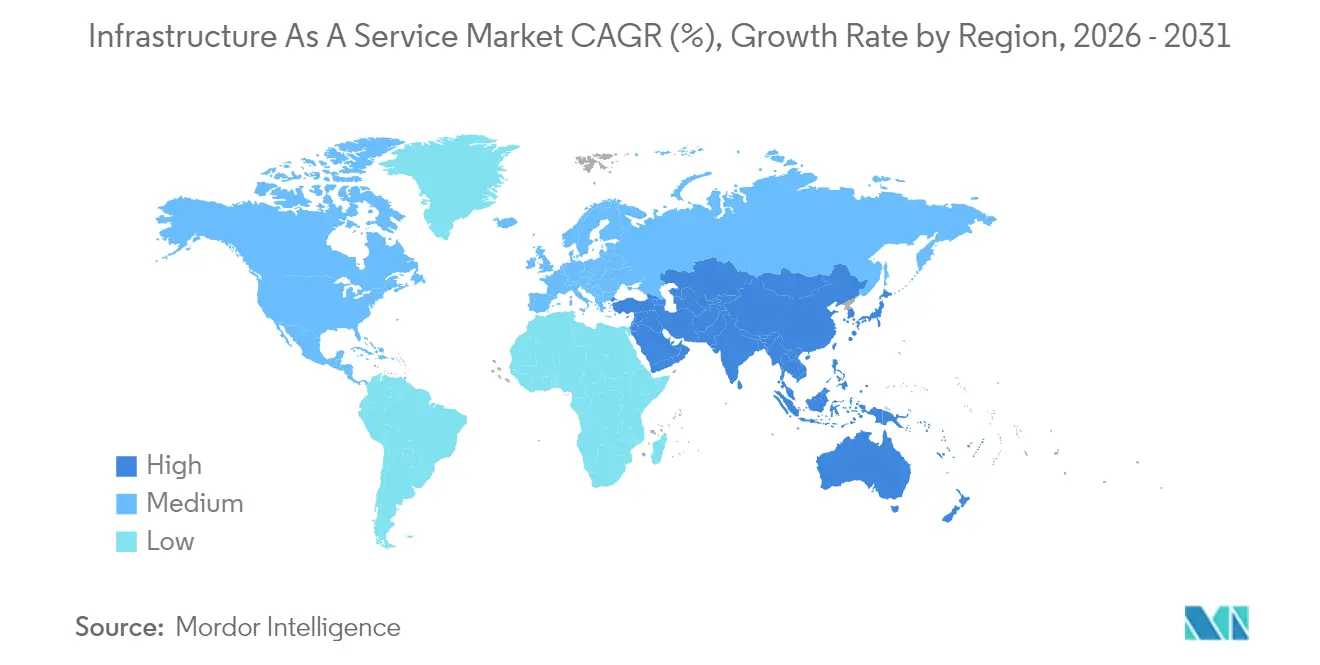
Asia Pacific owns 42.86% of global revenue in 2025 and sustains the fastest 21.02% CAGR as sovereign AI programs in China, Japan, and India funnel subsidies into domestic clouds. China’s East Data-West initiative alone channels CNY 400 billion annually toward eight megaclusters, redistributing computing inland and lowering coastal congestion. Japan approaches JPY 2 trillion (USD 13.4 billion) in data-center value by 2030, buoyed by AWS’s USD 15 billion and Oracle’s USD 8 billion pledges. India gains from NTT’s USD 1.5 billion expansion and local tax incentives favoring digital infrastructure.
North America remains the second-largest base but sees relative growth slow as legacy hubs saturate. Energy limitations redirect projects to overlooked states: AWS earmarks USD 11 billion for Indiana, Compass breaks ground on a USD 10 billion Mississippi campus, and STACK commits over 1 GW in Northern Virginia. Canada’s Digital Ambition program accelerates federal cloud adoption, propelled by Shared Services Canada’s brokerage role.
Europe balances demand with carbon-neutral targets. Regulations such as DORA compel financial firms to diversify providers while national energy caps limit capacity in traditional locations like Dublin and Amsterdam. Alternative metros—Berlin, Warsaw, Oslo, Zurich, Milan, Vienna, and Marseille—rise thanks to renewable grids and supportive permitting regimes. The EU’s aim for zero-carbon data centers by 2030 spurs investment in heat-reuse schemes and offshore wind tie-ins, shaping the next phase of the cloud infrastructure market.

Regulatory Landscape
Cloud infrastructure procurement and operations are increasingly influenced by security assurance regimes and sovereignty requirements across major markets. In the United States, FedRAMP is moving toward 2026 consolidated rules in preview, including requirements for providers to create and maintain secure configuration guides and for agencies to use more standardized, machine-readable compliance artifacts aligned with OMB Memorandum M-24-15. The US Department of Defense Cloud Service Provider SRG (January 2025) continues to set authorization expectations for defense workloads, reinforcing a high-bar compliance pathway for IaaS used in government and other regulated sectors.
In Europe, regulatory convergence is tightening between cloud security catalogs and broader cybersecurity directives. Germany's Federal Office for Information Security (BSI) updated its Cloud Computing Compliance Criteria Catalogue (C5:2026), aligning with ISO/IEC 27001:2022 and incorporating inputs tied to ENISA and the CSA Cloud Controls Matrix, while also reflecting the direction of NIS2-driven controls. At the EU level, the European Commission adopted a proposal in June 2026 for the Cloud and AI Development Act (CADA), introducing EU-level assurance concepts for cloud sovereignty that add another layer of assurance signaling for provider architectures, audit readiness, and regional deployment decisions.
Value Chain Analysis
The IaaS value chain spans upstream compute and storage silicon (CPUs, GPUs, DRAM and HBM), networking and power infrastructure, data center design and build (including liquid-cooling components and power distribution), colocation and hyperscale operators, cloud platforms and virtualization layers, and downstream system integrators and MSPs that implement hybrid and multicloud operating models. Hyperscalers sit at the center by aggregating long-lead hardware, securing power and sites, and productizing capacity into standardized compute, storage, networking, and database/analytics services. As AI workloads expand, platform engineering and workload placement increasingly depend on access to accelerated instances and high-throughput fabrics, linking upstream component availability to cloud service release cadence.
Supply constraints are concentrated in power delivery and AI-leaning semiconductor allocation. The ecosystem points to interconnection and grid-connection queues in dense markets, transformer lead times measured in years, and memory supply shifts toward HBM that squeeze non-AI inventory availability. These bottlenecks increase the value of long-term supply agreements, diversified sourcing, and architecture choices that reduce dependence on constrained components, while integrators and MSPs gain influence by steering enterprises toward regions and providers with available capacity and compliant operating models. On the platform side, recent launches such as AWS's expansion of accelerated EC2 G7e regions and Google Cloud's C4N instance family show how cloud providers use differentiated instance roadmaps, offload architectures, and serverless primitives to translate upstream hardware and networking innovation into consumable IaaS units.
Competitive Landscape
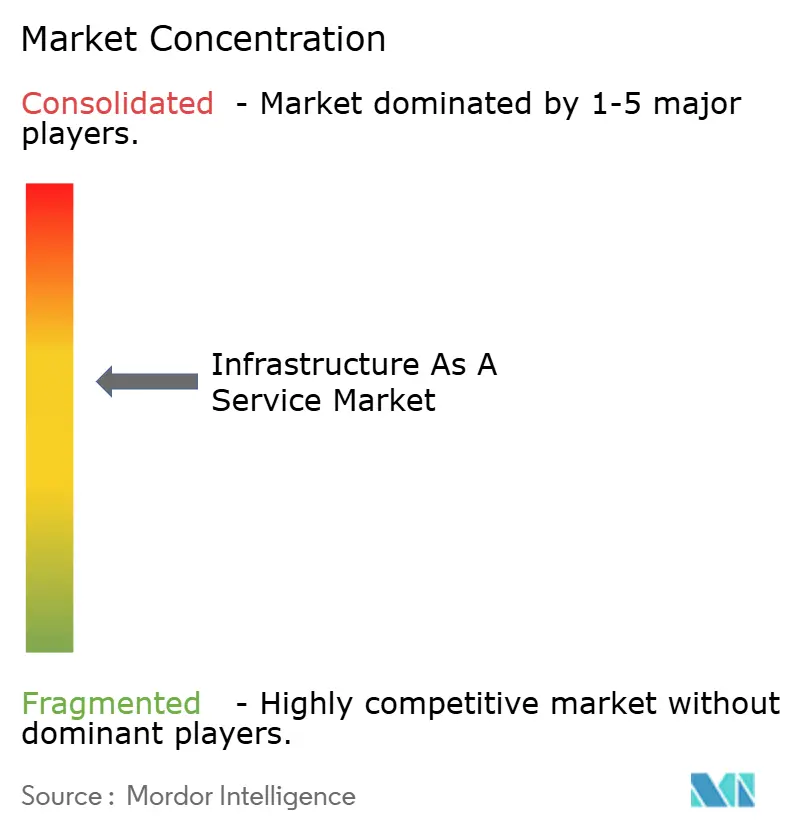
Three hyperscalers, AWS, Microsoft Azure, and Google Cloud, collectively hold a 62% share of installed hyperscale capacity, yet regulatory fragmentation gives regional challengers strategic openings. Capital expenditure races above USD 250 billion, creating high entry barriers, but also locks incumbents into long asset cycles that nimble local firms can exploit. NEXTDC and CapitaLand target sovereign demand with facilities optimized for domestic compliance. In Korea, SK Group and AWS co-finance a 1 GW AI campus, underscoring joint-venture models that blend local influence with global scale.
Innovation centers on liquid and immersion cooling to host GPU clusters while shrinking energy overhead. Vantage Data Centers budgets EUR 1.4 billion for AI-ready European sites, while CyrusOne pilots PUE ratios below 1.03. Edge players, including EdgeConneX, build 10-30 MW regional sites to satisfy 5G latency constraints absent in traditional hub-and-spoke layouts. Sustainability differentiators such as 24/7 renewable matching and waste-heat reuse now feature in RFP checklists, adding complexity to competitive positioning across the cloud infrastructure market
Infrastructure As A Service Industry Leaders
Amazon Web Services (AWS)
Microsoft Azure
Google Cloud Platform (GCP)
Oracle Cloud Infrastructure (OCI)
IBM Cloud
- *Disclaimer: Major Players sorted in no particular order

Market Opportunities and Future Outlook
Sovereign and regulated workloads create whitespace for regionally controlled cloud capacity and assurance-aligned service offerings, particularly where regulators and public-sector buyers require demonstrable control, auditability, and residency. The European Commission's June 2026 adoption of a proposal for the Cloud and AI Development Act (CADA) and Germany's BSI C5:2026 refresh provide concrete policy anchors that shape procurement and evaluation criteria, including cloud security control coverage and audit alignment with broader EU cybersecurity requirements. Providers and partners that package certified landing zones, machine-readable compliance artifacts, and operational resilience controls into repeatable deployment patterns have a clearer path to win government, financial services, and critical-infrastructure workloads that are increasingly assessed on assurance posture alongside performance.
Capacity buildout and financing are also shifting the opportunity map toward markets with investable power and connectivity, and toward assets that support AI inference closer to end users. In India, CPP Investments committed up to INR 7,000 crore (about USD 835 million) to CtrlS Datacenters in June 2026 to scale data center infrastructure, reinforcing India as a focal point for new build capacity that feeds cloud infrastructure supply. Capital is consolidating around scaled operators and interconnection-heavy footprints, evidenced by KKR and Singtel's move to fully acquire STT GDC at a reported USD 10.9 billion valuation announced in July 2026. Alongside multicloud interoperability initiatives, such as AWS Interconnect multicloud and related OCI connectivity work, these moves broaden the addressable enterprise base for IaaS by reducing cross-cloud networking friction while encouraging regional capacity placement where energy and sovereignty constraints are actively shaping procurement decisions.
Recent Industry Developments
- July 2026: Google Cloud announced general availability of C4N compute instances optimized for networking and block storage, built on its Titanium offload architecture. The release targets network-intensive and data-heavy workloads where offload hardware can improve throughput and reduce CPU overhead, strengthening competitive positioning for performance-sensitive IaaS use cases.
- June 2025: Ericsson and Google Cloud launched carrier-grade 5G Core-as-a-Service across 42 regions. The joint rollout tightens the link between telecom cloud modernization and distributed cloud infrastructure demand, supporting edge-adjacent IaaS consumption patterns tied to low-latency services.
- March 2025: BlackRock expanded its AI Infrastructure Partnership to USD 100 billion with NVIDIA and xAI onboard. The consortium structure highlights a financing pathway for large-scale compute and energy buildouts, which can accelerate the availability of AI-ready infrastructure that underpins IaaS capacity additions.


Research Methodology Framework and Report Scope
Market Definition and Coverage
This market covers revenue earned from renting core computing infrastructure through the cloud. Customers can provision compute, storage, and networking resources on demand, then pay based on usage.
Scope exclusions: We exclude SaaS subscriptions, most PaaS-only revenues, and pure consulting or systems integration fees that are not billed as IaaS consumption.
Segmentation Overview
- By Deployment Mode
- Public Cloud
- Private Cloud
- Hybrid Cloud
- By Service Type
- Compute as a Service (CaaS)
- Storage as a Service (STaaS)
- Networking & CDN
- Database / Analytics as a Service (DBaaS)
- Disaster-Recovery as a Service (DRaaS)
- Managed Hosting / Dedicated Cloud
- By End-user Industry
- BFSI
- IT & Telecom
- Healthcare & Life Sciences
- Media & Entertainment
- Retail & e-Commerce
- Government & Public Sector
- Manufacturing & Automotive
- By Geography
- North America
- United States
- Canada
- Mexico
- South America
- Brazil
- Argentina
- Rest of South America
- Europe
- United Kingdom
- Germany
- France
- Russia
- Rest of Europe
- Asia-Pacific
- China
- Japan
- India
- South Korea
- Australia
- Rest of Asia-Pacific
- Middle East and Africa
- Middle East
- UAE
- Saudi Arabia
- Turkey
- Rest of the Middle East
- Africa
- South Africa
- Nigeria
- Rest of Africa
- Middle East
- North America
Data Sources, Market Sizing, and Validation
Desk Research
Desk research is used to set the base structure for the model and reduce reliance on ungrounded assumptions. We use public sources such as the National Institute of Standards and Technology (NIST) cloud definitions, ITU and OECD digital economy indicators, World Bank macro series, and official telecom and spectrum regulators to frame connectivity context that affects cloud adoption.
We also review annual reports, earnings transcripts, and investor presentations to see how infrastructure revenues are discussed and where product lines are grouped. Reputed press coverage, standards bodies, and peer reviewed articles help confirm workload trends such as virtualization density, container usage, and compute demand tied to AI workloads. When financial disclosures are incomplete, we use paid subscriptions for company financials and news intelligence, plus patent databases for directional signals on infrastructure innovation. These are illustrative sources only, and we use additional references to collect data, validate it, and clarify open questions.
Primary Interviews and Surveys
Primary work is used to confirm what is counted as IaaS in real buying and billing cycles, and to pressure test our inputs before finalizing the market model. We speak with cloud infrastructure buyers, managed service partners, and technical leaders across APAC, EMEA, and the Americas to validate adoption pace, usage mix, and pricing behavior across compute, storage, and networking.
Distribution of primary research fieldwork respondents
| Company type | Respondent position | Region |
|---|---|---|
| Top tier: 36% | CXOs: 13% | APAC: 53% |
| Mid tier: 46% | Functional/Unit leaders: 28% | EMEA: 29% |
| Smaller Players: 18% | Managers: 59% | Americas: 18% |
Market-Sizing & Forecasting
Sizing starts with a top-down build where cloud infrastructure demand is reconstructed using a defined spend pool and adoption signals. We then allocate into IaaS revenue based on usage and deployment patterns. To keep the math explainable, we track a small set of market fingerprints such as the installed base of enterprise workloads moving off-premises, the public vs. private vs. hybrid mix, compute intensity linked to virtualization and AI training or inference, storage growth tied to data creation, and observed price movements for common instance and storage classes.
After the initial build is complete, we corroborate results with selective bottom-up approximations. This includes sampled average spend per workload, partner channel checks, and sanity checks using supplier revenue disclosures where they are reported in a comparable way. Where bottom-up inputs have gaps, we bridge using region level penetration ranges validated in interviews, then normalize so totals still align with the wider demand pool.
For forecasting, scenario analysis is used to reflect how sensitive infrastructure consumption is to macro conditions and enterprise IT budgets. We also layer in expected changes in unit pricing and utilization based on expert feedback. By the time the forecast is finalized, both short-term demand signals and longer-term migration momentum are reflected, and the year-to-year curve stays consistent with what practitioners expect to see in contracts and renewals.
Data Validation & Update Cycle
Validation is done through multiple checks so the final numbers do not rely on a single data stream. We compare model outputs against independent signals such as cloud capex commentary, reported infrastructure growth rates, regional enterprise spending trends, and the implied average revenue per workload migration. Where the gap is visible in direction or magnitude, the anomaly is reviewed before sign-off.
If a variance is too large, we revisit the assumption and re-contact selected experts to confirm whether the change is real or driven by a definition mismatch. We refresh every report annually, and we make interim updates when material events occur such as pricing resets, major regulatory changes, or sharp shifts in AI driven capacity demand. Before delivery, a fresh analyst pass is completed so clients receive the most current view available at that time.
Mordor Intelligence's Infrastructure As A Service Market Size Measured Against Other Published Estimates
Published IaaS market values often do not match because each publisher draws the line around what revenue qualifies as IaaS and which deployment types are counted. Differences also show up when the base year is not the same, when currency conversion timing varies, or when pricing trends are assumed instead of being checked with buyers and partners.
Managed hosting and adjacent PaaS platform fees sit outside Mordor Intelligence's scope, which is one reason the 2025 figure can differ from sources that bundle dedicated hosting, platform add-ons, or AI specific services into IaaS totals. The other common gap is how usage is projected forward, where some estimates lean on a single growth curve. Our model uses deployment mix shifts, utilization changes, and instance level price direction to keep the forecast tied to what is actually purchased.
Benchmark comparison
| Source | Market Size | Gaps in Research Methodology |
|---|---|---|
| Mordor Intelligence | USD 188.56 B (2025) | |
| Global Consultancy A | USD 190.32 B (2025) | Often groups IaaS with a wider set of infrastructure related revenues, and the definition can pull in hosted infrastructure bundles that are not always usage-based IaaS consumption. |
| Trade Journal B | USD 171.80 B (2024) | Uses a public cloud IaaS lens and a different base year, which can exclude private and hybrid deployment revenues that are counted in broader IaaS market definitions. |
Taken together, the spread is mainly explained by what is counted as IaaS and whether private and hybrid deployments are included, along with the year chosen for the point estimate. By keeping inputs traceable to deployment mix, workload migration, and observable pricing direction, we can explain each step and adjust assumptions when validation checks point to a mismatch.


Key Questions Answered in the Report
What is the projected value of the cloud infrastructure market by 2031?
It is forecast to reach USD 551.08 billion, growing at a 19.58% CAGR.
Which region leads the cloud infrastructure market today?
Asia Pacific led with a 42.86% revenue share in 2025 and also shows the fastest 21.02% CAGR going forward.
Why is hybrid cloud growing faster than public cloud?
Regulated industries balance latency, compliance, and cost by retaining sensitive workloads on-premises while tapping public cloud for elasticity, driving a 23.68% CAGR for hybrid deployments.
How are power constraints affecting new data-center builds?
Grid saturation in legacy hubs shifts expansion to regions with untapped capacity, and operators increasingly adopt liquid cooling and long-term renewable PPAs to manage energy limits.
Which service type is expanding the quickest within cloud infrastructure?
Database/analytics as a service leads with a 27.21% CAGR through 2031, reflecting enterprise demand for AI-driven insights.
What strategic moves are hyperscalers making to stay competitive?
They are investing heavily in AI-optimized campuses, collaborating on renewable-energy sourcing, and forming multicloud partnerships to meet sovereignty requirements.
Page last updated on:






