
Infertility Drugs Market Size and Share
Market Overview
| Study Period | 2020 - 2031 |
|---|---|
| Market Size (2026) | USD 4.47 Billion |
| Market Size (2031) | USD 5.93 Billion |
| Growth Rate (2026 - 2031) | 5.83 % |
| Fastest Growing Market | Asia Pacific |
| Largest Market | North America |
| Market Concentration | Medium |
Major Players *Disclaimer: Major Players sorted in no particular order Image © Mordor Intelligence. Reuse requires attribution under CC BY 4.0. | |
Infertility Drugs Market Analysis by Mordor Intelligence
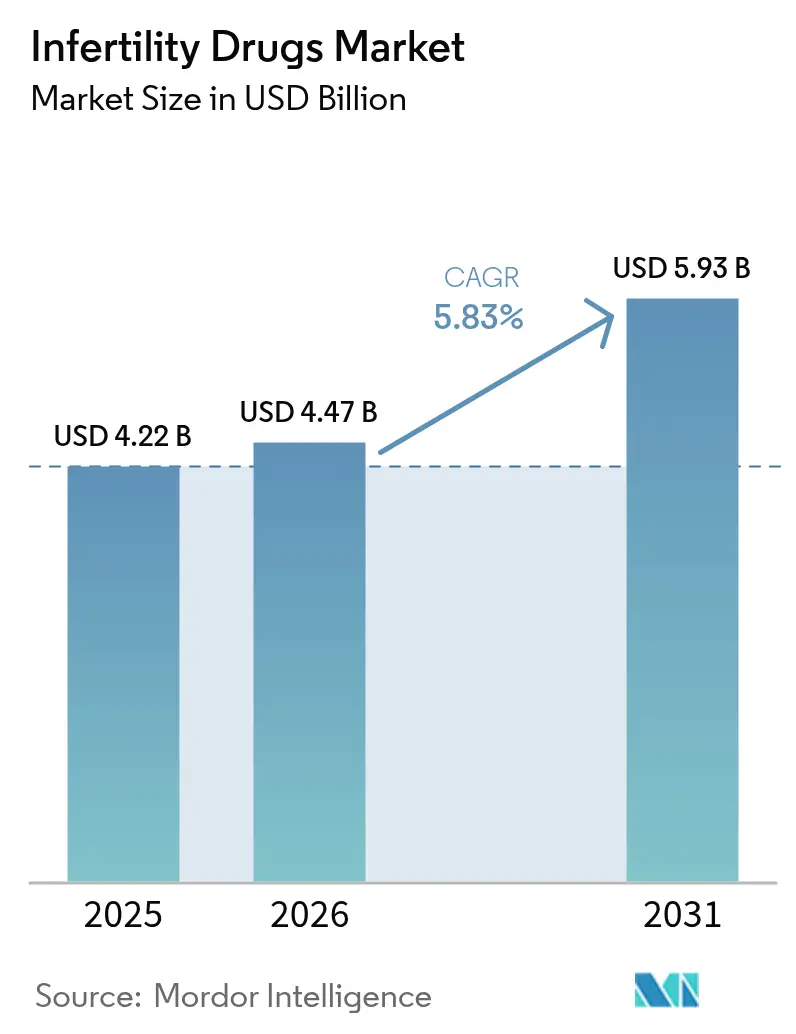
The Infertility Drugs Market size was valued at USD 4.22 billion in 2025 and estimated to grow from USD 4.47 billion in 2026 to reach USD 5.93 billion by 2031, at a CAGR of 5.83% during the forecast period (2026-2031). Consistently rising infertility prevalence, wider insurance mandates and rapid progress in assisted reproductive technologies (ART) are the core engines of growth for the infertility drugs market. Demographic shifts toward delayed parenthood have transformed fertility care into an essential health service rather than an elective choice. Reimbursement reforms in North America and Europe are expanding covered lives, while biosimilar introductions are tempering price escalation and stimulating prescribing activity. At the same time, online and specialty pharmacies are reshaping last-mile delivery as telehealth platforms make fertility medications more accessible.
Key Report Takeaways
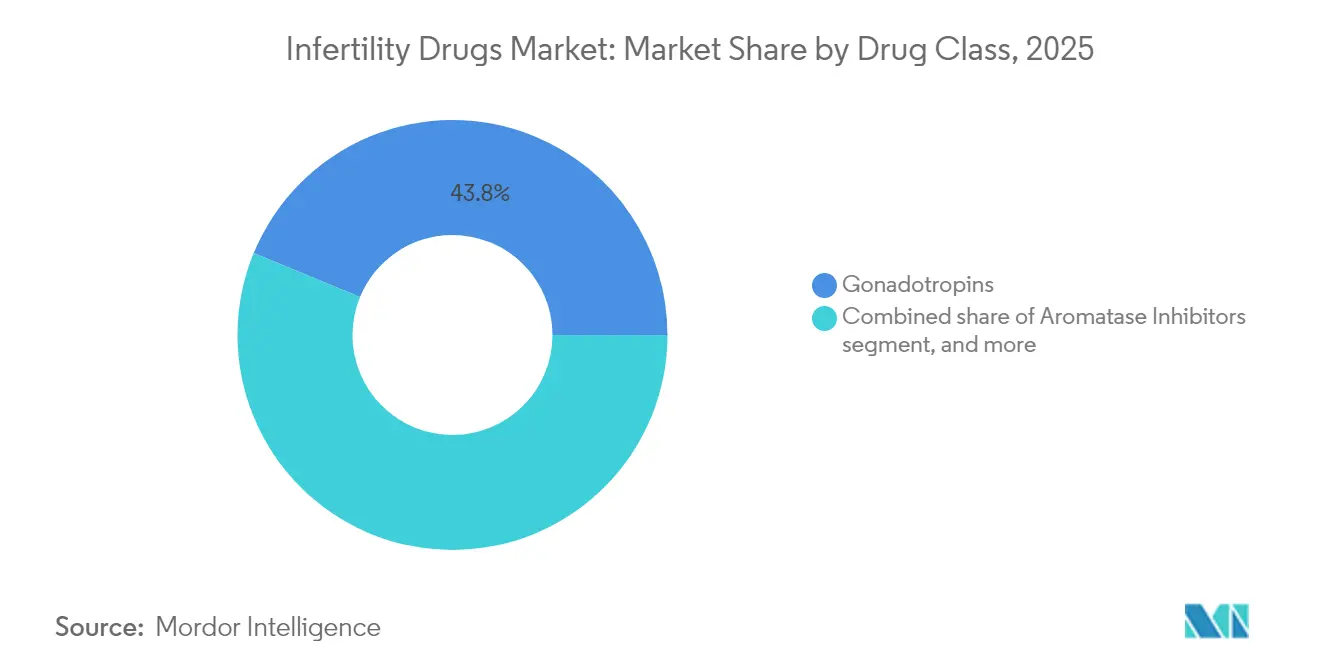
- By drug class, gonadotropins led with 43.78% infertility drugs market share in 2025; aromatase inhibitors are projected to expand at an 8.05% CAGR through 2031.
- By patient gender, female treatments accounted for 70.76% of the infertility drugs market size in 2025, while male therapies are advancing at an 8.62% CAGR to 2031.
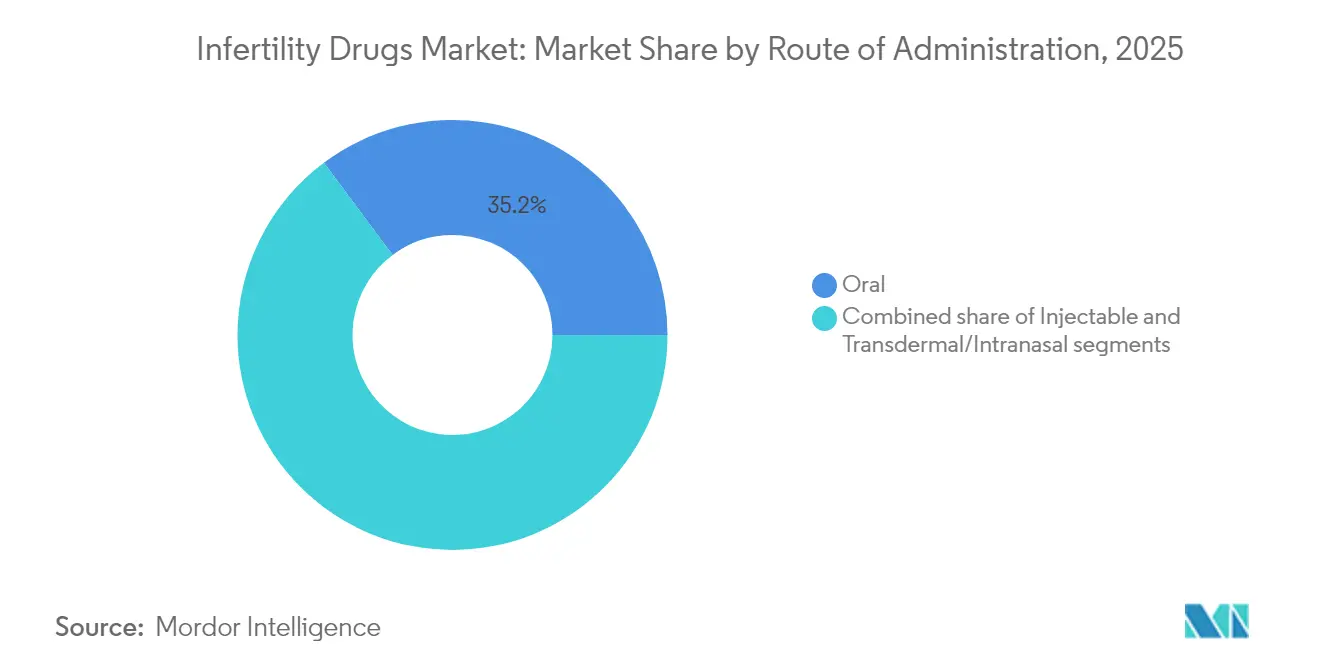
- By route of administration, oral products captured 35.21% of the infertility drugs market size in 2025; injectable formulations are expected to grow fastest at a 8.74% CAGR over 2026-2031.
- By distribution channel, retail pharmacies held 51.62% revenue share in 2025; online and specialty pharmacies are forecast to progress at a 9.28% CAGR through 2031.
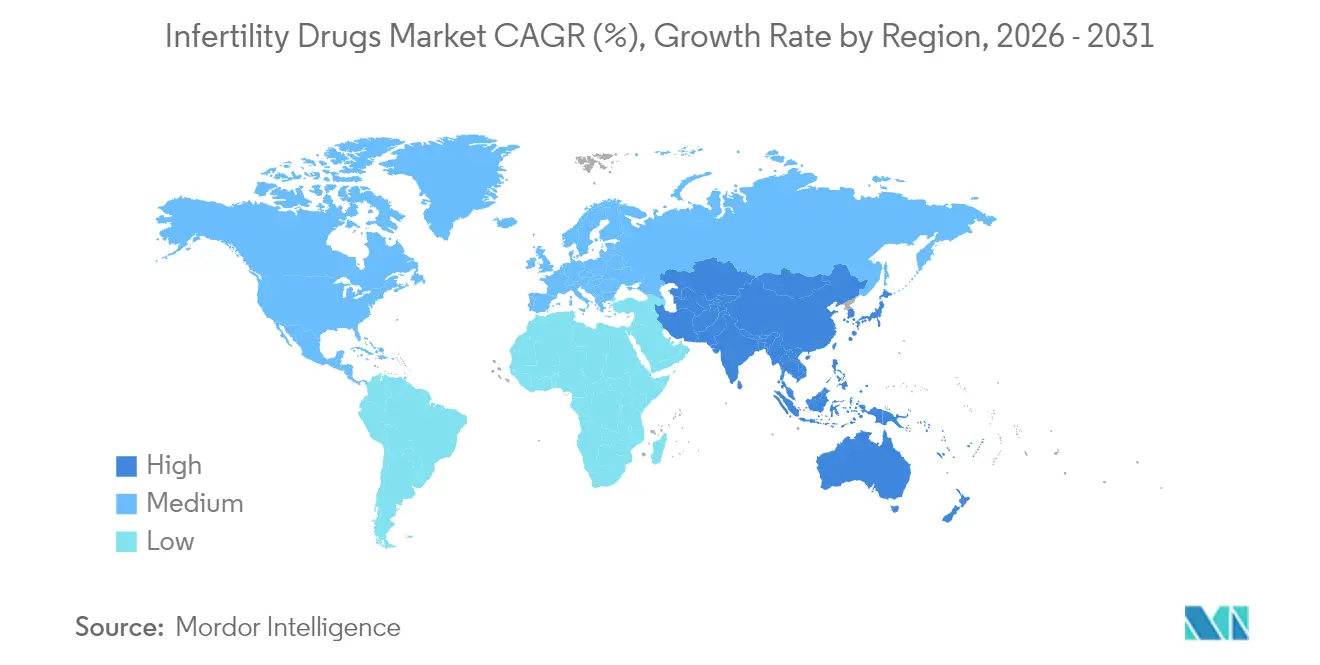
- By geography, North America commanded 35.12% of the infertility drugs market size in 2025, whereas Asia-Pacific is the fastest-growing region with a 7.18% CAGR to 2031.
Note: Market size and forecast figures in this report are generated using Mordor Intelligence’s proprietary estimation framework, updated with the latest available data and insights as of 2026.
Market Trends and Insights
Drivers Impact Analysis of Infertility Drugs Market*
| Driver | % Impact on CAGR Forecast | Geographic Relevance | Impact Timeline |
|---|---|---|---|
| Rising Infertility Prevalence Worldwide | +1.8% | Global (highest impact in APAC and MEA) | Long term (≥ 4 years) |
| Growing Adoption Of Assisted Reproductive Technologies | +1.5% | North America & EU core; expanding in APAC | Medium term (2-4 years) |
| Increasing Government And Private Reimbursement Support | +1.2% | North America, EU, select APAC markets | Short term (≤ 2 years) |
| Advancements In Biosimilar And Novel Hormonal Formulations | +0.9% | Global; regulatory advantages in EU | Medium term (2-4 years) |
| Expanding Access To Fertility Services In Emerging Markets | +0.7% | APAC core; spill-over to MEA and South America | Long term (≥ 4 years) |
| Source: Mordor Intelligence | |||
Rising Infertility Prevalence Worldwide
Roughly 186 million people live with infertility, and age-standardized prevalence now stands at 1,354.76 per 100,000 in males and 2,764.62 per 100,000 in females, trends linked to delayed childbearing, obesity and lifestyle factors. Asia-Pacific shows the sharpest rise, with secondary infertility surpassing primary infertility and polycystic ovary syndrome (PCOS) acting as a pivotal demand driver. In low-income markets, ART costs exceed 200% of GDP per capita, underscoring untapped demand once health financing improves. Urbanization and shifting career priorities lengthen the window for family planning, embedding infertility therapy in mainstream care pathways. Epidemiological projections anticipate higher infertility incidence through 2036, ensuring sustained need for pharmacologic interventions worldwide.
Increasing Government and Private Reimbursement Support
All EU member states now subsidize at least one IVF cycle, and five nations fund up to six cycles. California’s Senate Bill 729 will compel large-group insurers to cover fertility treatments from July 2025, with small-group plans required to offer coverage options. In the corporate sector, partnerships such as Cigna Healthcare with Progyny offer bundled fertility journeys, reducing out-of-pocket costs from USD 15,000–30,000 to more affordable co-pay levels. Reimbursement expansion across the United States and Europe is steering patient volumes into covered channels and reinforcing the growth of the infertility drugs market.
Advancements in Biosimilar and Novel Hormonal Formulations
Messenger-RNA expression systems are bringing down recombinant hormone production costs, opening a pipeline of lower-priced biosimilars with therapeutic parity. Organon’s licensing of SJ02, a long-acting FSH now under Chinese BLA review, illustrates industry movement toward once-weekly injections that lighten patient burden. Letrozole has overtaken clomiphene citrate as first-line therapy in PCOS, delivering an 8% higher live-birth rate. Novel oral agents such as OXO-001 achieved a 75.9% biochemical pregnancy rate in Phase 2 trials, pointing to non-hormonal modalities that could shift standard protocols. Collectively, these innovations expand physician choice and heighten competition.
Expanding Access to Fertility Services in Emerging Markets
Public–private fertility centers are multiplying across South and Southeast Asia, spurred by government incentives to counteract falling birth rates. China’s national health-care plan added six infertility drugs to the reimbursement list in 2025, cutting average co-pays by 42%[1]. Gulf states have earmarked dedicated ART budgets and are recruiting foreign embryologists to local hubs. Investment in cold-chain logistics for biologics promises better rural reach, ensuring that the infertility drugs market captures demand in secondary cities across APAC and MEA.
Restraints Impact Analysis of Infertility Drugs Market*
| Restraints Impact Analysis | (~) % Impact on CAGR Forecast | Geographic Relevance | Impact Timeline |
|---|---|---|---|
| High Treatment Costs And Limited Insurance Coverage | -1.4% | Global (highest impact in emerging markets) | Short term (≤ 2 years) |
| Stringent And Divergent Regulatory Approval Pathways | -0.8% | Global with complexity variations by region | Medium term (2-4 years) |
| Social, Ethical, And Cultural Barriers To Treatment Acceptance | -0.6% | MEA, South Asia, parts of Latin America | Long term (≥ 4 years) |
| Drug Safety Concerns Including Ovarian Hyperstimulation Risk | -0.5% | Global; heightened scrutiny in developed markets | Medium term (2-4 years) |
| Source: Mordor Intelligence | |||
High Treatment Costs and Limited Insurance Coverage
IVF medication prices rose 84% over the past decade, reaching USD 1,279 per cycle and accounting for 35% of total IVF costs, a burden that excludes many low-income patients. Average European IVF cycles cost EUR 4,000–5,000 (USD 4,300–5,400), while public wait lists can stretch to one year in several countries. In low-income regions, ART exceeds 200% of GDP per capita, rendering treatment out of reach. Although biosimilars and insurer mandates are lowering barriers, affordability remains a pivotal short-term restraint for the infertility drugs market.
Stringent and Divergent Regulatory Approval Pathways
Approval timelines vary widely among regulators; FDA biologics reviews have averaged 2,200 days for complex products, complicating patent-term planning[2]. The European Medicines Agency cleared only a handful of fertility-related molecules in its 2024 docket, reflecting high evidence thresholds[3]. Region-specific clinical trial demands raise development costs and discourage smaller biotechs from global launches. Differing biosimilar rules between the United States and Europe add further uncertainty to market entry strategies.
*Our forecasts treat driver/restraint impacts as directional, not additive. The impact forecasts reflect baseline growth, mix effects, and variable interactions.
Infertility Drugs Market Segment Analysis
By Drug Class:
Gonadotropins Hold Leadership Amid Aromatase Inhibitor MomentumGonadotropins retained 43.78% infertility drugs market share in 2025, supported by entrenched IVF protocols and physician familiarity. Organon’s Follistim AQ recorded USD 63 million in Q3 2024, a 16% rise year-over-year, illustrating robust baseline demand. Nevertheless, aromatase inhibitors are gaining traction; letrozole’s superior ovulation and live-birth rates have spurred an 8.05% CAGR forecast through 2031. Evidence from randomized trials showing a 13% higher ovulation rate versus clomiphene is accelerating guideline revisions.
Second-tier classes remain relevant. Selective estrogen receptor modulators continue to anchor first-line treatment in resource-constrained settings. Biguanides, particularly metformin, are prescribed adjunctively to improve metabolic parameters in PCOS, though they represent a small revenue slice. Dopamine agonists like cabergoline prevent ovarian hyperstimulation syndrome; comparative trials indicate equivalent efficacy to hydroxychloroquine with better tolerability. As dosing research evolves—sequential 2.5 mg letrozole/FSH protocols have achieved 72.7% cumulative pregnancy versus 59.1% for 5 mg regimens—the infertility drugs market is expected to tilt further toward targeted, lower-dose options.

By Patient Gender:
Female Therapies Dominate While Male Care AcceleratesFemale indications generated 70.76% of 2025 revenue owing to established clinical pathways and broader drug labels. Demand remains solid for ovulation-induction agents as delayed motherhood becomes common in developed economies. The male segment, however, is catching up with an 8.62% CAGR to 2031, driven by increased screening and destigmatization. Ferring Pharmaceuticals teamed with Posterity Health to roll out a Male Fertility Program, acknowledging that male factors contribute to half of infertility cases.
Therapeutic advances bolster this growth. Weekly low-dose letrozole restored fertility in 12 obese men with hypogonadotropic hypogonadism in a Canadian cohort pilot. Oxidative stress management is another frontier, as antioxidants target the 20-30% of male infertility linked to reactive oxygen species. Bioactive compounds such as resveratrol and curcumin are being explored for patients facing cancer-therapy infertility, especially prepubertal males unable to bank sperm. Simultaneous couple evaluation protocols are shifting prescribing patterns to encompass both partners, expanding the addressable pool for the infertility drugs market.
By Route of Administration:
Oral Convenience Meets Injectable EfficacyOral formulations controlled 35.21% of global revenue in 2025 and remain popular for first-line PCOS management and adjunctive therapy. Yet injectables post a 8.74% CAGR outlook because ART cycles still rely heavily on subcutaneous or intramuscular gonadotropins. The recent Phase 3 trial of single-injection rhFSH-CTP confirmed comparable clinical pregnancy rates to daily injections with improved adherence, supporting broader rollout.
Product innovation focuses on patient comfort and outcomes. Organon’s once-weekly SJ02 targets convenience without efficacy trade-offs. Oral pipeline molecules such as OXO-001, a non-hormonal endometrial modulator, achieved a 75.9% biochemical pregnancy rate in Phase 2 testing. Transdermal patches and intranasal sprays are at pre-clinical stages but promise needle-free delivery over the long term.
By Distribution Channel:
Digital Platforms Challenge Brick-and-Mortar DominanceRetail pharmacies captured 51.62% of 2025 sales through prescription capture and face-to-face counseling. However, specialty and online pharmacies are forecast to grow 9.28% annually as telehealth adoption rises. The infertility drugs market benefits from virtual consults that compress patient journeys and integrate drug dispensing. Specialty pharmacies differentiate via injection-training services, adherence monitoring and insurance navigation, driving high repeat purchase rates.
Cold-chain logistics capability is a decisive factor because many biologics require 2–8 °C storage. Online distributors investing in validated cold-chain packaging now match hospital pharmacies in product integrity. Younger demographics value discretion and doorstep delivery, making e-commerce the preferred channel for repeat cycles. In regions such as the Middle East & Africa, where retail still commands 68.5% of pharmaceutical value, omnichannel models are emerging to blend in-store pick-up with digital ordering.
Geography Analysis
North America Infertility Drugs Market
North America held 35.12% of global revenue in 2025, anchored by insurance mandates and well-resourced IVF centers. California’s upcoming coverage law is expected to add more than 2 million insured lives to the fertility cohort, reinforcing demand momentum. Corporate benefit packages, typified by Cigna–Progyny bundles, are reshaping employer offerings for millennial and Gen-Z workforces.
APAC Infertility Drugs Market
The Asia-Pacific region is the fastest-growing geography at a 7.18% CAGR through 2031. Declining birth rates in China, Japan and South Korea spur government support for ART, while nations such as Thailand and Malaysia compete for medical tourists. Single-injection rhFSH-CTP trials in Chinese women show clinical parity to western protocols, demonstrating home-grown research strength. Price differentials—USD 10,200 per IVF cycle in Singapore versus USD 2,700 in India—are channeling cross-border patient flows, expanding the infertility drugs market across ASEAN.
EMEA and South America Infertility Drugs Market
Europe presents a mature but still expanding landscape. All EU states now fund at least one IVF cycle, yet only five provide up to six fully reimbursed cycles, driving patients into private clinics to avoid long wait times. Middle East & Africa’s pharmaceutical spend rose to USD 32.6 billion in 2024, but infertility care remains nascent. Demographic infertility in MENA reaches 22.6%, signaling strong future upside if regulatory and financing frameworks improve iqvia.com. South America is at an earlier stage but is seeing rising ART uptake as Brazil, Argentina and Chile expand public financing.
Regulatory Landscape
Regulation for infertility drugs covers small molecules (for example, letrozole and clomiphene-class therapies) and complex biologics (for example, recombinant gonadotropins), with approval, labeling, and pharmacovigilance requirements led by authorities such as the US FDA and the European Medicines Agency (EMA). In the EU, centralized authorizations and lifecycle surveillance show up through EMA EPAR maintenance for key fertility medicines, including Puregon, Pergoveris, Bemfola (biosimilar follitropin alfa), and Elonva, where periodic EPAR updates reflect ongoing post-authorization oversight.
Policy and standards are also shifting toward more unified clinical governance and expedited access tools. In November 2025, the World Health Organization issued its first global guideline on infertility (40 recommendations), giving countries a reference point to align diagnosis and treatment pathways and reinforcing expectations around evidence-based prescribing and patient information. Separately, the FDA introduced the Commissioner’s National Priority Voucher (CNPV) pilot in 2025, and in October 2025 EMD Serono stated plans to file Pergoveris under this program, highlighting how expedited review mechanisms are being applied to fertility portfolios alongside conventional regulatory routes.
Value Chain Analysis
The infertility drugs value chain starts with API and biologics raw materials, including recombinant inputs for gonadotropins, followed by formulation and fill-finish under GMP controls. Temperature-sensitive injectables used in IVF protocols also require cold-chain qualified packaging, and the regulatory expectation for documented control of starting materials and comparability during site transfers is especially relevant for biologics. This pushes manufacturers toward validated quality systems and redundancy planning to avoid disruptions during patient treatment windows.
Downstream, distribution is increasingly a blend of specialty and digital or mail-order fulfillment with traditional hospital and retail channels. Patient services such as injection training, benefits verification, and adherence monitoring also shape demand. Supply-side actions reinforce the operating focus on scalable manufacturing and reliable last-mile delivery: Cosmos Health reported a three-year manufacturing agreement to produce 3.9 million units of progesterone vaginal pessaries (VASCLOR GEST) via Verisfield S.A., while Invictus Pharmacy and Mullan Pharmaceutical announced a partnership to distribute FDA-approved ganirelix acetate injection through Invictus Pharmacy’s digital and mail-order infrastructure.
Competitive Landscape
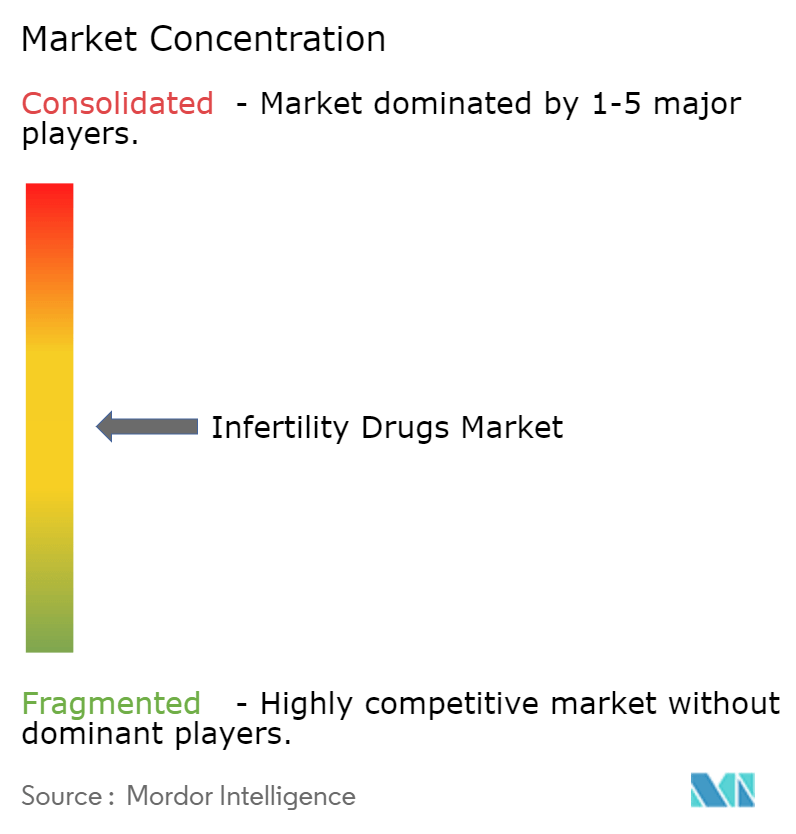
The infertility drugs market is moderately fragmented. Merck KGaA generated EUR 1.5 billion (USD 1.6 billion) from fertility products in 2024, posting 0.8% organic growth despite tough comps. Organon’s women’s health division recorded USD 440 million in 2024, helped by Follistim AQ’s 16% revenue increase. Ferring Pharmaceuticals continues to anchor the injectables space and recently published data on equitable access and gonadotropin selection.
Strategy centers on partnerships and licensing to broaden pipelines quickly. Organon’s deal for SJ02 offers geographic reach in China, while emerging firms like Gameto are advancing induced-pluripotent-cell technology to reduce hormone exposures by 80%. Artificial intelligence in IVF labs is raising success rates and serving as a competitive differentiator. Venture capital appetite is healthy; ReproNovo closed a USD 65 million Series A for leflutrozole (RPN-001) targeting male infertility and nolasiban (RPN-002) for adenomyosis.
Pipeline differentiation is sharpening. Long-acting injectables, oral non-hormonal agents and male-specific therapies are high-priority areas. Biosimilar competition is expected to intensify in Europe first, pressuring price points but widening patient access.
Infertility Drugs Industry Leaders
-
Ferring Pharmaceuticals Inc
-
Pfizer Inc.
-
Merck KGaA
-
Bayer AG
-
Novartis AG
- *Disclaimer: Major Players sorted in no particular order
Infertility Drugs Market Companies Covered in this Report
- Merck
- Ferring Pharmaceuticals
- Pfizer
- Bayer
- Novartis
- Teva Pharmaceutical Industries
- Theramex
- Mankind Pharma
- Livzon Pharmaceutical
- Organon
- ASKA Pharmaceutical
- Zydus Lifesciences
- Gedeon Richter PLC
- Ipsen
- Sun Pharmaceuticals Industries
- Cipla
- Myovant Sciences
Market Opportunities and Future Outlook
White space is clearest where affordability and convenience constraints intersect, particularly for injectable gonadotropins and ovulation-suppression agents that depend on cold-chain logistics and cycle timing. The FDA’s Commissioner’s National Priority Voucher (CNPV) pilot launched in June 2025 offers a pathway that can compress review timelines for selected candidates. That creates an opening for manufacturers with mature dossiers, including biosimilars and follow-on biologics, to accelerate time-to-market in the United States.
China is also expanding access levers. The national health-care plan added six infertility drugs to reimbursement in 2025, and domestic regulatory activity continues to support local recombinant manufacturing, evidenced by Livzon MABPharm receiving an NMPA drug registration certificate in June 2026 for recombinant human follitropin alfa solution for injection. Demand pockets are also forming beyond traditional IVF center dispensing: in January 2026, Femasys reported initial commercial use of FemaSeed Complete, a first-line fertility treatment used by OB-GYNs. In parallel, activity around long-acting FSH and biosimilar gonadotropins, including China launches and ongoing EMA lifecycle updates for established products, points to an opportunity for once-weekly or reduced-burden regimens that better fit telehealth-enabled workflows and specialty pharmacy fulfillment, while widening access via lower-cost options.
Recent Industry Developments in Infertility Drugs Market
- April 2026: Ferring Pharmaceuticals terminated two Phase 1 clinical trials (Celestial-1 and Celestial-2) for an infertility candidate that combined choriogonadotropin beta with Rekovelle following a portfolio assessment. The change reallocates R&D focus away from that combination approach and indicates tighter prioritization within fertility pipelines.
- October 2025: EMD Serono (Merck KGaA) announced an agreement with the US government to expand access to IVF therapies, offering direct-to-consumer availability for products including Gonal-f, Ovidrel, and Cetrotide through a government-affiliated pathway with an 84% cumulative discount. By linking access and pricing to a large manufacturer portfolio, the program can shift purchasing behavior and intensify competitive pressure on comparable branded and biosimilar regimens.
- June 2024: Ferring Pharmaceuticals partnered with Posterity Health to launch a Male Fertility Program on Ferring's Fertility Out Loud platform. This expands the commercial ecosystem around male-factor infertility care, supporting earlier diagnosis and treatment initiation that can broaden demand for male-focused pharmacologic and adjunct therapy pathways.
Infertility Drugs Market Report Scope and Research Methodology
Market Definition and Coverage
This market covers prescription drug revenues generated from infertility medications used in medically diagnosed infertility care, where the intent is to induce or regulate ovulation or support spermatogenesis. Values are captured on a sales basis across key regions and then consolidated to a global total.
Scope exclusions: We do not count over-the-counter fertility supplements, IVF or ICSI procedure fees, and assisted reproduction equipment and lab consumables.
Segments Covered in This Report
- By Drug Class
- Gonadotropins
- Selective Estrogen Receptor Modulators (SERMs)
- Aromatase Inhibitors
- Biguanides (Metformin)
- Dopamine Agonists
- Other Drug Classes
- By Patient Gender
- Female
- Male
- By Route Of Administration
- Oral
- Injectable (SC / IM)
- Transdermal / Intranasal
- By Distribution Channel
- Hospital Pharmacies
- Retail Pharmacies
- Online & Specialty Pharmacies
- Geography
- North America
- United States
- Canada
- Mexico
- Europe
- Germany
- United Kingdom
- France
- Italy
- Spain
- Rest of Europe
- Asia-Pacific
- China
- Japan
- India
- Australia
- South Korea
- Rest of Asia-Pacific
- Middle East & Africa
- GCC
- South Africa
- Rest of Middle East & Africa
- South America
- Brazil
- Argentina
- Rest of South America
- North America
Data Sources, Market Sizing, and Validation
Desk Research
Desk work starts with building the demand and policy context for infertility treatment, and then mapping how drug use links to care pathways. Public sources such as the World Health Organization, the US CDC, OECD health indicators, and national health ministries help us anchor infertility prevalence, age distribution, and treatment access trends. We also review drug regulator and safety information such as the US FDA, EMA, and other national agencies to understand approvals, label updates, and biosimilar entry points that can shift pricing and utilization.
To translate the context into a workable market model, we use company filings and investor presentations to understand product mix direction, geographic exposure, and channel shifts. These assumptions are then cross-checked with reputable press coverage and association updates from fertility societies where available. In parallel, patent databases are screened to track late-stage pipeline activity and expected launch timing, and an import or export shipment-level database is used selectively in markets where trade flows are a useful signal for hormone injectables. The desk sources listed here are illustrative, and many other public references were also used for data collection, validation, and clarification.
Primary Interviews and Surveys
Primary work is used to pressure-test assumptions that are hard to validate from public sources, especially for therapy switching, refill patterns, and price movement by channel. We speak with stakeholders across the value chain such as fertility clinic decision makers, prescribing specialists, hospital and retail pharmacists, distributors, and reimbursement or tender-facing experts across APAC, EMEA, and the Americas. These discussions help us narrow realistic utilization per treatment cycle and align our forecast drivers with what is being observed in current practice.
Distribution of primary research fieldwork respondents
| Company type | Respondent position | Region |
|---|---|---|
| Top tier: 34% | CXOs: 15% | APAC: 39% |
| Mid tier: 49% | Functional/Unit leaders: 25% | EMEA: 37% |
| Smaller Players: 17% | Managers: 60% | Americas: 24% |
Market-Sizing & Forecasting
Sizing is built first using a top-down approach where treated patient pools are reconstructed from infertility prevalence, the share seeking medical help, and the share receiving drug-supported cycles through clinics and pharmacies. Those pools are then converted into value using class-level utilization per cycle and an average selling price that reflects the common mix of brands, biosimilars, and dispensing channels. Since pricing can vary between public and private routes, we apply country-level currency conversion timing consistently and track inflation-linked price movement.
The outputs are then corroborated with selective bottom-up approximations, such as supplier and distributor revenue direction checks, channel feedback on volume growth, and sampled ASP x volume logic for major drug classes. Key inputs that typically matter in this market include maternal age trend and birth postponement indicators, ART cycle volumes as an indirect demand signal, reimbursement or coverage changes, biosimilar penetration for gonadotropins, and shifts between hospital, retail, and online pharmacy dispensing. Forecasting is handled through scenario analysis supported by expert consensus on these variables, and when a data gap exists for smaller countries, we use proxy indicators from comparable markets before results are normalized back to regional totals.
Data Validation & Update Cycle
Validation is done through multiple checks so the final number does not rely on one data stream. Model totals are compared with independent signals like treatment volumes, channel inventory commentary, and regulatory or reimbursement events, and then variances are reviewed until the direction and magnitude make practical sense. A second analyst review is completed for assumption logic, calculations, and year-to-year continuity, which helps catch outliers like sudden price jumps that are not supported by market behavior.
The report is refreshed annually, and interim updates are triggered when material events occur, such as major approval changes, meaningful biosimilar launches, or reimbursement policy shifts. Before delivery, we run a fresh pass on key inputs and currency timing so clients receive an up-to-date view aligned with the latest public and primary signals.
Mordor Intelligence's Infertility Drugs Market Sizing Compared With Other Published Estimates
Published market values for infertility drugs can differ even when the topic sounds identical, because firms do not always apply the same time base, currency conversion timing, or pricing logic for injectables versus oral therapies. Differences also show up when one study leans more on headline prevalence numbers, while another tries to tie demand to treated cycles and channel mix.
The biggest gap drivers usually come from scope edges and refresh cadence, such as whether OTC fertility supplements are blended into the drug total, whether procedure-linked revenues are mistakenly mixed in, and how fast biosimilar price erosion is updated in the model. Using a consistent annual refresh with a clear FX timing rule and cycle-level utilization checks keeps the 2026 estimate at USD 4.47 B in line with current channel reality, which is a key reason the figure published by Mordor Intelligence does not match every 2025-based estimate.
Benchmark comparison
| Source | Market Size | Gaps in Research Methodology |
|---|---|---|
| Mordor Intelligence | USD 4.47 B (2026) | |
| Global Consultancy A | USD 4.18 B (2025) | Uses a 2025 base year and a longer forecast window, and the public summary does not clarify how ASP is updated for biosimilars and channel mix, which can shift value totals even if volumes are similar. |
| Industry Publisher B | USD 4.10 B (2025) | Starts from a 2025 base and presents broad segmentation, but the disclosed approach does not spell out exclusions around supplements or how cycle-level utilization and FX timing are applied, which can create a lower or higher starting value. |
Across the three numbers, most of the spread is explained by year selection and pricing treatment rather than a disagreement that demand is growing. By keeping the scope limited to prescription infertility drugs and tying value to treated cycles, channel mix, and refreshed ASP assumptions, our model stays traceable to inputs a reader can verify and discuss with market participants.
Key Questions Answered in the Report
How big is the Infertility Drugs Market?
The Infertility Drugs Market size is expected to reach USD 4.47 billion in 2026 and grow at a CAGR of 5.83% to reach USD 5.93 billion by 2031.
Who are the key players in Infertility Drugs Market?
Ferring Pharmaceuticals Inc, Pfizer Inc., Merck KGaA, Novartis International AG and Bayer AG are the major companies operating in the Infertility Drugs Market.
Which is the fastest growing region in Infertility Drugs Market?
Asia Pacific is estimated to grow at the highest CAGR over the forecast period (2026-2031).
Which region has the biggest share in Infertility Drugs Market?
In 2025, the North America accounts for the largest market share in Infertility Drugs Market.