
Industrial Vacuum Cleaner Market Size and Share
Market Overview
| Study Period | 2020 - 2031 |
|---|---|
| Market Size (2026) | USD 1.11 Billion |
| Market Size (2031) | USD 1.45 Billion |
| Growth Rate (2026 - 2031) | 5.55% CAGR |
| Fastest Growing Market | Asia-Pacific |
| Largest Market | Europe |
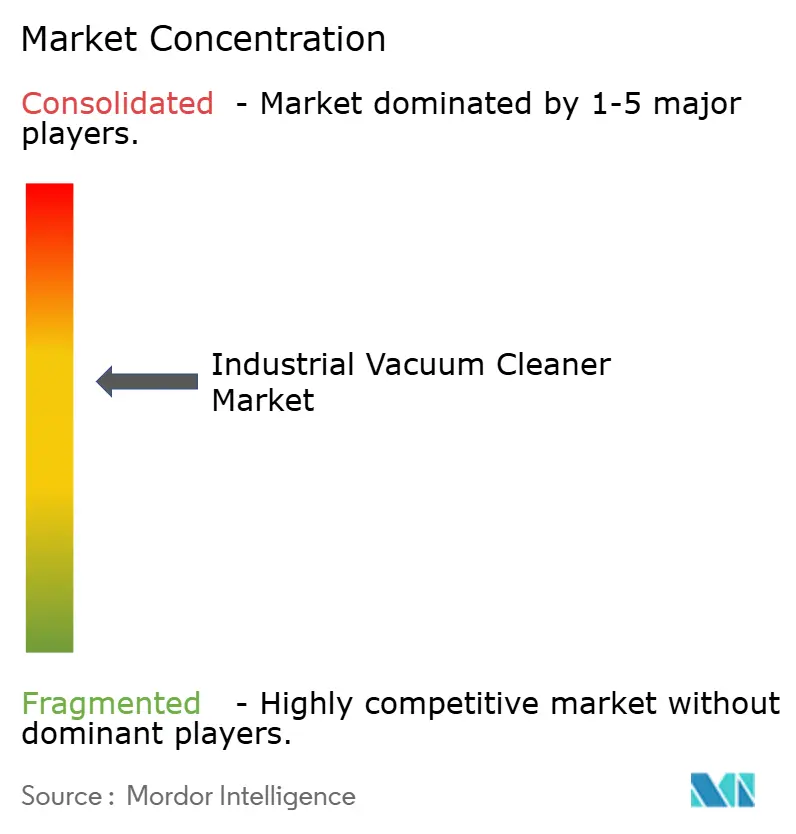
| Market Concentration | Medium |
Major Players *Disclaimer: Major Players sorted in no particular order Image © Mordor Intelligence. Reuse requires attribution under CC BY 4.0. | |
Industrial Vacuum Cleaner Market Analysis by Mordor Intelligence
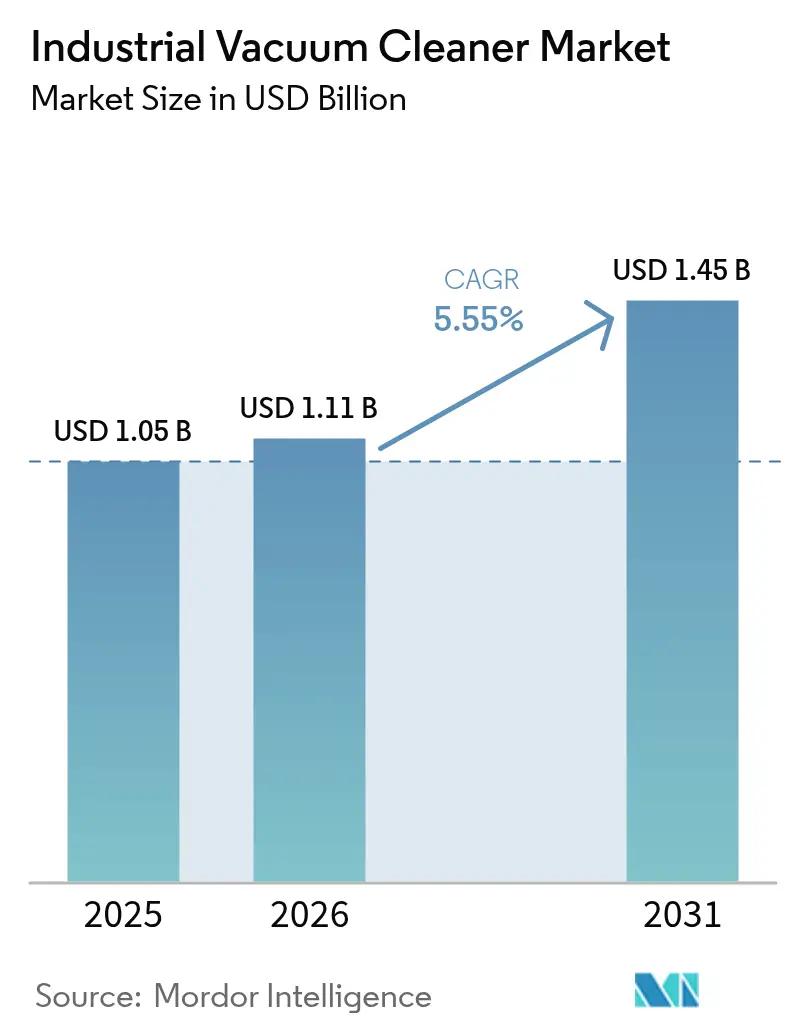
The industrial vacuum cleaners market size was valued at USD 1.05 billion in 2025 and estimated to grow from USD 1.11 billion in 2026 to reach USD 1.45 billion by 2031, at a CAGR of 5.55% during the forecast period (2026-2031). The moderate but steady expansion mirrors rising automation investments, stricter combustible-dust regulations and growing adoption of connected cleaning equipment across manufacturing floors worldwide. Strengthening enforcement of NFPA 660 in North America and comparable directives in Europe has accelerated replacement cycles, while Asia-Pacific’s contract cleaning boom adds incremental demand. Product innovation is shifting toward explosion-proof, battery-electric and autonomous platforms that allow round-the-clock operation in “lights-out” factories. Meanwhile, supply-chain volatility and raw-material price spikes, particularly in copper and steel, continue to compress manufacturer margins even as value-added features support premium pricing.
Key Report Takeaways
- By product type, canister systems led with 47.60% revenue share of the industrial vacuum cleaners market in 2025; explosion-proof ATEX-certified units are projected to expand at an 8.02% CAGR through 2031.
- By power source, electric corded units accounted for 61.40% of the industrial vacuum cleaners market size in 2025, whereas battery-electric platforms are expected to grow at a 9.05% CAGR to 2031.
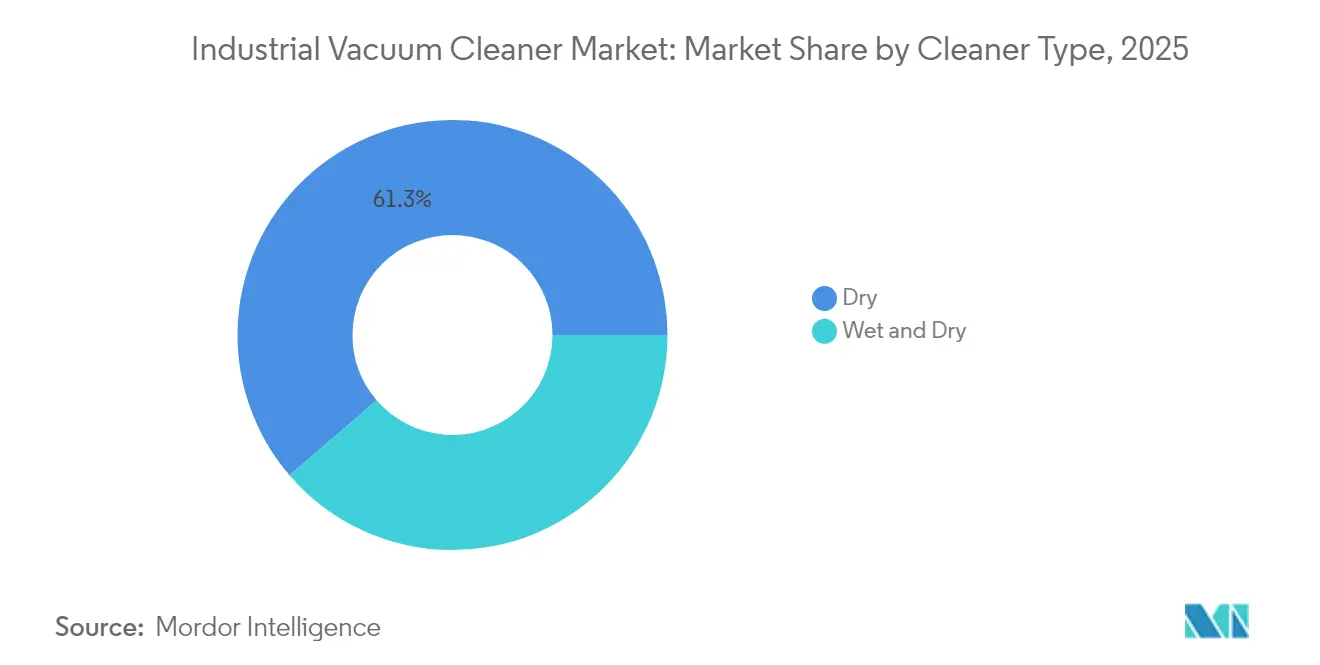
- By cleaner type, dry systems held 61.30% of the industrial vacuum cleaners market share in 2025, while wet-and-dry models are advancing at a 7.01% CAGR.
- By end-user industry, general manufacturing contributed 25.60% revenue in 2025, yet electronics and semiconductor facilities are forecast to post the fastest 9.38% CAGR.
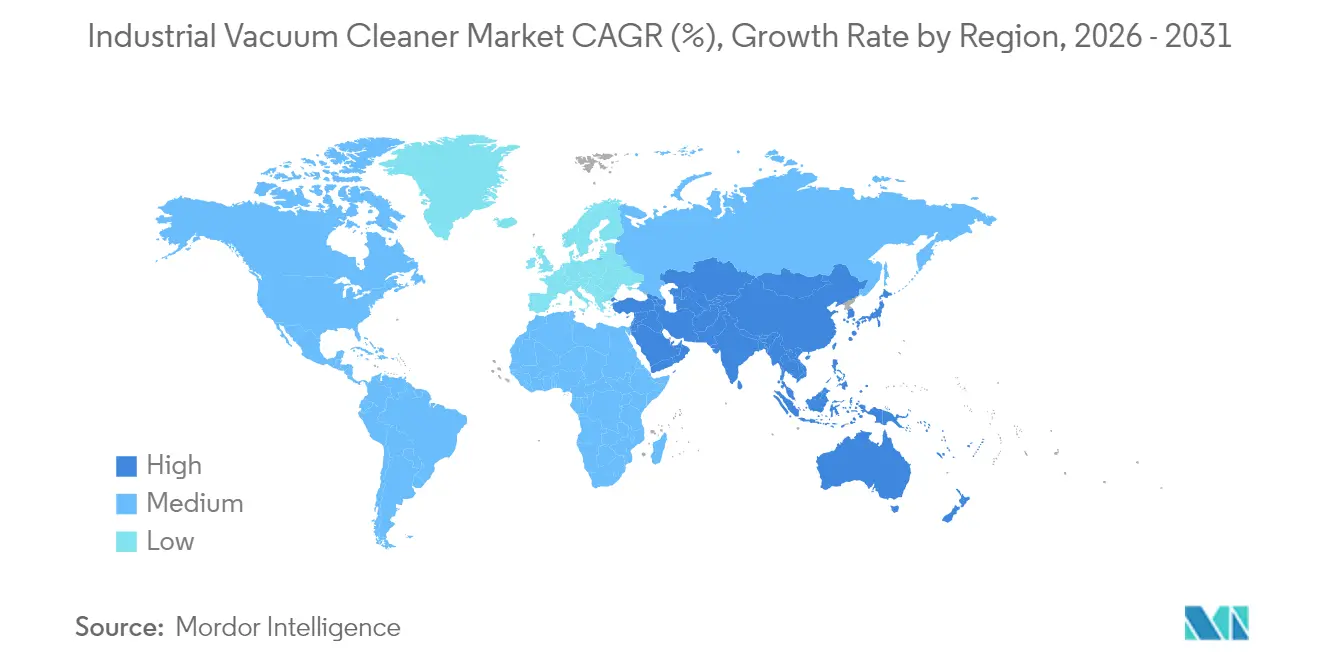
- By geography, Europe retained 31.70% revenue share in 2025; Asia-Pacific is on course for the highest 7.63% CAGR between 2026-2031.
Note: Market size and forecast figures in this report are generated using Mordor Intelligence’s proprietary estimation framework, updated with the latest available data and insights as of 2026.
Global Industrial Vacuum Cleaner Market Trends and Insights
Drivers Impact Analysis*
| Driver | (~) % Impact on CAGR Forecast | Geographic Relevance | Impact Timeline |
|---|---|---|---|
| Automation of "lights-out" factories | +1.2% | Global, with concentration in Germany, Japan, South Korea | Medium term (2-4 years) |
| Tighter OSHA combustible-dust enforcement | +0.8% | North America & EU | Short term (≤ 2 years) |
| Expansion of battery-powered heavy-duty platforms | +1.5% | Global | Medium term (2-4 years) |
| Surge in demand from additive-manufacturing clean-rooms | +0.7% | APAC core, spill-over to North America | Long term (≥ 4 years) |
| ESG-linked procurement mandates (green vacuums) | +0.6% | Global, early adoption in EU & North America | Long term (≥ 4 years) |
| Growth of contract cleaning in emerging markets | +0.9% | APAC, Latin America, MEA | Long term (≥ 4 years) |
| Source: Mordor Intelligence | |||
Automation of “lights-out” factories
Growing deployment of unmanned production lines in automotive, semiconductor and medical-device facilities requires autonomous cleaning equipment that can operate safely without human intervention. Smart industrial vacuum cleaners integrate LiDAR navigation, IoT sensors and predictive maintenance algorithms to collect debris continuously, safeguard precision machinery and notify technicians before filter clogs trigger downtime.[1]Alfred Kärcher Vertriebs-GmbH, “Sustainability Report 2023,” kaercher.com Factory operators view these systems as essential infrastructure because contamination control is inseparable from product yield and regulatory compliance. As a result, equipment makers are redesigning chassis to house on-board compute modules and expanding API libraries so vacuums share data with MES and SCADA platforms. The business case hinges on lower life-cycle cost rather than unit price, reinforcing a shift toward outcome-based service contracts and recurring software revenues.
Tighter OSHA combustible-dust enforcement
The rollout of NFPA 660 in December 2024 unified six earlier standards and raised the bar for dust hazard analysis, minimum conveying velocities and documentation. Inspections have spurred an immediate uptick in procurement of Class II, Division 2-rated vacuums equipped with metal-bonded antistatic hoses and redundant grounding paths.[2]VAC-U-MAX, “Industrial Vacuum Cleaners: Arresting Pervasive Combustible Fugitive Coal Dust,” vac-u-max.com Woodworking, food-processing and pharmaceutical plants that once relied on modified shop-vacs are now buying purpose-built ATEX units to avoid six-figure penalties. The enforcement wave also shortens replacement cycles as operators retire non-compliant legacy equipment in favor of certified models that simplify audits and insurance underwriting.
Expansion of battery-powered heavy-duty platforms
Advances in high-energy-density lithium-ion packs and brushless motors are eliminating historic runtime and suction-power gaps versus corded machines. Makita’s 40 V XGT series already delivers 148 CFM airflow and 92-inch water-lift while offering a 60-minute duty cycle on a single charge.[3]Makita USA, “Product Details – GCV02PMU,” makitatools.com Field data shows productivity gains in mezzanines, racking and outdoor work zones where extension cords impede throughput or create trip hazards. Facility managers value reduced downtime between shifts and simplified lock-out/tag-out protocols. Although cycle life in 24/7 duty remains a constraint, road-mapped dry-coating cell chemistries promise 17%-30% cost reduction and faster charging, accelerating cordless penetration by 2028.
Surge in demand from additive-manufacturing clean rooms
Metal-powder 3D printing for aerospace and orthopedic implants generates combustible dust and requires ISO 14644 compliance. Specialized vacuums equipped with inert gas blanketing, cyclone pre-separators and HEPA/ULPA filtration mitigate explosion risk while preserving air quality in contiguous build areas. RUWAC’s inert vacuum line, engineered for reactive alloys, highlights this niche demand. Semiconductor fabs adopting additive manufacturing for tooling components further widen the addressable base, pushing vendors to develop modular accessories suited for rapid material changeovers.
Restraints Impact Analysis*
| Restraint | (~) % Impact on CAGR Forecast | Geographic Relevance | Impact Timeline |
|---|---|---|---|
| High CapEx for ATEX-rated units | -0.9% | Global, particularly acute in emerging markets | Short term (≤ 2 years) |
| Skilled-operator shortage for multi-motor systems | -0.7% | North America & EU | Medium term (2-4 years) |
| Limited battery-cycle life in 24/7 industrial duty | -0.6% | Global | Medium term (2-4 years) |
| Rising raw-material (copper/steel) costs | -1.1% | Global | Short term (≤ 2 years) |
| Source: Mordor Intelligence | |||
High CapEx for ATEX-rated units
Explosion-proof vacuums cost two-to-four times more than standard models because of sealed housings, intrinsically safe switches and fully grounded air pathways. A mid-size battery plant may need ten or more units, pushing initial outlays above USD 100,000—a hurdle for Asian contract cleaners that operate on tight, three-year payback horizons. Some firms postpone upgrades until an OSHA citation or customer audit forces action, which defers revenue for OEMs and prolongs installed-base turnover.
Skilled-operator shortage for multi-motor systems
North American and European factories expect a 1.9 million worker deficit by 2033, eroding the pool of technicians able to service twin-impeller or regenerative-blower vacuums. To compensate, manufacturers are embedding self-diagnostic firmware and tool-free filter-change mechanisms. While these design concessions broaden usability, they also raise R&D overhead and can limit customization options valued by niche users.
*Our forecasts treat driver/restraint impacts as directional, not additive. The impact forecasts reflect baseline growth, mix effects, and variable interactions.
Segment Analysis
By Product Type: Regulatory Pressure Fuels Explosion-Proof Adoption
Canister designs retained a 47.60% share of the industrial vacuum cleaners market in 2025 thanks to all-purpose functionality and existing maintenance familiarity. Demand spans automotive assembly, woodworking and general manufacturing, where facility managers prioritize proven reliability. Explosion-proof units, while still niche, posted the fastest 8.02% CAGR outlook as NFPA 660 compliance deadlines tighten. The industrial vacuum cleaners market size for these certified systems is forecast to approach USD 0.46 billion by 2031, reflecting heightened safety mandates. Upright and backpack models cater to textile and construction tasks requiring maneuverability, whereas central systems dominate multi-line plants needing energy-efficient, facility-wide suction.
New patent filings on modular power-driven vacuums illustrate convergence between form factors; OEMs are designing common motor heads that attach to canister, wall-mount or trolley bases. This platform approach spreads R&D cost across product families and simplifies spare-parts logistics. It also supports rapid adaptation to varying hazard classifications by swapping antistatic accessories or HEPA cartridges without retooling.


By Power Source: Cordless Penetration Accelerates
Electric corded machines still dominate with 61.40% share due to unlimited runtime, making them indispensable for shift-based production. Yet battery-electric units exhibit a 9.05% CAGR, outpacing all other power sources as lithium-ion advances close the performance gap. The industrial vacuum cleaners market share for cordless variants could surpass 29.10% by 2031 if advertised energy-density roadmaps materialize. Pneumatic options remain relevant where eliminating electrical ignition sources outweighs higher compressed-air costs, typical in petrochemical and underground mining sites.
Manufacturers are bundling chargers, telemetry modules and fleet-management apps to sell “power-as-a-service” subscriptions that guarantee uptime and automate battery health analytics. This business-model shift aligns with facilities’ move toward opex-oriented budgeting and reduces capital-allocation hurdles for new equipment.
By Cleaner Type: One-Tool Versatility Drives Wet-Dry Upswing
Dry vacuums accounted for 61.30% revenue in 2025, but wet-and-dry hybrids are gaining share at a 7.01% CAGR. Consolidated food-processing plants value a single tool that handles both powder spills and viscous liquids, cutting inventory and training costs. The industrial vacuum cleaners market size for wet-dry units is expected to exceed USD 0.50 billion by 2031. Technological gains in multi-stage filtration now prevent cross-contamination and maintain airflow even when liquids are collected, alleviating historic performance trade-offs.
Delfin’s M-class antistatic filters and automatic float shut-offs exemplify innovations enhancing safety while meeting ATEX Zone 22 requirements. Future growth hinges on integrating real-time viscosity detection that auto-adjusts suction parameters, a feature under development across several OEM roadmaps.
By End-User Industry: Semiconductor Clean-Room Demand Peaks
General manufacturing remained the largest consumer with 25.60% share, but electronics and semiconductor facilities will post the highest 9.38% CAGR as fab operators race to sub-3-nm geometries. Clean-room expansions in Taiwan, South Korea and India drive adoption of ULPA-filtered vacuums and closed-loop reclaim systems for valuable rare-earth dust. Industrial vacuum cleaners industry suppliers are partnering with tool OEMs to embed data hooks that feed into fab-wide environmental monitoring dashboards.
Food and beverage processors represent a stable demand base, underpinned by hygiene codes and rising global protein consumption. Pharmaceuticals require the costliest HEPA caps and stainless-steel bodies to withstand aggressive sanitizing chemicals, supporting higher average selling prices. Building and construction segments benefit from battery platforms that remove silica dust in compliance with OSHA 1926.1153 for concrete works, creating a long-tail market that values portability over continuous runtime.
Geography Analysis
Europe commanded 31.70% of global revenue in 2025, a position anchored by stringent ATEX directives and advanced automation adoption across Germany’s machinery corridors and France’s expanding biologics clusters. The region’s long-standing regulatory clarity allows suppliers to amortize certification costs over a predictable installed base and to price premium features without heavy discounting. EU manufacturers also leverage sustainability legislation to differentiate via energy-efficient motors and recycled-material housings.
Asia-Pacific is the fastest-growing territory, projected at a 7.63% CAGR through 2031. China’s multibillion-dollar semiconductor build-out, India’s USD 160 billion pharma expansion and Southeast Asia’s electronics assembly growth collectively boost demand for clean-room-ready vacuums. Contract cleaning companies across the region purchase fleet quantities, accelerating unit volumes. Acquisitions such as Piab Group’s purchase of Tianjin FeiYun underscore the strategic race for local manufacturing and distribution nodes that shorten lead times.
North America maintains a solid outlook supported by reshoring incentives and escalating OSHA inspections. U.S. battery and automotive plants upgrading to Industry 4.0 layouts increasingly specify autonomous or IoT-enabled vacuums that integrate with factory MES. Canada’s mining and pulp industries continue to demand high-capacity pneumatic units, while Mexico’s near-shoring boom in aerospace components lifts regional sales of portable ATEX vacuums for aluminum dust mitigation.

Regulatory Landscape
Industrial vacuum cleaners are increasingly treated as safety equipment in dust-prone operations, which ties buying cycles to combustible-dust and hazardous-location requirements. In the United States, facilities handling combustible particulate typically map equipment selection to OSHA hazardous location rules (for example, 29 CFR 1910.307) and related NFPA practices, a stance that has supported demand for certified units rather than modified consumer vacuums.
In Europe, equipment intended for potentially explosive atmospheres must comply with the ATEX Directive 2014/34/EU, with performance and construction requirements referenced through standards such as EN 17348:2022 for explosion-protected vacuum cleaners. The compliance backdrop is also shifting as the EU Machinery Regulation (EU) 2023/1230 replaces the Machinery Directive 2006/42/EC with mandatory application from January 2027, adding requirements such as digital documentation for connected and software-enabled machinery. In March 2026, Implementing Decision (EU) 2026/546 updated the list of harmonized standards supporting conformity under the existing directive, keeping compliance alignment active during the transition period.
Competitive Landscape
The industrial vacuum cleaners market features moderate fragmentation: the top five vendors account for just above 40% of revenue, preserving space for regional specialists. Kärcher invested EUR 200 million (USD 219 million) in 2024 to expand production in Vietnam and automatize German plants, aiming to reduce lead times and offset European labor costs. Nilfisk deepened its robotics push through a partnership with Singapore-based LionsBot, gaining autonomous-navigation IP without diluting R&D budgets.
Tennant continues to emphasize software-enabled maintenance dashboards, driving recurring revenue streams that cushioned 2024 raw-material inflation. Great Star Tools’ acquisition of Shop-Vac shows how hand-tool conglomerates enter adjacent cleaning equipment markets to leverage shared retail channels and sourcing economies. Smaller niche players, particularly those focused on ATEX customization, face consolidation pressure as copper and steel volatility erodes margins. Patent activity remains brisk in high-efficiency impeller designs and variable-frequency drive controls, suggesting future performance leaps that could reset competitive positioning.
Industrial Vacuum Cleaner Industry Leaders
Alfred Kärcher GmbH & Co. KG
Tennant Company
American Vacuum Company
Hoover Commercial
Nilfisk A/S
- *Disclaimer: Major Players sorted in no particular order

Market Opportunities and Future Outlook
Opportunity is concentrating around connected, audit-ready vacuum systems that can reduce compliance effort and minimize downtime in high-sensitivity environments. Electronics and semiconductor manufacturing, the fastest-growing end-user pocket in this report, is pulling demand toward contamination control (HEPA/ULPA filtration, sealed handling of valuable dust) and data hooks that feed into fab environmental monitoring, aligning with OEM work to integrate sensors and diagnostics. Industry commentary from 2026 has also pointed to IoT sensor integration for real-time monitoring of operating conditions (such as pressure and temperature) in smart-factory vacuum systems, which supports predictive maintenance and service-led business models rather than one-time equipment sales.
There is also room to expand centralized industrial housekeeping and vacuum networks in large facilities where safety and productivity depend on consistent dust capture across multiple work zones. Case-based adoption narratives in industrial housekeeping, including centralized vacuum system implementations referenced by Nederman, indicate openings for suppliers that combine engineered systems, filtration media, and long-term maintenance support. Separately, as cordless heavy-duty platforms gain share, suppliers that can pair battery platforms with fleet management and compliance documentation (for dust classes and hazardous zones) can differentiate beyond suction performance, particularly in building and construction and in maintenance-intensive plants where mobility and reduced trip hazards matter.
Recent Industry Developments
- March 2026: Truvox International partnered with Pacvac under an OEM agreement to introduce the Valet Backpack PRO Battery, expanding cordless backpack offerings for professional and light-industrial applications. The move strengthens battery-powered portfolios where portability and faster turnarounds matter, supporting replacement of corded units in facility maintenance workflows.
- February 2026: Xerowaste Solutions launched the Comzu F3313 cordless industrial vacuum cleaner featuring a lithium-iron phosphate (LiFePO4) battery and a 412 CFM claim. The launch reflects ongoing product investment in safer, durable battery chemistries and higher airflow targets that support cordless use in demanding industrial settings.
- May 2025: Alfred Kaercher GmbH and Co. KG partnered with Brain Corp to debut the KIRA CV 60/1 autonomous professional robotic vacuum. By combining Kaercher cleaning hardware with Brain Corp autonomy, the partnership supports robotic cleaning adoption as facilities address labor constraints and seek more consistent cleaning in automated operations.


Research Methodology Framework and Report Scope
Market Definition and Coverage
This market covers revenue generated from industrial vacuum cleaners used for factory, workshop, and site cleaning where dust, liquids, and debris must be collected safely and repeatedly, including portable and fixed industrial units across major regions.
Scope exclusions: We exclude household vacuum cleaners and carpet care devices, along with general floor scrubbers that do not include vacuum extraction as a core function.
Segmentation Overview
- By Product Type
- Upright
- Canister
- Backpack
- Central/Fixed
- Explosion-proof (ATEX/NEC)
- By Power Source
- Electric (Corded)
- Battery-Electric
- Pneumatic
- By Cleaner Type
- Dry
- Wet and Dry
- By End-user Industry
- Food and Beverage
- Metalworking and Foundries
- Pharmaceuticals and Biotechnology
- General Manufacturing
- Building and Construction
- Electronics / Semiconductor
- Other End-user Industries (Chemicals, Energy, Etc.)
- By Geography
- North America
- United States
- Canada
- Mexico
- Europe
- Germany
- United Kingdom
- France
- Italy
- Spain
- Russia
- Rest of Europe
- Asia-Pacific
- China
- Japan
- India
- South Korea
- Australia
- Rest of Asia-Pacific
- South America
- Brazil
- Argentina
- Chile
- Rest of South America
- Middle East
- Saudi Arabia
- United Arab Emirates
- Rest of Middle East
- Africa
- South Africa
- Rest of Africa
- North America
Data Sources, Market Sizing, and Validation
Desk Research
Desk work starts by mapping the demand pool to industrial activity, cleaning compliance, and installed base needs, then translating that into units and value. We referenced public sources such as US Census Bureau manufacturing statistics, Eurostat industry output series, UN Comtrade trade flows for relevant equipment categories, ILO workplace safety publications, and OSHA and EU-OSHA guidance on dust exposure and housekeeping.
To shape company and channel assumptions, we also reviewed annual reports and investor decks of listed equipment makers, association and standards pages (industrial hygiene and safety bodies), and credible business press coverage on manufacturing expansion and regulatory changes. Where helpful, paid subscriptions for company financials and intelligence were paired with patent databases and shipment-level import or export datasets to cross-check product positioning, technology shifts, and trade-linked demand signals. These desk sources are illustrative only, and we used other public references as well to support collection, validation, and clarifying open questions.
Primary Interviews and Surveys
Primary work was used to validate how industrial users specify vacuum capacity and filtration, what purchase cycles look like, and how pricing changes with duty class and safety requirements. We spoke with manufacturers, distributors, service partners, and plant-side stakeholders across the Americas, EMEA, and APAC, so the assumptions could be tested against different industrial mixes and compliance climates.
Distribution of primary research fieldwork respondents
| Company type | Respondent position | Region |
|---|---|---|
| Top tier: 31% | CXOs: 18% | APAC: 43% |
| Mid tier: 49% | Functional/Unit leaders: 26% | EMEA: 33% |
| Smaller Players: 20% | Managers: 56% | Americas: 24% |
Market-Sizing & Forecasting
Sizing begins with a top-down build where industrial activity, facility counts, and trade and production signals are used to reconstruct the likely demand pool for industrial vacuum equipment by region. Once that total is formed, it is corroborated with selective bottom-up approximations, including sampled supplier and distributor revenue splits, channel checks by end-use, and an ASP times volume sanity check across common duty classes.
Inputs that matter in this market include manufacturing output growth, expansion of food, pharma, and metalworking sites, dust control and housekeeping compliance intensity, uptake of explosion-proof or hazardous-duty units in certain plants, and replacement cycles tied to service hours and filtration wear. Pricing logic is kept practical by tracking mix changes between dry versus wet and dry units, electric versus pneumatic power, and higher-spec filtration needs, then adjusted for currency timing and regional price dispersion.
Forecasts are produced using scenario analysis supported by short variable-level projections from primary inputs, especially for manufacturing activity, regulation-driven capex, and replacement behavior. Where gaps exist in bottom-up references, we use conservative ranges and then tighten them after follow-up validation with channel participants and end-user buyers.
Data Validation & Update Cycle
Validation is handled through repeated cross-checks that compare the model outputs against independent signals such as industrial production trends, trade directionality, and observed price bands by duty class. If a region shows an unusual swing, we trace the driver back to the assumption level, and we re-contact experts when the variance cannot be explained through public indicators.
Before sign-off, the dataset and calculations pass through a multi-step analyst review to keep unit conversions, currency treatment, and segment allocations consistent across years. The report is refreshed annually, and interim updates are made when material events occur (for example, regulatory changes or sharp shifts in industrial activity). A fresh final pass is completed right before delivery so clients receive the latest updated view.
Mordor Intelligence's Industrial Vacuum Cleaners Market Estimate Compared With Other Published Estimates
Published market sizes for industrial vacuum cleaners can look far apart, even when the topic sounds identical, because the underlying scope and counting rules are often not aligned. Differences usually come from what product families are included, how industrial versus commercial use is separated, and how pricing and currency timing are handled.
The main gap comes from whether centralized dust collection and adjacent industrial cleaning equipment are bundled into the number. In Mordor Intelligence's approach, we count industrial vacuum cleaner systems sold for vacuum-based material pickup, then keep the total anchored to end-use demand indicators and replacement behavior rather than broad cleaning equipment roll-ups.
Benchmark comparison
| Source | Market Size | Gaps in Research Methodology |
|---|---|---|
| Mordor Intelligence | USD 1.11 B (2026) | |
| Global Consultancy A | USD 4.60 B (2025) | This estimate appears to treat the industrial application as part of a wider vacuum cleaner or cleaning-equipment revenue pool, which can fold in adjacent categories and inflate the industrial-only figure when definitions are not tightly separated. |
| Regional Consultancy B | USD 4.20 B (2025) | The scope leans broader by including hazardous-duty extraction systems and other industrial cleaning configurations, and the base year and forecast framing can differ, which shifts the reported value even before growth assumptions are applied. |
Taken together, the spread is mainly explained by scope expansion into neighboring equipment classes and by differences in year anchors and price treatment. Our approach stays traceable because key inputs such as industrial activity, compliance intensity, duty-class mix, and replacement cycles can be checked and re-checked with practical sources and repeatable steps.


Key Questions Answered in the Report
What is the current size of the industrial vacuum cleaners market and how fast is it growing?
The market is valued at USD 1.11 billion in 2026 and is projected to reach USD 1.45 billion by 2031, registering a 5.55% CAGR.
Which region leads the industrial vacuum cleaners market?
Europe holds the largest 31.70% share owing to strict ATEX regulations and high automation levels.
Which product segment is expanding the fastest?
Explosion-proof ATEX-certified vacuum cleaners show the highest 8.02% CAGR due to NFPA 660 and comparable global safety rules.
How significant is battery technology for future growth?
Battery-electric platforms are forecast to grow at a 9.05% CAGR as lithium-ion energy density and fast-charging capabilities improve, supporting cordless adoption.
What end-user industry offers the strongest growth outlook?
Electronics and semiconductor manufacturing, driven by clean-room expansion, is set to advance at a 9.38% CAGR through 2031.
How fragmented is the competitive landscape?
The market is moderately concentrated: the top five companies hold just over 40% share, implying both consolidation potential and room for specialized entrants.
Page last updated on:






