
Industrial Static Equipment Market Size and Share
Market Overview
| Study Period | 2020 - 2031 |
|---|---|
| Market Size (2026) | USD 187.47 Billion |
| Market Size (2031) | USD 232.3 Billion |
| Growth Rate (2026 - 2031) | 4.38% CAGR |
| Fastest Growing Market | Asia-Pacific |
| Largest Market | Asia-Pacific |
| Market Concentration | Medium |
Major Players
*Disclaimer: Major Players sorted in no particular order Image © Mordor Intelligence. Reuse requires attribution under CC BY 4.0. |
|
Industrial Static Equipment Market Analysis by Mordor Intelligence
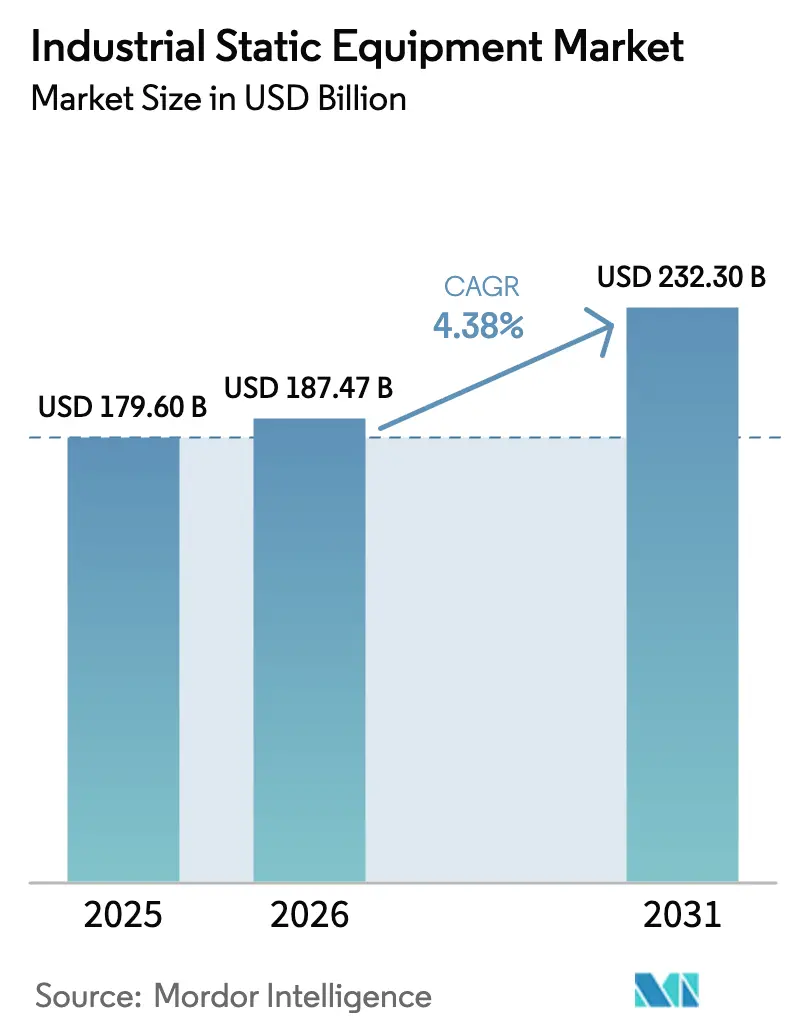
The industrial static equipment market size was valued at USD 179.6 billion in 2025 and estimated to grow from USD 187.47 billion in 2026 to reach USD 232.3 billion by 2031, at a CAGR of 4.38% during the forecast period (2026-2031). Robust replacement cycles, capacity additions in energy and chemicals, and digital-ready product upgrades collectively sustain expansion even when macroeconomic conditions soften. A steady flow of engineering, procurement, and construction (EPC) projects in oil and gas, power generation, and large-scale manufacturing anchors baseline demand, while efficiency retrofits and stricter emission norms push incremental sales of high-performance heat exchangers and smart valves. Asia-Pacific leads both in installed base modernization and greenfield capacity, reinforcing its central role in the industrial static equipment market. Meanwhile, digital twin platforms, condition-based maintenance, and IoT-enabled monitoring differentiate suppliers and open service-revenue streams that bolster margins. Finally, the rise of hydrogen infrastructure and LNG export terminals widens the market’s application footprint, moving static equipment into emerging clean-energy value chains.
Key Report Takeaways
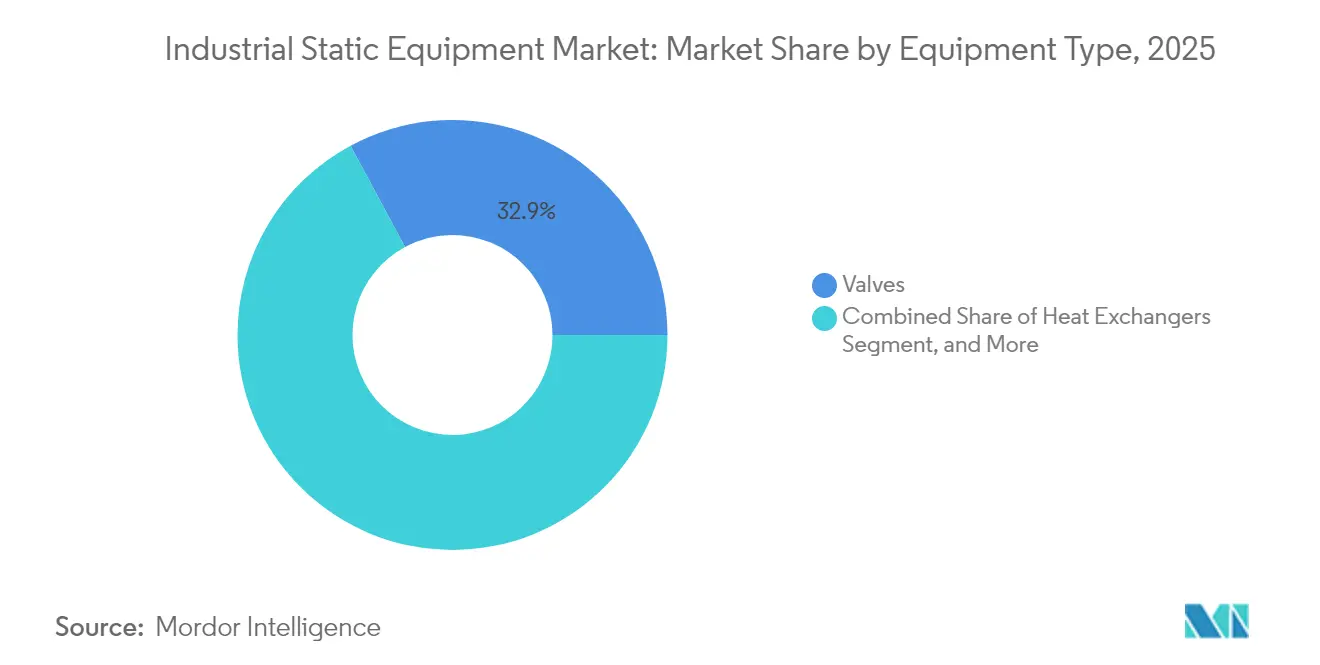
- By equipment type, valves captured 32.86% of the industrial static equipment market share in 2025. Heat exchangers are projected to post the fastest 5.65% CAGR through 2031.
- By material, carbon steel held 37.40% of the industrial static equipment market size in 2025, while alloy steel is advancing at a 5.78% CAGR to 2031.
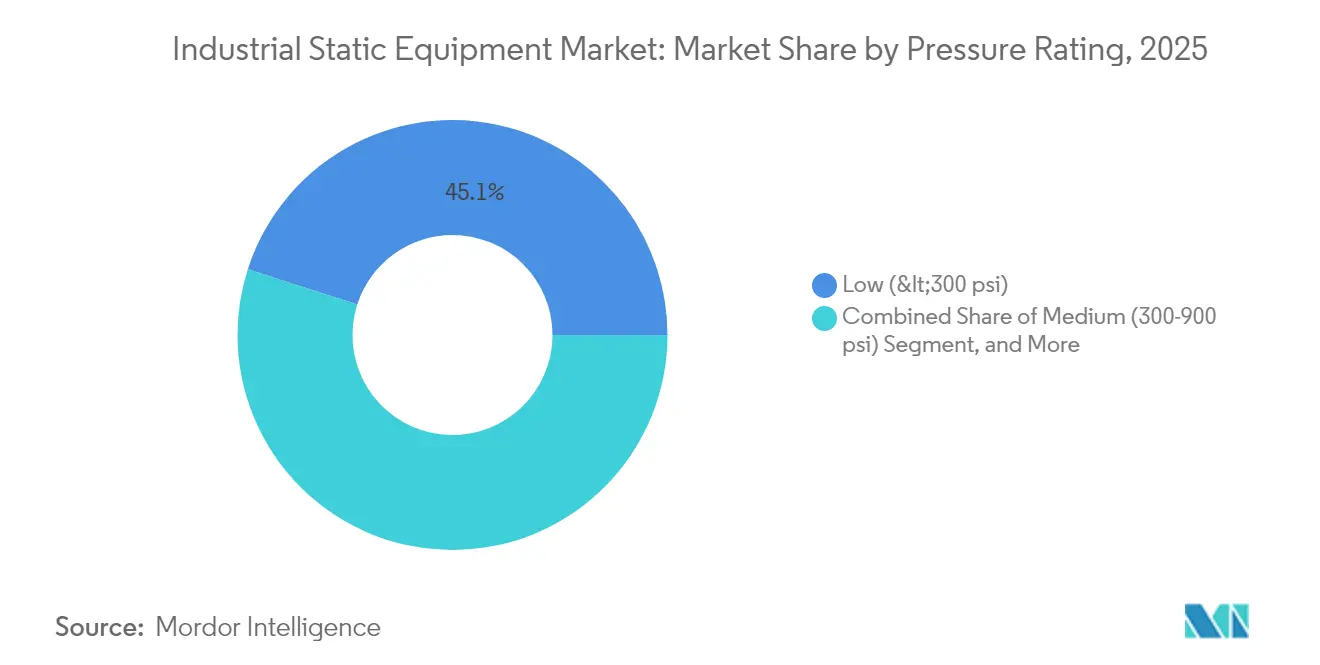
- By pressure rating, low-pressure equipment accounted for 45.05% share of the industrial static equipment market size in 2025, and medium-pressure units are expanding at a 6.01% CAGR through 2031.
- By end-user industry, oil and gas led with 28.55% revenue share in 2025; power generation is forecast to grow at a 4.74% CAGR to 2031.
- By Geography, Asia-Pacific dominated with 42.10% of 2025 revenue and is growing at a 5.45% CAGR to 2031.
Note: Market size and forecast figures in this report are generated using Mordor Intelligence’s proprietary estimation framework, updated with the latest available data and insights as of 2026.
Global Industrial Static Equipment Market Trends and Insights
Drivers Impact Analysis*
| Driver | (~) % Impact on CAGR Forecast | Geographic Relevance | Impact Timeline |
|---|---|---|---|
| Rapid industrialization across emerging economies | +1.2% | Asia-Pacific core, spill-over to MEA | Medium term (2-4 years) |
| Expansion of upstream oil and gas and LNG infrastructure | +0.8% | Global, concentrated in Middle East and North America | Long term (≥ 4 years) |
| Capacity additions in chemicals and petrochemicals | +0.7% | Asia-Pacific and North America, emerging in MEA | Medium term (2-4 years) |
| Stricter emission norms driving heat-transfer retrofits | +0.6% | Global, led by EU and North America | Short term (≤ 2 years) |
| Hydrogen economy retrofits for high-pressure equipment | +0.4% | EU and North America, pilot projects in Asia-Pacific | Long term (≥ 4 years) |
| Digital-twin adoption enabling predictive maintenance | +0.3% | Global, early adoption in developed markets | Medium term (2-4 years) |
| Source: Mordor Intelligence | |||
Rapid Industrialization Across Emerging Economies
Manufacturing output in China climbed 6.2% during 2024 while India’s industrial production grew 5.8% year-over-year, accelerating build-outs of petrochemical complexes, steel plants, and renewable hydrogen hubs that each need valves, pressure vessels, and heat exchangers.[1]National Bureau of Statistics of China, “Industrial Production Statistics Q3 2024,” STATS.GOV.CN Several Gulf nations also committed more than USD 20 billion to hydrogen megaprojects, driving initial demand for high-pressure static assets. These economies frequently require entire greenfield installations rather than incremental replacements, resulting in large multi-equipment orders that lift the industrial static equipment market. Government-backed industrial corridors and foreign direct investment programs ensure capacity additions extend well into the forecast window, maintaining a positive demand trajectory.
Expansion of Upstream Oil and Gas and LNG Infrastructure
Global LNG liquefaction capacity additions totaled 42 million tpa in 2024, supported by projects in Qatar, the United States, and Australia that mandate cryogenic valves and custom heat exchangers.[2]International Gas Union, “Global LNG Capacity Additions Reach Record High,” IGU.ORG Upstream capital expenditure rebounded to USD 525 billion, setting the stage for sustained equipment orders tied to long-lead offshore platforms, gathering systems, and gas-processing plants. Suppliers with proven sour-gas, high-temperature, and subsea qualifications gain preferred-vendor status, reinforcing recurring revenue across multi-decade project lifecycles.
Capacity Additions in Chemicals and Petrochemicals
Investments worth USD 180 billion were announced for new petrochemical projects between 2024 and 2026, heavily weighted toward ethylene, propylene, and specialty intermediates.[3]American Chemistry Council, “Petrochemical Industry Capital Investment Report 2024,” AMERICANCHEMISTRY.COM These facilities demand corrosion-resistant alloy vessels, reactors, and advanced heat-transfer bundles that cost up to 25% more than carbon-steel equivalents yet offer longer service intervals. China anticipates a 15% rise in petrochemical output by 2026, and similar expansions in the U.S. Gulf Coast stimulate orders for ASME-stamped medium-pressure equipment, underpinning revenue growth for technology-focused manufacturers.
Stricter Emission Norms Driving Heat-Transfer Retrofits
The European Industrial Emissions Directive requires 30% efficiency upgrades by 2025, pushing utilities and heavy industry toward compact, high-surface-area heat exchangers. In the United States, proposed EPA rules could reduce NOx by 80% from industrial boilers, with retrofit-ready exchangers promising under-three-year paybacks that spur expedited procurement. Vendors offering modular designs that fit within existing footprints gain share as site operators seek to minimize downtime and capital outlay during compliance-driven turnarounds.
Restraints Impact Analysis*
| Restraint | (~) % Impact on CAGR Forecast | Geographic Relevance | Impact Timeline |
|---|---|---|---|
| High capital cost and shift toward renewable generation | -0.9% | Global, pronounced in developed markets | Medium term (2-4 years) |
| Volatile prices of special-grade steel and alloys | -0.6% | Global, supply chain dependent | Short term (≤ 2 years) |
| Supply-chain disruptions for exotic materials | -0.4% | Global, concentrated impact on specialized applications | Short term (≤ 2 years) |
| Shortage of ASME-certified skilled fabricators | -0.3% | North America and Europe primarily | Long term (≥ 4 years) |
| Source: Mordor Intelligence | |||
High Capital Cost and Shift Toward Renewable Generation
Renewables accounted for 85% of global new-build power capacity in 2024, suppressing boiler and furnace orders tied to fossil assets. Simultaneously, elevated interest rates raise hurdle rates for cap-ex-heavy static equipment packages that routinely eclipse USD 50 million per installation. Investors prefer low-carbon or flexible assets, delaying traditional thermal projects and trimming near-term order books for large-diameter vessels and high-capacity heat-recovery systems.
Volatile Prices of Special-Grade Steel and Alloys
Stainless steel swung between USD 1,800 and USD 2,400 per tonne in 2024, while nickel prices saw 35% peaks and 20% corrections within twelve months. Such volatility complicates fixed-price bids and squeezes supplier margins on long-cycle projects. Producers either hedge and carry higher working capital or renegotiate contract clauses, both of which can slow procurement decisions and inject uncertainty into sales pipelines.
*Our forecasts treat driver/restraint impacts as directional, not additive. The impact forecasts reflect baseline growth, mix effects, and variable interactions.
Segment Analysis
By Equipment Type: Valves Dominate, Heat Exchangers Accelerate
Valves generated the largest portion of the industrial static equipment market size, contributing 32.86% of 2025 revenue as their omnipresence spans isolation, regulation, and safety functions across every process. Their relatively short five-to-seven-year replacement cycles and multiplicity within a single plant drive high unit volumes. The industrial static equipment market share for heat exchangers, though smaller, is rising swiftly; mandated efficiency retrofits lift exchanger sales at a 5.65% CAGR through 2031. Manufacturers are embedding sensors and antifouling coatings to boost uptime and energy recovery.
Furnaces and boilers continue to register dependable orders from waste-to-energy and district-heating projects, even as coal retirements continue. Pressure vessels, while low in volume, command premium prices owing to custom engineering, stringent code compliance, and extended fabrication schedules that stretch up to 18 months. Digital integration is now ubiquitous: smart valves relay stem friction and seating integrity, while exchanger arrays transmit fouling coefficients in real time, enabling predictive maintenance strategies that shrink operating expenditure.


By Material of Construction: Carbon Steel Prevails, Alloy Steel Gains
Carbon steel remained the cost-effective workhorse with 37.40% revenue share in 2025, meeting general service needs in water, HVAC, and moderate-temperature processing lines. Alloy steel, however, is gaining traction as refineries, petrochemical crackers, and combined-cycle plants push temperatures and pressures higher, giving the segment a 5.78% CAGR. Operators increasingly weigh total lifecycle expense, recognizing that superior alloys can cut unscheduled downtime and reduce corrosion-related failures, thereby trimming warranty claims and insurance premiums linked to critical-path outages.
Stainless steel occupies a balanced middle ground, prized in food, beverage, and pharmaceuticals, where product purity is paramount. Non-ferrous and composite materials claim a niche yet expanding foothold; titanium heat exchangers, for example, are preferred in coastal cooling-water service despite prices up to eight times higher than stainless alternatives. Composite shells for atmospheric tanks are also seeing uptake in corrosive chemical storage, underscoring material innovation’s role in broadening supplier portfolios.
By Pressure Rating: Medium-Pressure Band Leads Growth
Low-pressure (< 300 psi) assets comprised 45.05% of 2025 revenue, driven by municipal water, HVAC, and food-grade processors that favor simplicity and low cap-ex. Medium-pressure (300-900 psi) equipment is on track for a 6.01% CAGR, positioning it as the sweet spot for ethanol dehydration, petrochemical side-stream recovery, and combined-cycle balance-of-plant functions. The industrial static equipment market size for high-pressure (> 900 psi) vessels and valves is smaller yet indispensable, serving hydrogen refueling, supercritical power, and deep-well separation duties.
As pressure rises, so do regulatory hurdles: ASME code sections VIII and IX demand extensive radiographic testing, hydro-tests up to 1.5-times design pressure, and certified welding operators, discouraging new entrants and protecting established brands. Digital pressure monitoring, acoustic emission sensors, and data-driven fatigue modeling now form part of bid specifications, a shift that further separates full-solution OEMs from fabricators limited to mechanical supply.
By End-User Industry: Oil and Gas Largest, Power Generation Fastest
Oil and gas accounted for 28.55% of 2025 spending within the industrial static equipment market, reflecting continuous field development, midstream compression, and downstream clean-fuel upgrades. However, power generation takes the growth mantle with a 4.74% CAGR, buoyed by grid-stability investments, flexible peaker plants, and waste-heat-to-power solutions that demand robust heat exchangers and medium-pressure vessels.
Chemical and petrochemical complexes remain steady consumers, layering in capacity debottlenecks, revamps, and environment-driven retrofits. Water and wastewater treatment projects expand rapidly as urbanization and potable water scarcity call for filtration vessels and disinfection contact tanks. Mining, metals, and food processing collectively widen the customer base, diversifying revenue streams and cushioning cyclical slowdowns in any single sector.
Geography Analysis
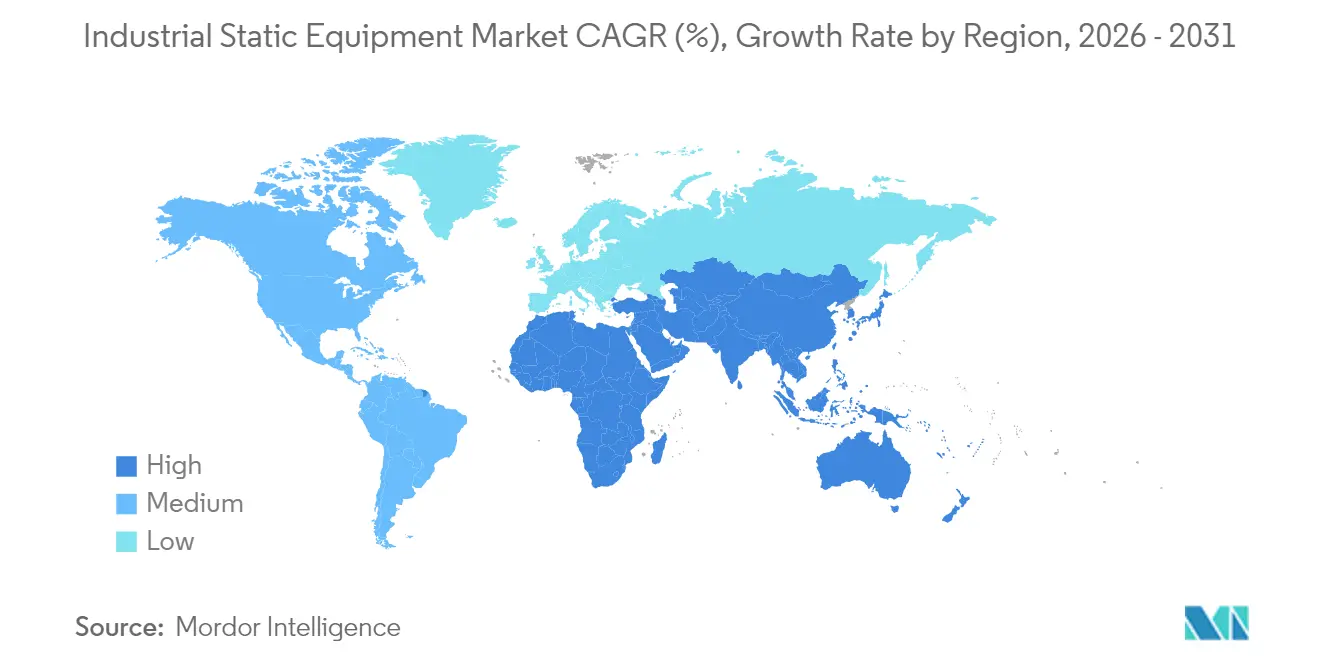
Asia-Pacific retained 42.10% of global revenue in 2025, underpinned by a near-constant pipeline of refinery expansions, coal-to-chemicals plants, and state-backed infrastructure corridors. The industrial static equipment market size across China and India continues its upward trajectory as petrochemical output, steel production, and grid-scale storage facilities come online. Japan and South Korea contribute high-margin orders for precision alloy exchangers and specialty valves that meet stringent quality norms, while Southeast Asian nations absorb mainstream carbon-steel equipment as manufacturing shifts southward.
North America ranks next, anchored by shale gas development and a pronounced push toward petrochemical feedstock integration. The United States leads in LNG export capacity, necessitating cryogenic pressure vessels and triple-offset valves, whereas Canada’s oil-sands operators retrofit high-temperature exchangers to lower emissions intensity. Mexican maquiladora plants, expanding under nearshoring moves, bolster medium-pressure carbon-steel vessel demand. Regional decarbonization rules further stimulate sales of advanced heat-recovery steam generators and low-NOx process heaters.
Europe exhibits mature yet stable orders geared toward efficiency upgrades and end-of-life replacements. Industrial static equipment market share growth is modest as new fossil plants remain scarce; instead, capital flows into hydrogen pilot projects, battery manufacturing facilities, and district heating expansions. German industrial clusters prioritize alloy exchangers for solvent recovery systems, while Scandinavian pulp and paper mills adopt composite digesters to mitigate corrosion. Eastern Europe benefits from EU-supported modernization funds, stimulating demand for code-stamped pressure vessels and stainless-steel sanitary valves in emerging chemical hubs.

Regulatory Landscape
Compliance for industrial static equipment is anchored by safety, performance, and cross-border trade controls, with codes and standards shaping specification and documentation requirements. For pressure-containing equipment, the ASME Boiler and Pressure Vessel Code (BPVC) is a core reference globally, while China’s GB 150 pressure vessel standards commonly require parallel documentation and, for some projects, dual-certification when equipment is sourced or operated across jurisdictions.
From a market-access standpoint, early-2026 compliance tightening around export controls and product conformity adds overhead for OEMs shipping valves, pressure vessels, and heat-transfer equipment into regulated or sanctioned destinations. In Europe, the Machinery Regulation (EU) 2023/1230 adds updated obligations for machinery placed on the EU market, and broader sustainability disclosure expectations, such as CSRD-aligned reporting frameworks referenced by large manufacturers like Alfa Laval, are increasingly reflected in supplier qualification and tender requirements.
Value Chain Analysis
The value chain runs from raw-material and component inputs (carbon steel, stainless and alloy steels, castings and forgings, seals, actuators, and instrumentation) through design engineering, code fabrication, testing, and downstream installation and lifecycle services. EPC firms and end users increasingly use certification-first procurement, validating conformity evidence and code documentation before RFQs progress, particularly for medium- and high-pressure equipment and for packages tied to regulated end markets such as oil and gas and power.
Manufacturing and supply operations are shaped by qualification depth, including ASME-stamped shops, certified welding, and NDE capacity, and by multi-standard execution. Dual-certification needs, such as ASME plus GB 150 documentation for pressure vessels, add engineering effort and can extend lead times, encouraging OEMs to dual-source castings and special materials across geographies and to regionalize assembly footprints to reduce trade friction. Aftermarket services, including spares, shutdown support, diagnostics, and digital monitoring, also form a margin layer as installed bases expand and operators prioritize uptime and compliance during turnarounds.
Competitive Landscape
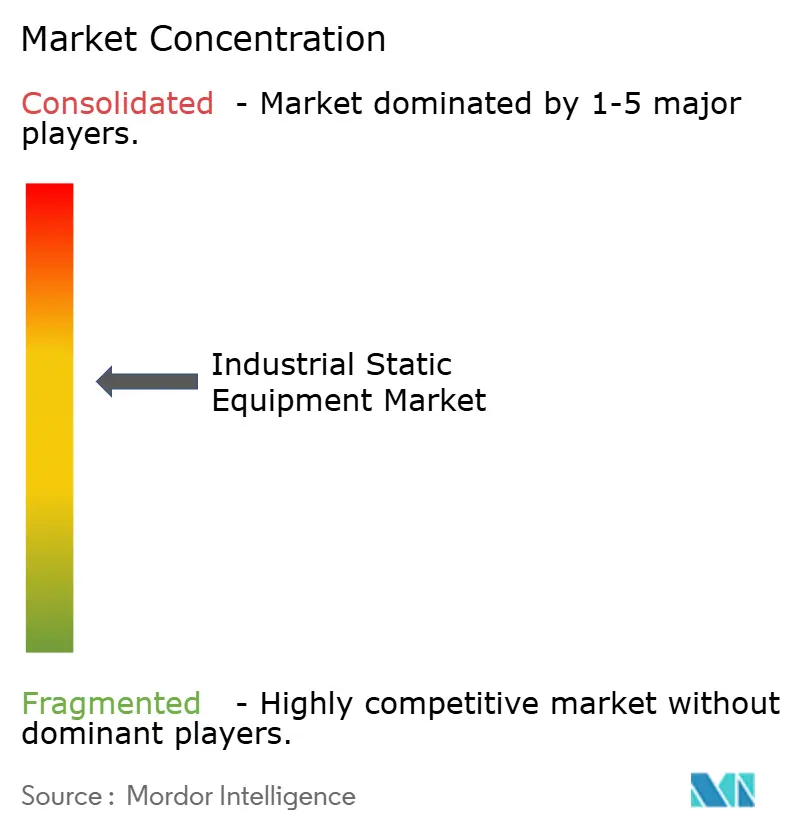
The industrial static equipment market features a moderately fragmented structure where the five largest vendors control roughly 35% of revenue, yet niche players thrive in regional and application-specific pockets. Multinationals such as Flowserve, Emerson Electric, and Alfa Laval leverage global manufacturing footprints and integrated service networks to offer bundled solutions spanning valves, exchangers, and condition-monitoring software. Their scale enables volume procurement of specialty alloys, partially shielding them from raw-material swings.
Digital capability is the new battleground. Emerson’s AI-driven valve diagnostics patent grants real-time prognostics that cut unplanned downtime by 40%. Alfa Laval’s acquisition of a German high-temperature exchanger specialist strengthens its hold in energy-intensive segments, while Flowserve’s USD 150 million Indian plant positions it near rapidly expanding Asia-Pacific demand centers. Mid-tier and regional firms differentiate via quick-turn fabrication, localized after-sales support, or mastery of exotic-material welding, especially in hydrogen and offshore markets.
Price competition prevails in valves and low-pressure vessels due to lower technical entry barriers, yet premium niches subsea valves, ultra-high-pressure hydrogen tanks, and compact printed-circuit exchangers, reward design innovation and certifications that create durable competitive moats. Service revenue is rising faster than hardware sales as operators outsource predictive analytics and turnaround planning, solidifying long-term customer relationships and smoothing revenue volatility.
Industrial Static Equipment Industry Leaders
-
Flowserve Corporation
-
Emerson Electric Co.
-
Alfa Laval A B
-
Danfoss A/S
-
Mitsubishi Heavy Industries, Ltd.
- *Disclaimer: Major Players sorted in no particular order

Market Opportunities and Future Outlook
A primary whitespace area is the retrofit and upgrade cycle driven by emissions and energy-efficiency compliance. That pattern lifts demand for higher-performance heat exchangers and digitally enabled valve packages that support condition-based maintenance. In the report context, the European Industrial Emissions Directive efficiency-upgrade requirements create a compliance-led purchasing motion, while supplier moves such as Emerson’s 2026 industrial AI and IIoT platform releases point to a widening market for software-attached services around static assets, including monitoring, diagnostics, and maintenance optimization.
Capacity localization and industrial policy incentives also create room for manufacturers that can add certified fabrication, testing, and documentation capacity close to growth end markets. The evidence includes Alfa Laval’s plan to invest USD 180 million in a new heat-exchanger plant in Vietnam (announced September 2025), and India’s Industrial Policy 2026 (Haryana) incentives for new industrial units and R&D facilities, which supports build-outs of domestic supply chains for code-compliant valves, exchangers, and vessels. At the portfolio level, M&A focused on mission-critical flow control, including Flowserve’s 2026 acquisition of Trillium Flow Technologies Valves Division, reflects continued demand for qualified valve lineups in power and nuclear, with certifications, metallurgy capability, and installed-base service reach valued in procurement.
Recent Industry Developments
- July 2026: Danfoss A/S signed a definitive agreement to acquire Alfagomma to strengthen its Fluid Conveyance division. The acquisition expands the hose and fittings portfolio, enhancing exposure to high-demand fluid systems and energy segments.
- June 2026: Flowserve Corporation completed the acquisition of Trillium Flow Technologies’ Valves Division for $490 million. The integration enhances Flowserve's leadership in mission-critical valve solutions and nuclear and power end-markets.
- May 2026: Emerson Electric Co. launched the AspenTech AVA AI platform for enterprise-scale industrial AI. The platform strengthens Emerson’s AI-enabled operations and predictive analytics offering.


Research Methodology Framework and Report Scope
Market Definition and Coverage
For this study, the industrial static equipment market covers non-rotating equipment used to control, transfer, heat, cool, store, or contain fluids and gases in industrial plants. We measure this as revenue generated from equipment sales and standard associated components across major end-use industries.
Scope exclusions: We exclude rotating machinery (such as pumps, compressors, and turbines), civil construction works, and plant-wide automation software unless it is bundled directly with the static equipment sale.
Segmentation Overview
-
By Equipment Type
-
Valves
- Gate, Globe and Check
- Ball Valves
- Butterfly Valves
- Plug Valves
- Pressure-relief Valves
- Furnaces / Boilers
- Heat Exchangers
- Pressure Vessels
-
Valves
-
By Material of Construction
- Carbon Steel
- Stainless Steel
- Alloy Steel
- Non-ferrous and Composites
-
By Pressure Rating
- Low (< 300 psi)
- Medium (300–900 psi)
- High (> 900 psi)
-
By End-user Industry
- Oil and Gas
- Power Generation
- Chemicals and Petrochemicals
- Water and Wastewater
- Mining and Metals
- Food and Beverages
- Other End-user Industry
-
By Geography
-
North America
- United States
- Canada
- Mexico
-
Europe
- Germany
- United Kingdom
- France
- Russia
- Rest of Europe
-
Asia-Pacific
- China
- Japan
- India
- South Korea
- Australia
- Rest of Asia-Pacific
-
Middle East and Africa
-
Middle East
- Saudi Arabia
- United Arab Emirates
- Rest of Middle East
-
Africa
- South Africa
- Egypt
- Rest of Africa
-
Middle East
-
South America
- Brazil
- Argentina
- Rest of South America
-
North America
Data Sources, Market Sizing, and Validation
Desk Research
Desk research starts by pinning down what counts as static equipment in real project scopes and how demand shows up in public records. We review engineering codes and safety references, including ASME sections for pressure equipment and piping, and we combine these with government and multilateral data on industrial output and capital formation, such as World Bank indicators and national statistics agencies.
To make the demand side more traceable, we also track energy and process industry signals from sources such as the International Energy Agency, the US Energy Information Administration, the US Census Bureau, and UN Comtrade trade statistics for relevant product groupings. Company annual reports, investor presentations, and reputable industry news are then used to cross-check capacity additions, turnaround cycles, and procurement timing. Where needed, we reference paid subscriptions for company financials and intelligence, patent databases, and import-export shipment level data to reduce gaps around installed base and cross-border supply movements. The sources named here are illustrative and not exhaustive, and additional public and paid references were consulted for data collection, validation, and clarification.
Primary Interviews and Surveys
Primary work is used to pressure-test what desk data cannot show cleanly, especially how replacement demand behaves versus greenfield projects and how pricing moves across materials and pressure ratings. We speak with OEM-side leaders, EPC and maintenance stakeholders, distributors, and plant engineering teams across APAC, EMEA, and the Americas, so our assumptions on utilization, lead times, and typical order mixes can be adjusted before finalizing the model.
Distribution of primary research fieldwork respondents
| Company type | Respondent position | Region |
|---|---|---|
| Top tier: 26% | CXOs: 12% | APAC: 46% |
| Mid tier: 59% | Functional/Unit leaders: 33% | EMEA: 34% |
| Smaller Players: 15% | Managers: 55% | Americas: 20% |
Market-Sizing & Forecasting
Sizing starts with a top-down rebuild of the spend pool by linking plant investment activity and operating intensity to the core static equipment set used in process and power facilities. The demand pool is then distributed using practical allocation keys, such as the share of projects in refining and petrochemicals, power generation additions, and industrial maintenance intensity, where replacement cycles show up.
To keep totals realistic, selective bottom-up approximations are run in parallel, such as sampled price x volume checks for heat exchangers, boilers, valves, and pressure vessels, followed by channel conversations on order sizes and typical lead-time driven pricing moves. Inputs that matter most include capex announcements in energy and chemicals, turnaround schedules and maintenance budgets, pressure rating mix changes, metal input cost direction (which affects quoted prices), and regional trade flows for equipment categories that are commonly imported. When gaps appear, assumptions are tightened using ranges provided by interviewees, and then the category totals are adjusted rather than forcing a full supplier roll-up.
Forecasts rely on scenario analysis anchored to the expected project pipeline and refurbishment activity. Scenario weights are aligned to what experts expect for utilization, permitting pace, and pricing pass-through over the forecast window.
Data Validation & Update Cycle
Outputs are checked against independent signals, including industrial production trend lines, energy and chemicals project counts, and trade movement direction, and then variances are investigated before the numbers are frozen. If a large deviation is seen in one region or equipment group, the assumption chain is reopened, the desk source is rechecked, and primary contacts are revisited to confirm what changed.
A multi-step internal review is followed so the model logic, inputs, and math stay consistent across chapters. The report is refreshed annually, and interim updates are made when material events shift capex plans, pricing, or shipment patterns. Before delivery, analysts run a final update pass so clients receive a current view aligned to the latest data releases.
Mordor Intelligence's Industrial Static Equipment Market Size Measured Against Other Published Estimates
Published market sizes for industrial static equipment can look far apart because studies draw the counted equipment set differently and they also treat pricing and replacement demand in their own ways. The biggest differences usually come from which static equipment families are included, how much installed-base maintenance is counted, and whether the current year is updated for late project slippages.
By tracking EPC award flow, industrial turnaround intensity, and quoted metal-linked price movement, and then refreshing these inputs through call-backs, Mordor Intelligence keeps the model tied to valves, boilers, heat exchangers, and pressure-containing equipment actually purchased for operating plants.
Benchmark comparison
| Source | Market Size | Gaps in Research Methodology |
|---|---|---|
| Mordor Intelligence | USD 179.60 B (2025) | |
| Trade Journal B | USD 138.10 B (2024) | Uses a different label (static plant equipment) and appears to anchor on earlier-year pricing and project intake, which can understate replacement-heavy orders when maintenance cycles accelerate. |
| Global Consultancy A | USD 63.70 B (2025) | Likely applies a narrower included equipment list and may exclude several high-value categories or pressure/material combinations, which compresses the total even if end-use industries overlap. |
The spread across sources mainly points to scope and timing choices rather than simple math differences. When the same demand signals are used consistently and checked against procurement realities, the market value becomes easier to trace and repeat for planning.


Key Questions Answered in the Report
What is the projected value of the industrial static equipment market in 2031?
The industrial static equipment market is forecast to reach USD 232.3 billion by 2031.
Which equipment category currently has the largest revenue share?
Valves lead with 32.86% of 2025 revenue.
Which region is growing fastest through 2031?
Asia-Pacific is set to expand at a 5.45% CAGR, the highest among all regions.
How will stricter emission norms influence equipment demand?
They are accelerating heat-exchanger retrofits that improve energy efficiency and cut NOx, lifting exchanger sales at a 5.65% CAGR.
What impact do alloy steel prices have on manufacturers?
Volatile alloy costs compress margins and complicate fixed-price contracts, slowing purchase decisions in high-spec applications.
Which end-user segment shows the strongest growth outlook?
Power generation is projected to grow at a 4.74% CAGR as grids modernize and integrate renewables.
Page last updated on:






