
Industrial Salts Market Size and Share
Market Overview
| Study Period | 2020 - 2031 |
|---|---|
| Market Volume (2026) | 243.73 Million tons |
| Market Volume (2031) | 271.33 Million tons |
| Growth Rate (2026 - 2031) | 2.17 % |
| Fastest Growing Market | Asia Pacific |
| Largest Market | Asia Pacific |
| Market Concentration | Low |
Major Players *Disclaimer: Major Players sorted in no particular order Image © Mordor Intelligence. Reuse requires attribution under CC BY 4.0. | |
Industrial Salts Market Analysis by Mordor Intelligence
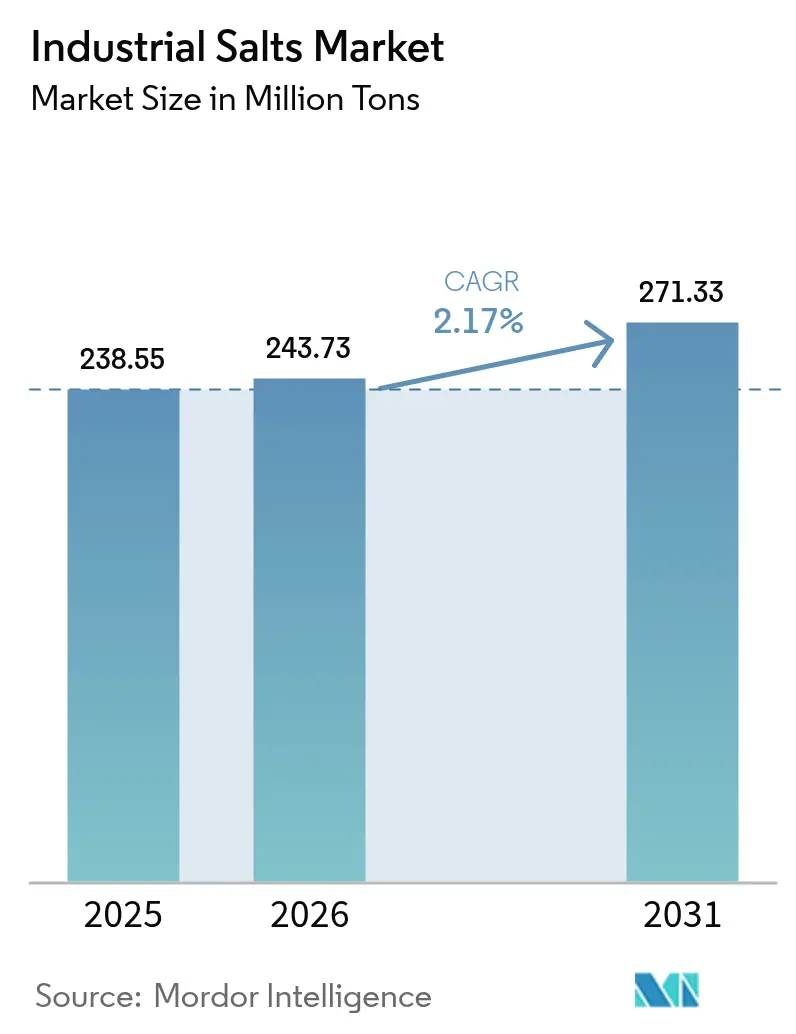
Industrial salts market size in 2026 is estimated at 243.73 Million tons, growing from 2025 value of 238.55 Million tons with 2031 projections showing 271.33 Million tons, growing at 2.17% CAGR over 2026-2031. This measured trajectory reflects a maturing demand base, yet structural growth persists as membrane-grade chlor-alkali capacity accelerates in Asia and the Middle East, municipal water utilities upgrade to ion-exchange and reverse-osmosis systems, and ultra-high-purity specifications gain momentum in next-generation batteries and semiconductors. Rock salt, solar evaporation ponds, and chemical processing remain the volume leaders, but tightening discharge rules in the U.S. and EU, plus substitution threats from calcium chloride and organic de-icers, are pushing producers toward energy-efficient vacuum evaporation and specialty grades that command premium pricing.
Key Report Takeaways
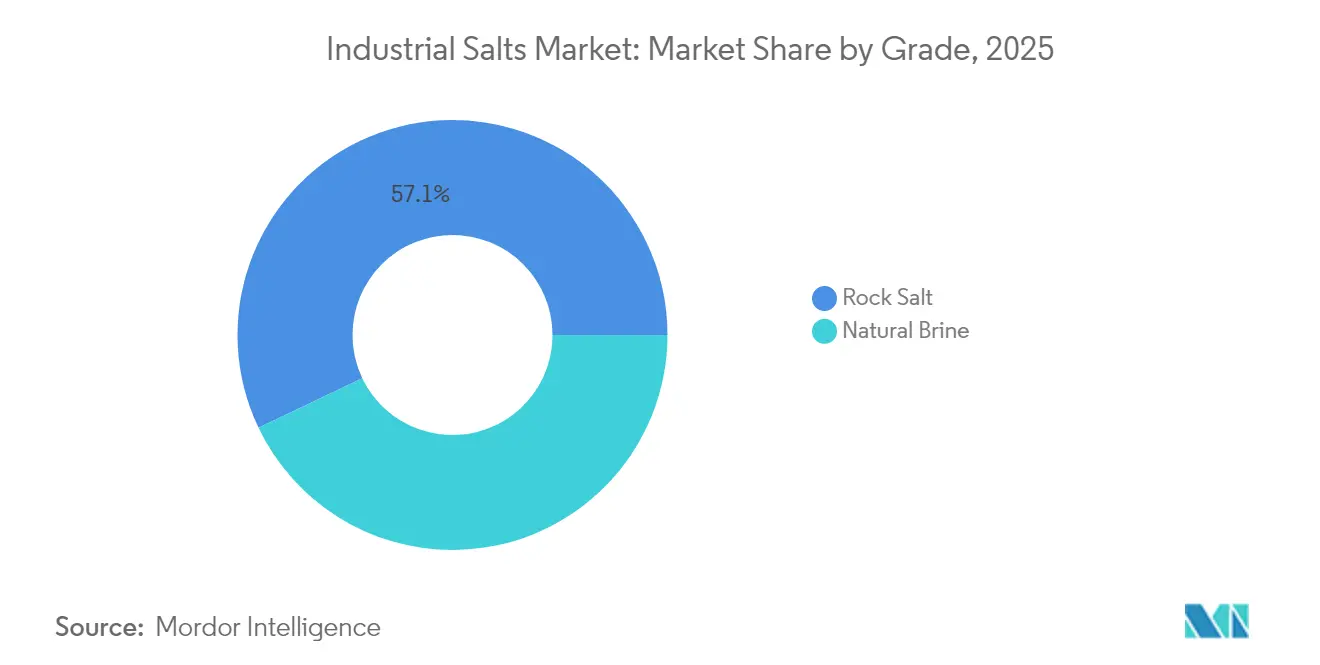
- By source, rock salt led with 57.10% industrial salts market share in 2025; and is projected to grow at a 2.73% CAGR through 2031.
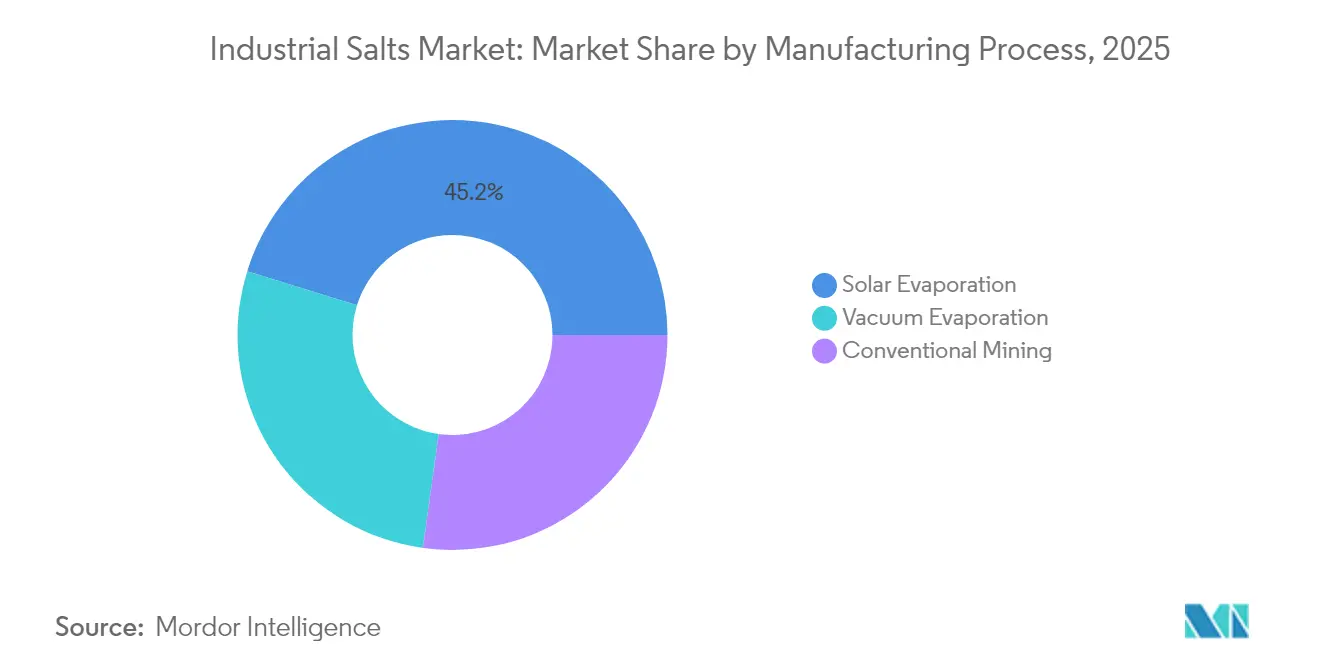
- By manufacturing process, solar evaporation controlled 45.20% revenue in 2025, while vacuum evaporation is forecast to expand at a 2.79% CAGR to 2031.
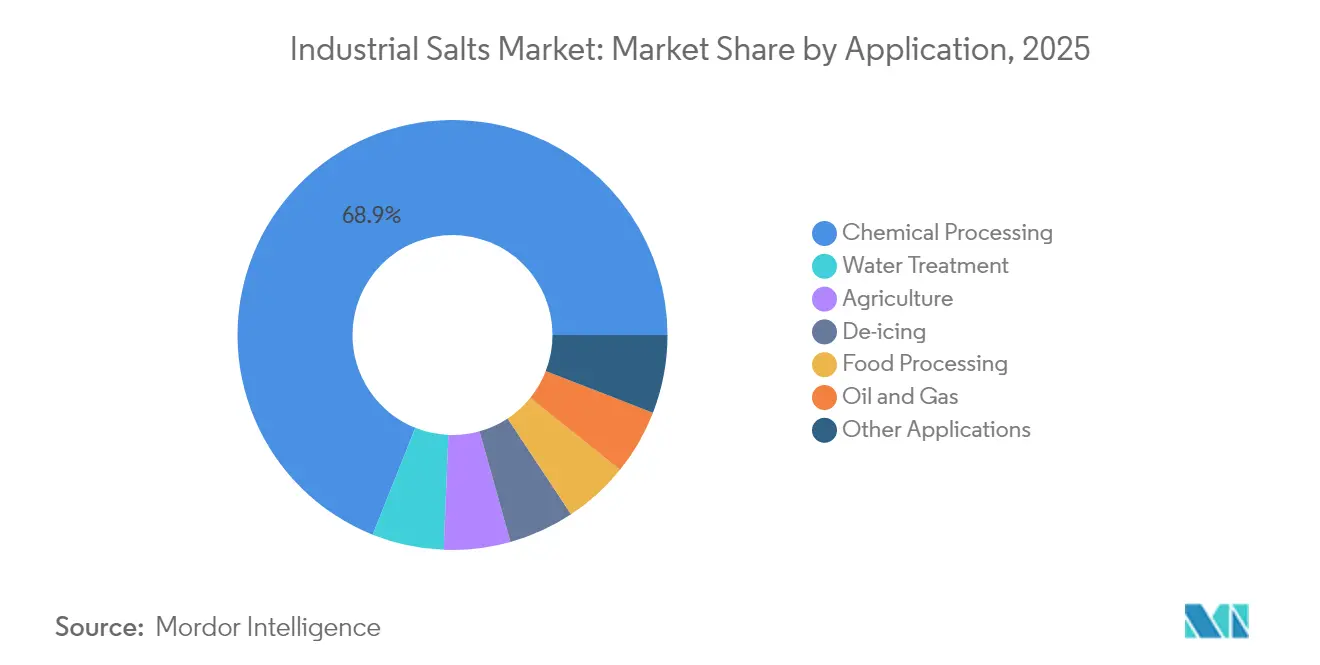
- By application, chemical processing captured 68.95% of the industrial salts market size in 2025; water treatment is advancing at a 2.87% CAGR to 2031.
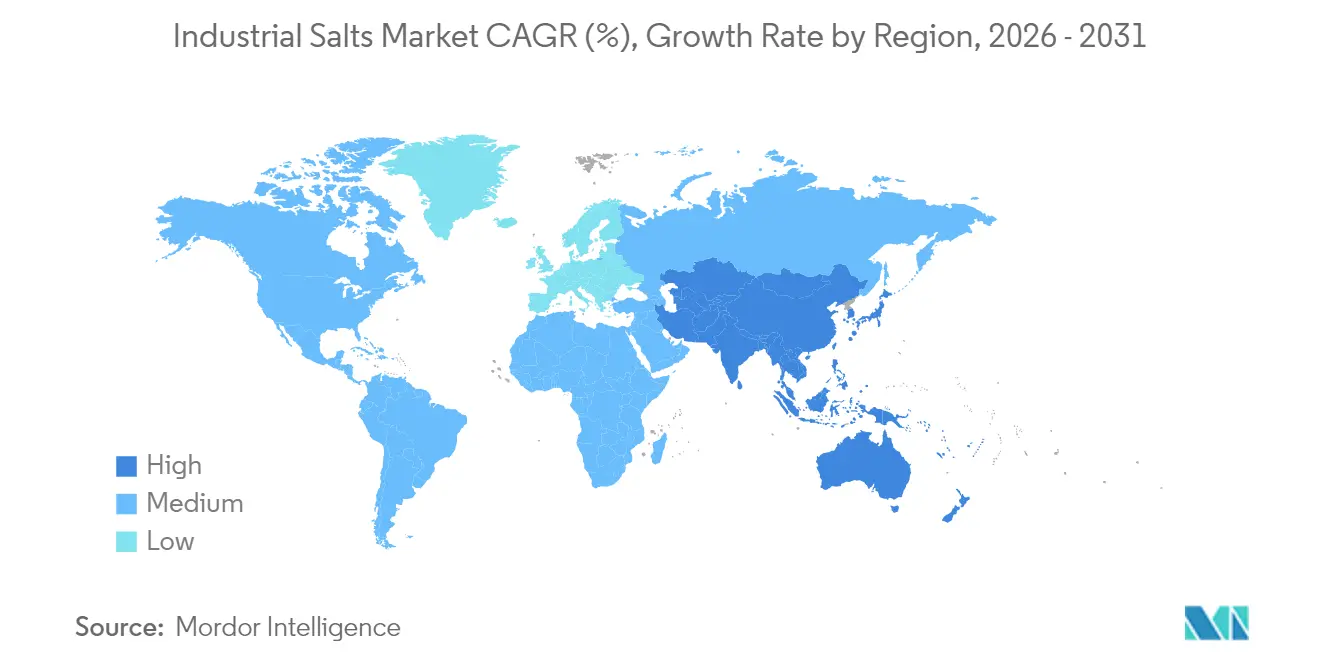
- By geography, Asia-Pacific accounted for 45.50% of global demand in 2025; the region is set to post a 2.82% CAGR through 2031.
Note: Market size and forecast figures in this report are generated using Mordor Intelligence’s proprietary estimation framework, updated with the latest available data and insights as of 2026.
Market Trends and Insights
Drivers Impact Analysis of Industrial Salts Market*
| Driver | (~) % Impact on CAGR Forecast | Geographic Relevance | Impact Timeline |
|---|---|---|---|
| Expanding Chlor-Alkali Capacity in Asia and Middle East | +0.8% | Asia-Pacific core, spill-over to Middle East | Medium term (2-4 years) |
| Rising Adoption in Municipal Water Treatment | +0.6% | Global, with early gains in APAC and MEA | Long term (≥ 4 years) |
| Growing De-Icing Demand Amid Harsher Winters | +0.4% | North America and EU primarily | Short term (≤ 2 years) |
| Ultra-High-Purity Salt for Next-Gen Membranes | +0.3% | Global, concentrated in developed markets | Medium term (2-4 years) |
| Drone-Enabled Yield Gains in Solar-Pond Operations | +0.1% | APAC and MEA solar salt regions | Long term (≥ 4 years) |
| Source: Mordor Intelligence | |||
Expanding Chlor-Alkali Capacity in Asia and Middle East
China’s 2024 membrane-cell additions of 2.1 million tons caustic soda lift salt demand by almost 1.8 million tons a year, and similar projects in India and the Gulf are reinforcing long-run pull for low-calcium, low-magnesium grades. Membrane technology doubles down on purity, cutting impurity thresholds to below 50 ppm and prompting upstream investments in advanced washing, hydrocyclone, and ion-exchange polishing. Saudi-based producers are leveraging low-cost energy to export chlorine derivatives, locking in multi-year salt offtake contracts that stabilize regional pricing.
Rising Adoption in Municipal Water Treatment
Ion-exchange softening and reverse-osmosis upgrades by cities above 100,000 residents now require pharmaceutical-grade regenerant salt with tight particle-size controls to limit membrane fouling[1]. Desalination hubs in the Gulf and Southern Europe are piloting zero-liquid-discharge crystallizers that capture salt by-products for resale. Regulatory targets such as the EU Urban Waste-Water Treatment Directive move utilities toward chloride caps below 250 mg/L, further amplifying demand for high-purity inputs.
Growing De-Icing Demand Amid Harsher Winters
North America and Northern Europe recorded 23% more severe winter events in 2024-2025 than the prior decade, pushing road-salt call-off volumes 15-20% higher and straining municipal reserves. Precision spreaders and real-time weather telemetry trim usage 10-15%, yet calcium chloride and organic acetate blends are winning share in environmentally sensitive corridors despite cost premiums exceeding 200%.
Ultra-High-Purity Salt for Next-Gen Membranes
Membrane suppliers to semiconductor fabs stipulate 99.8% sodium chloride with sub-10 ppm trace metals, achievable only through multi-effect vacuum evaporation coupled with hydro-extraction. Sodium-ion battery developers demand battery-grade feedstock free of sulfate contaminants, opening adjacent revenue streams for integrated salt-chemical producers.
Restraints Impact Analysis of Industrial Salts Market*
| Restraint | (~) % Impact on CAGR Forecast | Geographic Relevance | Impact Timeline |
|---|---|---|---|
| Tighter EU/US Brine-Discharge Regulations | -0.5% | North America and EU primarily | Short term (≤ 2 years) |
| Substitution by CaCl₂ and Organic De-Icers | -0.3% | North America and EU cold regions | Medium term (2-4 years) |
| Opposition to Inland Solution Mining Near Aquifers | -0.2% | Regional, concentrated in water-stressed areas | Long term (≥ 4 years) |
| Source: Mordor Intelligence | |||
Tighter EU/US Brine-Discharge Regulations
U.S. EPA Rule 82 (2024) lifts monitoring and bonding costs by up to USD 5 million per well, while EU directives cap chloride discharges at 250 mg/L in sensitive basins. Mid-size facilities must budget USD 10-20 million for crystallizers or face closure, shifting supply to integrated majors with existing wastewater assets.
Substitution by CaCl₂ and Organic De-Icers
Calcium chloride now holds 15-20% of premium de-icing spend because it operates below -15 °C and reduces road-salt volumes by roughly one-third. Airports increasingly favor potassium acetate for runway clearance, despite unit prices five times higher, due to mandated corrosion metrics. Municipal tenders weigh life-cycle corrosion costs, nudging adoption of brine pretreatment systems that cut overall sodium chloride use by 20-30%.
*Our forecasts treat driver/restraint impacts as directional, not additive. The impact forecasts reflect baseline growth, mix effects, and variable interactions.
Industrial Salts Market Segment Analysis
By Source:
Rock Salt Prevails, Brine Gains Specialty ShareRock salt controlled 57.10% of the industrial salts market in 2025, supported by mature underground mines and established rail and barge logistics. The segment should post a 2.73% CAGR through 2031 as de-icing and general chemical uses sustain baseline demand. Natural brine remains smaller but captures higher-value slots in pharmaceutical and membrane-grade supply chains, especially where solution-mining mitigates land disturbance.
Natural brine’s growth hinges on rising purity needs and environmental pressure against deep-shaft mining. Solution wells paired with pressure-retarded osmosis increase brine concentration efficiencies, while selective extraction curbs aquifer mixing. Producers in China’s Qinghai basin and the U.S. Great Lakes are piloting dual-purpose brine schemes that co-produce lithium concentrates, introducing optionality and raising realized prices per ton.

By Manufacturing Process:
Solar Evaporation Dominant, Vacuum Evaporation FastestSolar evaporation delivered 45.20% of 2025 volume, exploiting high-insolation coastal flats in Australia, China, and Mexico. Ample pond acreage and minimal energy inputs keep operating costs low, but land intensity and weather variability pose constraints. Vacuum evaporation will expand at 2.79% CAGR to 2031 as heat-pump integration and mechanical vapor recompression drive energy use below 25 kWh per ton, enabling premium multi-grade outputs.
Conventional mining retains a foothold where thick halite beds align with rail corridors, yet tailings management, subsidence, and brine disposal rules inflate sustaining capital. Several European mines are trialing backfill cemented paste techniques to cut surface impacts, while North American operators test automated continuous miners to raise productivity.
By Application:
Chemical Processing Strength Meets Water Treatment UpswingChemical processing owned 68.95% of the industrial salts market share in 2025, anchored by chlorine, caustic soda, soda ash, and chloro-vinyl chains. Membrane-cell conversions intensify purity filters, spurring investments in triple-wash centrifuges and inline spectrographic controls.
Water treatment, though smaller, is on track for a 2.87% CAGR to 2031 as utilities in India, Southeast Asia, and the Gulf install reverse-osmosis and nanofiltration trains. Ion-exchange regenerant salt for softening and de-alkalization helmets industrial boiler make-up water, lifting demand for low-sulfate grades. De-icing remains cyclical; however, precision application and anti-icing brines temper growth, while the oil-and-gas segment follows U.S. drilling cycles and Middle Eastern produced-water requirements.
Geography Analysis
APAC Industrial Salts Market
Asia-Pacific accounted for 45.50% of global volume in 2025 and is expected to log a 2.82% CAGR to 2031. China produces over 95 million tons annually, allocating nearly 60% to industrial routes. India’s consumption rises 4-5% each year on pharmaceuticals and municipal water upgrades. Indonesia and Thailand open new solar ponds and brine wells to feed chlor-alkali and aquaculture operations.
North America Industrial Salts Market
North America ranks second, consuming roughly 40 million tons a year in 2025. Road safety agencies absorb 35-40% of U.S. tonnage during winter peaks, while Midwest chemical clusters draw high-purity feedstock from Great Lakes mines. Canadian operators face stricter brine-discharge permits near the Prairie Potash region, and Mexican solar projects expand to capture U.S. Gulf Coast chemical import demand.
EMEA Industrial Salts Market
Europe is mature but regulation-intensive. Germany leads with 12 million tons purchased in 2024, driven by chlor-alkali and pharma grade demand. The U.K. and France keep large de-icing programs, yet organic acetates grow fastest under environmental mandates. Middle East and Africa exhibit the highest relative upside; Saudi Arabia leverages desert solar evaporation for export-oriented chlorine derivatives, while South Africa integrates salt into diversified mining portfolios.
Regulatory Landscape
Regulation for industrial salts increasingly combines product quality standards with tighter controls on brine extraction, effluents, and cross-border trade classification. In the United States and the European Union, stricter brine-discharge rules and chloride limits shape permitting and operating costs for solution-mining and processing sites, which in turn raises the bar for wastewater treatment and crystallizer investments. Industrial buyers in chlor-alkali and advanced water treatment also reinforce demand for compliance-grade purity documentation, pushing procurement toward national standards and audit-ready traceability.
Country-level policies further influence trade flows and market entry. The Philippines enacted Republic Act No. 11985 in March 2024, setting a 9% ad valorem duty on imported salt and creating a special account for salt industry development, which points to reduced import dependence. India tightens specification alignment through Export Inspection Council (EIC) requirements for industrial common salt (minimum 98.5% sodium chloride on a dry basis) and BIS IS 797:2023 for chemical industries (Grade 1 minimum 99.5% sodium chloride), while South Korea’s Salt Industry Promotion Act mandates quality inspection for produced or imported salt under NFQS oversight. In Canada, the 2026 Customs Tariff schedule keeps salt under HS 2501 duty-free, supporting two-way regional trade where logistics and grade certification remain differentiators.
Value Chain Analysis
The industrial salts value chain begins with resource development and extraction from rock salt mining, solar evaporation, and solution mining (natural brine), then moves into beneficiation and processing that increasingly differentiate commodity, water-treatment, and ultra-high-purity grades. Processing typically includes crushing, screening, washing, and purification, with vacuum evaporation and polishing (for low Ca/Mg and trace-metal control) supporting membrane, semiconductor, and battery-adjacent specifications. Packaging and storage vary by application, ranging from bulk handling for chlor-alkali and de-icing to bagged and palletized formats for water treatment and controlled industrial uses.
Logistics and downstream integration are key levers for cost and reliability given salt’s high volume and comparatively low unit value in many end markets. Integrated producers and large distributors connect mines and ponds to industrial clusters such as chlor-alkali, soda ash, and water utilities, using long-term offtake and seasonal inventory planning to manage de-icing volatility. Industry associations and technical bodies also shape the chain by aligning quality guidance and sustainability practices, while government and utility procurement requirements elevate the role of testing, certification, and traceability for regulated applications.
Competitive Landscape
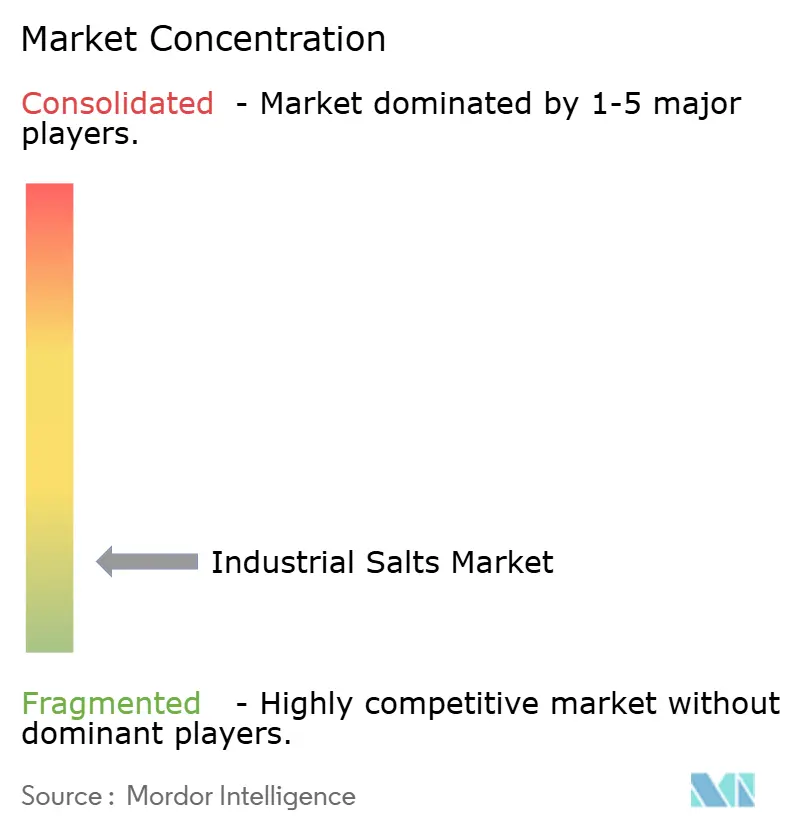
The industrial salts market remains moderately fragmented, though scale and integration offer decisive advantages. Compass Minerals cut 10% of corporate headcount in March 2025, projecting USD 11-13 million annual cash savings and narrowing its focus on salt and plant nutrition[2]. K+S, Rio Tinto’s divested Lake MacLeod asset, and emerging Middle Eastern ventures round out a top tier that collectively holds near-40% of global capacity.
Technology differentiation centers on vacuum evaporation retrofits, real-time impurity scanning, and zero-liquid-discharge crystallizers. Producers able to certify 99.8% purity capture semiconductor and battery channels at margins 2-3 times commodity rock-salt. Drone-guided solar-pond monitoring is boosting yields by 3-5% in Australia and Oman, while U.S. operators deploy automated continuous miners to trim labor intensity.
Regulation acts as both barrier and moat. EPA Rule 82 and EU chloride caps elevate compliance costs but favor firms with sunk wastewater and tailings infrastructure. Constrained junior miners pivot to service brine-to-lithium tolling, whereas majors hedge by partnering with battery-grade sodium manufacturers. The market’s shift from volume to value underscores innovation, sustainability, and contiguous chemical integration.
Industrial Salts Industry Leaders
-
Cargill, Incorporated
-
K+S Aktiengesellschaft
-
Compass Minerals
-
Rio Tinto
-
China National Salt Industry Corporation
- *Disclaimer: Major Players sorted in no particular order
Industrial Salts Market Companies Covered in this Report
- ACIL
- Cargill, Incorporated
- China National Salt Industry Corporation
- Compass Minerals
- Delmon Co., Ltd.
- Dev Salt Pvt Ltd
- Dominion Salt
- Donald Brown Group
- K+S Aktiengesellschaft
- MITSUI & CO., LTD.
- Morton Salt, Inc.
- Rio Tinto
- Salins IAA
- Tata Chemicals
- Wacker Chemie AG
Market Opportunities and Future Outlook
Upgrading toward energy-efficient, high-purity production is the clearest whitespace, as chlor-alkali membrane processes, municipal water treatment, and advanced materials channels tighten impurity thresholds. Nobian’s start-up of a fully electrified mechanical vapor recompression (MVR) salt production facility in Mariager, Denmark, in January 2026, designed to lift site capacity by about 60% toward a potential one million tons per year, provides a concrete reference point for electrification and premium-grade capability. This also strengthens the case for multi-effect vacuum evaporation and inline impurity monitoring as producers pursue low-calcium, low-magnesium, and trace-metal-controlled grades at scale.
Regional supply chain optimization and import substitution programs are also creating investment lanes, particularly when fast-growing industrial and municipal demand sits far from traditional supply. Tata Chemicals announced in February 2026 an investment of INR 515 crore to build a 210 KTPA greenfield iodised vacuum salt dried (IVSD) facility at Valinokkam, Tamil Nadu, and in May 2026 approved INR 100 crore to debottleneck salt capacity by 82,500 TPA at Mithapur, indicating ongoing capacity additions and logistics-led siting in India. At the same time, tightening effluent and brine-disposal requirements in key markets keep increasing the value of integrated wastewater assets, creating opportunities for operators that pair production with zero-liquid-discharge systems and certified quality programs for industrial and water-treatment buyers.
Recent Industry Developments in Industrial Salts Market
- June 2026: K+S Aktiengesellschaft announced the acquisition of Qemeticas salt business for EUR 350 million plus a performance-linked bonus of up to EUR 30 million. The deal brings evaporated-salt production sites in Stassfurt (Germany) and Janikowo (Poland) into K+S, expanding its footprint in higher-value salt grades and strengthening regional supply optionality for industrial and water-treatment customers.
- May 2026: Compass Minerals reported fiscal 2026 second-quarter results and confirmed that unionized employees at its Goderich mine ratified a new three-year collective bargaining agreement. The labor agreement supports operating continuity at one of North America's key rock salt assets, reinforcing supply reliability for industrial and de-icing buyers during peak seasons.
- September 2024: QatarEnergy, through its TAWTEEN localization program, formed a joint venture with Mesaieed Petrochemical Holding Company (MPHC), Qatar Industrial Manufacturing Co. (QIMC), and Turkeys Atlas Yatirim to create Qatar Salt Products Company (QSalt) in Um Al Houl. The project targets 1 million tons per year of industrial and food-grade salt using reject water from reverse osmosis desalination units, linking desalination by-products to domestic salt supply and reducing reliance on imports.
Industrial Salts Market Report Scope and Research Methodology
Market Definition and Coverage
For this study, the industrial salts market is defined as salt volumes supplied for industrial and municipal uses, including chemical processing, water treatment, de-icing, and oil and gas operations. The market is measured in tons and tracks supply from mining and brine-based production routes across major regions.
Scope exclusions: The sizing excludes table salt and most packaged retail food salt demand when it is sold mainly for household consumption.
Segments Covered in This Report
- By Source
- Rock Salt
- Natural Brine
- By Manufacturing Process
- Solar Evaporation
- Vacuum Evaporation
- Conventional Mining
- By Application
- Chemical Processing
- Water Treatment
- De-icing
- Oil and Gas
- Agriculture
- Food Processing
- Other Applications
- By Geography
- Asia-Pacific
- China
- India
- Japan
- South Korea
- ASEAN Countries
- Rest of Asia-Pacific
- North America
- United States
- Canada
- Mexico
- Europe
- Germany
- United Kingdom
- France
- Italy
- Russia
- NORDIC Countries
- Rest of Europe
- South America
- Brazil
- Argentina
- Rest of South America
- Middle East and Africa
- Saudi Arabia
- South Africa
- Rest of Middle East and Africa
- Asia-Pacific
Data Sources, Market Sizing, and Validation
Desk Research
Desk work started with anchoring salt production and trade signals that are visible in public datasets. We referenced sources such as the United States Geological Survey for salt production and price notes, the United Nations Comtrade database for cross-border salt trade flows, and government customs and statistical agencies in large producing countries for tonnage and industrial output context.
To keep the demand side grounded, we also reviewed water and wastewater program statistics from agencies such as the US Environmental Protection Agency, transport and winter maintenance publications where de-icing demand is discussed, and technical papers and peer reviewed journals that document salt use rates in chemical and water applications. Company annual reports, investor presentations, and credible press releases were used to sanity check capacity expansions and operating rate commentary, and a paid subscription for company financials plus an import/export shipment-level database was used selectively to validate producer footprints and trade intensity. These examples are not exhaustive, and many other public sources were also consulted to collect, validate, and clarify data points.
Primary Interviews and Surveys
Primary work focused on interviews and short surveys with producers, distributors, and large industrial buyers, followed by checks with domain experts who track chlor-alkali, municipal water treatment, and winter road maintenance procurement. For a global market like this, outreach was spread across APAC, EMEA, and the Americas, so assumptions on operating rates, application mix, and seasonality could be confirmed and adjusted where needed.
Distribution of primary research fieldwork respondents
| Company type | Respondent position | Region |
|---|---|---|
| Top tier: 28% | CXOs: 19% | APAC: 47% |
| Mid tier: 51% | Functional/Unit leaders: 21% | EMEA: 34% |
| Smaller Players: 21% | Managers: 60% | Americas: 19% |
Market-Sizing & Forecasting
Sizing was built using top-down logic that reconstructs the addressable tonnage pool from production, trade, and end-use intake signals, and then allocates that pool across applications that consistently pull industrial salt volumes. After the first cut was produced, we corroborated it through selective bottom-up approximations such as sampled producer capacity by process route, channel checks on delivered volumes, and practical volume-per-application benchmarks. Totals were adjusted only when multiple signals lined up.
Key model inputs included salt production by source (rock salt and brine), output by manufacturing route (conventional mining, solar evaporation, vacuum evaporation), trade intensity by region, winter severity and de-icing season length, municipal water treatment throughput indicators, and chemical production activity tied to chlor-alkali and related processes. Where data gaps appeared for smaller markets, proxy ratios based on similar climate, industrial mix, and import reliance were used, then expert validation was applied to keep implied consumption aligned with reality.
Forecasts were developed using scenario analysis supported by short trend models on the main drivers, since demand can swing with weather and industrial cycles. Growth assumptions were then reviewed with primary respondents so the forward view stayed consistent with capacity additions, operating rate expectations, and the expected mix shift across chemical processing, water treatment, and de-icing.
Data Validation & Update Cycle
Validation is done by checking the model output against independent indicators such as production totals, trade balances, and region-level consumption signals, and then reviewing any sharp jumps that do not match known events. When variances appear, we revisit the underlying drivers, re-check conversion factors, and re-contact interviewees if the gap looks material.
Before sign-off, the work goes through multi-step internal reviews so assumptions, math, and narrative remain aligned. The report is refreshed annually, and interim updates are completed when material events occur, such as major capacity changes, supply disruptions, or policy shifts that change de-icing and water treatment usage. Right before delivery, the latest public updates are scanned again so clients receive a current view.
Mordor Intelligence's Industrial Salts Market Size Compared Against Other Published Estimates
It is normal to see different market sizes for industrial salts because publishers do not always count the same things, and the data is not always expressed in the same unit. Differences usually come from whether the estimate is done in revenue or tons, how de-icing seasonality is handled, and how imports and exports are treated when converting supply into local consumption.
Some published figures are presented mainly as a revenue market and may also fold in broader salt categories that sit close to industrial use cases. For Mordor Intelligence, the estimate stays in volume terms and counts only industrial salt demand tied to industrial applications (such as chemical processing, water treatment, de-icing, and oil and gas) as defined in the report scope, which reduces category drift even when pricing moves sharply.
Benchmark comparison
| Source | Market Size | Gaps in Research Methodology |
|---|---|---|
| Mordor Intelligence | USD 243.73 M (2026) | |
| Global Consultancy A | USD 14.00 B (2020) | Reported as a revenue market, so the total is highly sensitive to regional price assumptions and the mix of high value grades. Base year and forecast window differ, and the category may include adjacent non-industrial salt volumes depending on product definitions. |
| Industry Publisher B | USD 16.26 B (2024) | Uses revenue and a different base year, which can widen results when currency timing and average selling price progression are not aligned across regions. Application boundaries and import reliance assumptions are not always transparent, so the implied consumption can drift from physical tonnage signals. |
The spread mainly reflects unit choice and scope clarity, since a ton-based build will not move in the same way as a price-led revenue view. By keeping the model tied to measurable supply, trade, and end-use intake indicators, the final number is easier to trace and repeat when buyers want to test assumptions.
Key Questions Answered in the Report
What is the current global volume for industrial salts?
The industrial salts market size stood at 243.73 million tons in 2026.
How fast is demand expected to grow?
Global volume is projected to reach 271.33 million tons by 2031, showing a 2.17% CAGR.
Which region leads in consumption?
Asia-Pacific commands about 45.50% of worldwide demand, fueled by chlor-alkali expansions.
Which application is expanding fastest?
Water treatment is advancing at a 2.87% CAGR thanks to membrane-based upgrades in municipalities.