
Industrial Mixers Market Size and Share
Market Overview
| Study Period | 2020 - 2031 |
|---|---|
| Market Size (2026) | USD 3.1 Billion |
| Market Size (2031) | USD 4.48 Billion |
| Growth Rate (2026 - 2031) | 7.64% CAGR |
| Fastest Growing Market | Asia-Pacific |
| Largest Market | Asia-Pacific |
| Market Concentration | Medium |
Major Players
*Disclaimer: Major Players sorted in no particular order Image © Mordor Intelligence. Reuse requires attribution under CC BY 4.0. |
|
Industrial Mixers Market Analysis by Mordor Intelligence
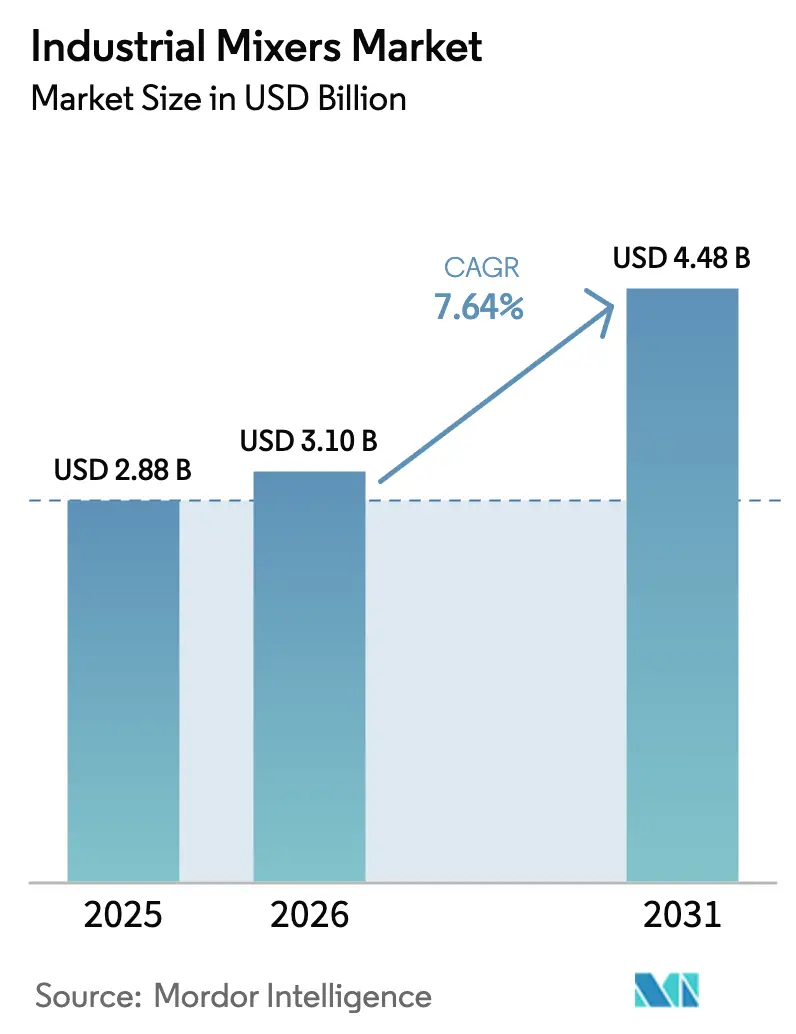
The industrial mixers market size is expected to grow from USD 2.88 billion in 2025 to USD 3.1 billion in 2026 and is forecast to reach USD 4.48 billion by 2031 at 7.64% CAGR over 2026-2031. Strong regulatory oversight in food and pharmaceutical processing, rising demand for energy-efficient high-torque drives, and expanding wastewater treatment infrastructure are key factors driving steady gains for the industrial mixers market. Rapid urbanization in Asia-Pacific, the push for continuous manufacturing in life sciences, and digital retrofits that enable predictive maintenance further widen adoption. Vendors differentiate through hygienic design, intelligent control systems, and modular skid packages that shorten installation time while boosting process reliability.
Key Report Takeaways
- By product type, agitators accounted for a 35.85% market share in the industrial mixers market in 2025, while high-shear mixers are forecast to post an 8.05% CAGR through 2031.
- By end-user industry, the water and wastewater treatment segment accounted for 23.05% of the industrial mixers market size in 2025; the pharmaceuticals segment is poised for the fastest expansion at a 7.74% CAGR through 2031.
- By power rating, 15-50 kW systems accounted for 31.65% of the industrial mixer market size in 2025; however, sub-5 kW units are advancing at an 7.86% CAGR, driven by the trend towards modular processing.
- By geography, the Asia-Pacific region captured 29.55% of the revenue in 2025 and is projected to deliver the highest CAGR of 8.18% through 2031.
Note: Market size and forecast figures in this report are generated using Mordor Intelligence’s proprietary estimation framework, updated with the latest available data and insights as of 2026.
Global Industrial Mixers Market Trends and Insights
Drivers Impact Analysis*
| DRIVER | (~) % IMPACT ON CAGR FORECAST | GEOGRAPHIC RELEVANCE | IMPACT TIMELINE |
|---|---|---|---|
| Stricter sanitary mandates in food and pharma | +1.2% | North America, Europe | Medium term (2-4 years) |
| Energy-efficient high-torque motor adoption | +1.8% | Europe, Asia-Pacific | Long term (≥ 4 years) |
| Surge in wastewater recycling capacity additions | +1.5% | Asia-Pacific, Middle East and Africa | Medium term (2-4 years) |
| Bioreactor retrofits for cultivated-meat pilots | +0.9% | North America, Europe | Long term (≥ 4 years) |
| On-site chemical blending for battery-grade materials | +1.1% | Asia-Pacific, North America | Medium term (2-4 years) |
| Modular “mix-on-demand” skids for remote mining camps | +0.9% | Resource-rich regions | Short term (≤ 2 years) |
| Source: Mordor Intelligence | |||
Stricter Sanitary Mandates in Food and Pharma
Food-grade and pharmaceutical plants now specify electropolished surfaces, crevice-free welds, and validated clean-in-place protocols to satisfy EHEDG 2024 updates and FDA 21 CFR 110.35 requirements.[1]Source: U.S. Food and Drug Administration, “FSMA Final Rule: Preventive Controls for Human Food,” fda.gov Equipment suppliers that deliver certified hygienic designs secure premium pricing while smaller fabricators face rising compliance costs. In pharmaceuticals, continuous production lines rely on documented mixing uniformity, driving the procurement of high-shear and magnetically driven mixers that are validated under good manufacturing practice audits. Retrofits to legacy agitators often fail validation, accelerating outright replacement. This dynamic strengthens competitive barriers and cements long-term service contracts around sanitary assets.
Energy-Efficient High-Torque Motor Adoption
IE5 synchronous reluctance motors, paired with variable-frequency drives, reduce mixer energy draw by up to 20% compared to legacy induction units, while delivering the torque needed for high-viscosity slurries.[2]Source: Siemens, “Revolutionizing Food Production with Powder and Software,” siemens.com Regulations already mandate IE4 minimum efficiency above 0.75 kW, and similar rules under discussion in India and Brazil will accelerate fleet renewal. Plant engineers link drives to edge analytics that reduce speed during low-load phases, extending seal life and lowering power bills across the industrial mixer market. Vendors that bundle motors with digital control panels command higher margins and cultivate data-driven service revenues.
Surge in Wastewater Recycling Capacity Additions
Municipalities and industrial clusters expand submerged aerated filters, membrane bioreactors, and advanced oxidation systems that rely on uniform agitation to maintain biomass activity.[3]Source: U.S. Environmental Protection Agency, “Municipal Wastewater,” epa.gov China’s 14th Five-Year Plan earmarks USD 140 billion for water infrastructure, and India’s Clean Ganga program places similar emphasis on efficient mixing solutions. Energy-optimized submersible mixers equipped with IE5 motors meet stringent discharge limits while trimming operating expenditure. Suppliers offering corrosion-resistant alloys and predictive maintenance packages secure multiyear framework agreements, fueling a buoyant outlook for the industrial mixers market in water applications.
Bioreactor Retrofits for Cultivated-Meat Pilots
Cultivated-meat firms require gentle, low-shear impellers that preserve animal cell viability while assuring oxygen transfer in extended culture runs.[4]Source: Nature Biotechnology, “Scaling up Cultivated Meat Production,” nature.com Pilot plants in the United States and Europe retrofit glass-lined bioreactors with magnetically coupled agitators to eliminate contamination risks. Customized mixing heads command premium prices yet represent a small fraction of total project spend, encouraging rapid adoption. Partnerships between bioprocess consultants and mixer OEMs accelerate technology transfer, creating a niche but high-growth pocket within the broader industrial mixers market.
Restraints Impact Analysis*
| RESTRAINT | (~) % IMPACT ON CAGR FORECAST | GEOGRAPHIC RELEVANCE | IMPACT TIMELINE |
|---|---|---|---|
| Raw-material price volatility (stainless steel, alloys) | -0.8% | Global, Asia-Pacific hubs | Short term (≤ 2 years) |
| High capex vs. alternative inline dosing systems | -0.6% | North America, Europe | Medium term (2-4 years) |
| Rising ATEX / IECEx certification costs for hydrogen hubs | -0.4% | Europe, North America | Long term (≥ 4 years) |
| Skilled operator shortage for large-diameter agitators | -0.5% | Developed markets | Medium term (2-4 years) |
| Source: Mordor Intelligence | |||
Raw-Material Price Volatility (Stainless Steel, Alloys)
Stainless steel prices fluctuated by 15–20% in 2024 as nickel prices traded between USD 16,500 and USD 20,000 per metric ton, eroding margins for mixer fabricators.[5]Source: London Metal Exchange, “LME Nickel,” lme.com Specialty alloys, such as Hastelloy C-276, followed similar spikes tied to aerospace demand, forcing OEMs to renegotiate long-term frame contracts and hedge their purchases. Larger vendors leverage global procurement and inventory pooling to buffer cost shocks, but regional job shops struggle to pass increases through, curbing new capacity additions in the industrial mixers industry. Supply-chain diversification into Indonesia and the United States may stabilize pricing, but it introduces higher baseline costs that will be passed through to equipment prices.
High Capex vs. Alternative Inline Dosing Systems
Static mixers and precision inline dosing skids offer a 30–40% lower total cost of ownership for blending low-viscosity liquids, particularly in continuous process lines. Pharmaceutical and specialty-chemical plants exploring continuous manufacturing tend to gravitate toward compact, static solutions that integrate seamlessly without requiring a dedicated mixing vessel. Batch-oriented sectors such as paint, adhesives, and mineral slurries still favor stirred tanks, limiting wholesale displacement. Nonetheless, the value comparison slows capital approval cycles for traditional agitators in tight-margin industries, muting near-term growth for portions of the industrial mixers market.
*Our forecasts treat driver/restraint impacts as directional, not additive. The impact forecasts reflect baseline growth, mix effects, and variable interactions.
Segment Analysis
By Product Type: Agitators Retain Scale, High-Shear Mixers Accelerate
Agitators commanded a 35.85% share of the industrial mixers market in 2025, underpinned by decades of performance data in bulk chemical, mineral processing, and water treatment operations. Their robust frames and modular impeller libraries allow economical customization across vessel sizes exceeding 100 m³. The industrial mixers market size for agitators is expected to grow steadily as replacement cycles align with increasingly stringent sanitary and energy norms. High-shear mixers, however, are expected to grow at an 8.05% CAGR, driven by demand for emulsification in biotechnology and advanced materials. Inline rotor-stator designs deliver micron-level particle reduction, supporting continuous wet-milling and pre-dispersion tasks that upstream equipment cannot meet. Suppliers integrate real-time torque and temperature sensors that feed digital twins, thereby improving scale-up accuracy and reducing validation time in regulated segments, such as the pharmaceutical industry.
Digital integration reshapes every product line. Agitator vendors embed vibration sensors on gearbox housings and shafts, feeding AI models that forecast bearing life. Submersible mixer makers redesign housings with composite shrouds that cut weight while resisting chloride stress cracking in seawater desalination plants. Static and jet mixers, which are normally energy-neutral, now ship with differential-pressure transmitters that allow operators to verify mixing intensity without intrusive probes. Across categories, IoT frameworks enable pay-per-mix service models, where OEMs bill for uptime rather than equipment alone, thereby expanding recurring revenue streams within the industrial mixers market.


By End-User Industry: Water Treatment Dominates, Pharmaceuticals Surge
Municipal and industrial water treatment facilities accounted for 23.05% of 2025 revenue, leveraging high-efficiency submersible mixers to maintain activated sludge in suspension. Plant upgrades in China, India, and the Middle East sustain robust replacement demand as stringent discharge norms align with WHO effluent guidelines. Meanwhile, the pharmaceutical segment is currently smaller, but advances at a 7.74% CAGR, reflecting the establishment of greenfield biologic facilities in Singapore, Ireland, and the United States that utilize sanitary high-shear and magnetically driven mixers. The industrial mixers market share leaders tailor clean-room-ready skids with automated recipe control, meeting continuous oral-solid-dose protocols under FDA guidance.
Chemical producers continue to invest in corrosion-resistant mixers for the synthesis of lithium-ion precursors and renewable polymer feedstocks, while food and beverage companies upgrade to hygienic agitators that are validated to EHEDG standards. Mining operations require rugged units with hardened shafts and wear-resistant plates for use in tailings ponds at high altitudes. Energy applications, including hydrogen electrolyzer feedwater conditioning and biofuel fermentation, open fresh terrain, albeit from a smaller installed base. Collectively, the diversity of applications cushions sector-specific downturns and sustains momentum for the industrial mixers market.
By Power Rating: Mid-Range Units Prevail, Sub-5 kW Systems Accelerate
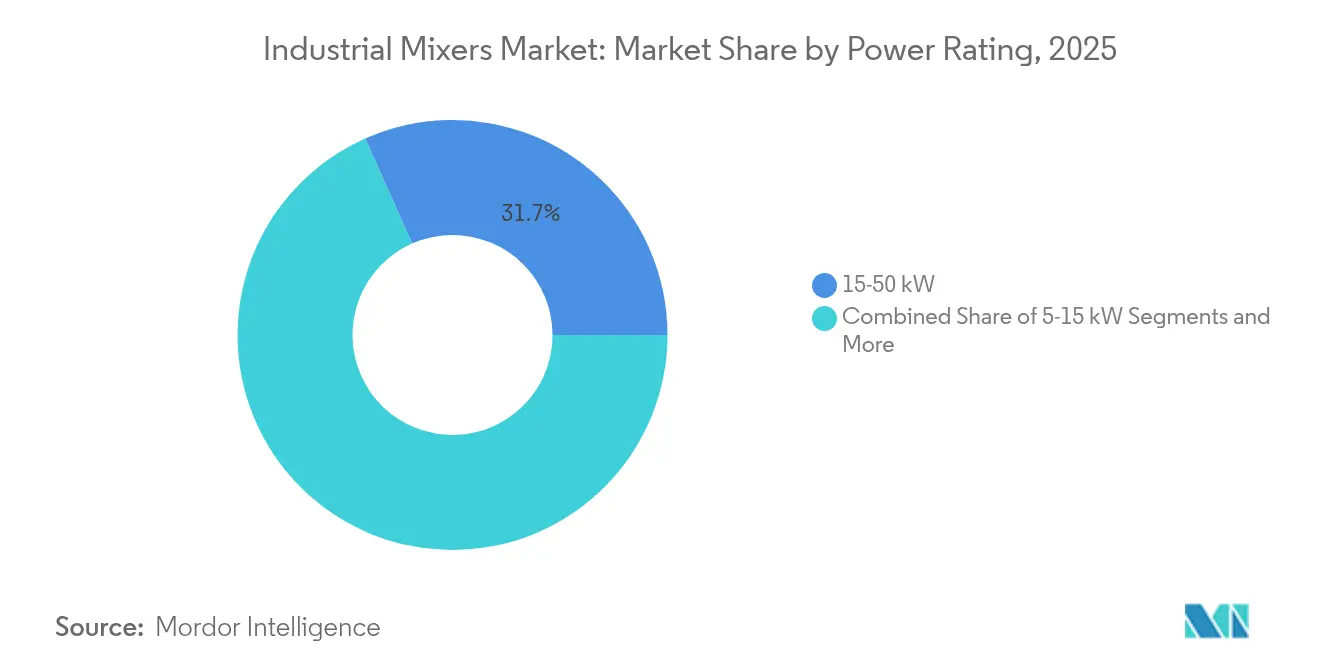
Mixers rated 15-50 kW account for 31.65% of the industrial mixers market size, balancing torque density and energy efficiency for reactor volumes between 10 m³ and 100 m³. Segment leadership stems from widespread deployment in the chemicals, pulp and paper, and wastewater aeration basin sectors. IE5 motors, coupled with planetary gearboxes, deliver high reliability, while VFDs enable dynamic turndown during low-load phases, thereby extending seal life. Sub-5 kW equipment posts the fastest 7.86% CAGR as single-use bioreactors, containerized food‐mixing pods, and pilot plants multiply. These compact skids arrive pre-calibrated, lowering commissioning time to days instead of weeks and appealing to contract development manufacturers that juggle multiple recipes.
Mid-scale 5-15 kW machines serve laboratories transitioning to pilot scale, supporting rapid formulation changes in specialty coatings and nutraceuticals. Systems above 50 kW typically involve massive crystallizers, tailings thickeners, and anaerobic digesters; in these cases, condition monitoring becomes critical because single gearbox failures can halt multi-million-dollar production. Across power bands, OEMs embed digital nameplates that stream runtime data to cloud dashboards, enabling consumption-based service contracts and tighter process analytics across the industrial mixers market.
Geography Analysis
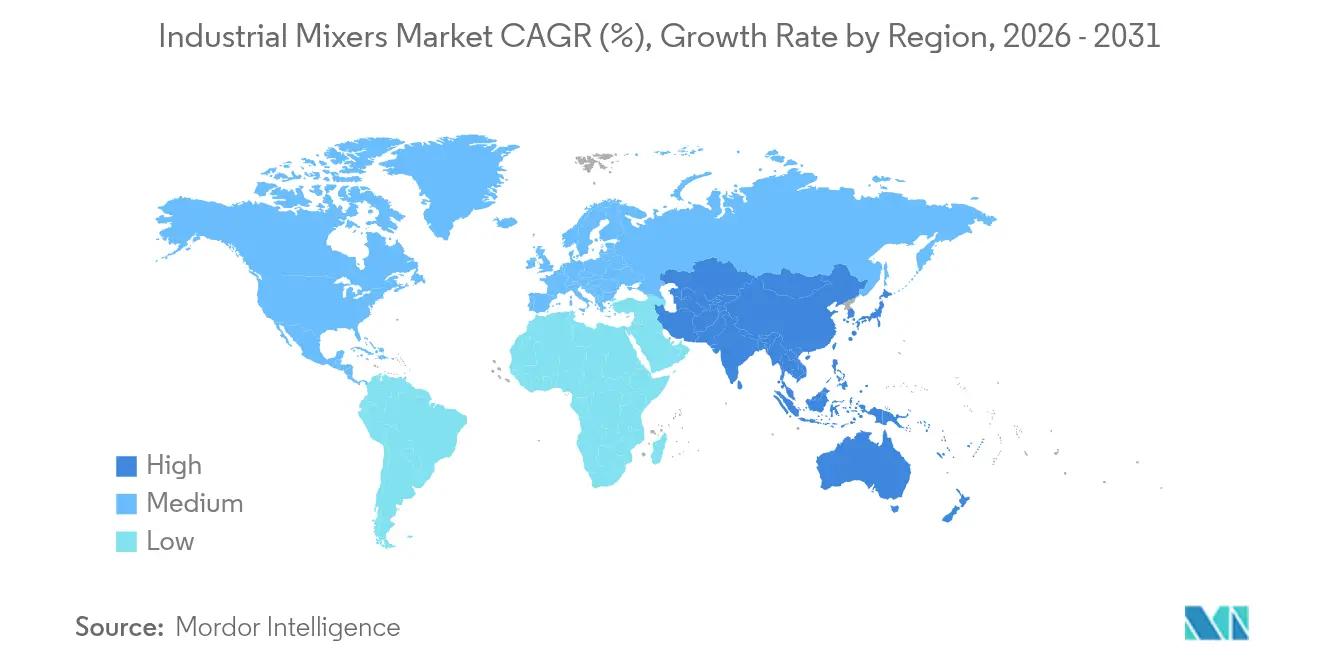
Asia-Pacific holds 29.55% of global revenue and is on track for an 8.18% CAGR through 2031, reflecting government-backed chemical capacity additions, expanding pharmaceutical exports, and aggressive municipal wastewater spending in China and India. In China, refinery off-gas hydrogen recycling creates demand for ATEX-compliant jet mixers, while mega-sized membrane bioreactor projects specify high-efficiency submersible units. India’s production-linked incentive scheme for active pharmaceutical ingredients stimulates upgrades to inline high-shear mixers, and Southeast Asia’s palm-oil downstream clusters adopt special agitators for deodorization stages. Local fabrication lowers cost, but international OEMs dominate premium tiers that demand documented validation.
North America commands a sizable installed base anchored by biotech clusters in Boston, San Diego, and Toronto. Continuous biologic manufacturing lines require sanitary high-shear mixers with single-use flow paths, while shale gas processing relies on jet mixers for crude desalting. Stringent FDA and EPA regulations promote replacement cycles that favor energy-efficient designs. Mexico’s chemical and food manufacturing industries import modular mixing skids from the United States, utilizing near-shore supply chains to minimize lead times. Digital retrofits funded under the U.S. Inflation Reduction Act channel investment toward predictive maintenance modules across legacy fleets within the industrial mixers market.
Europe emphasizes sustainability and operational excellence, guided by the EU Green Deal. Plants adopt IE5 motors, magnetically coupled seals, and low-carbon stainless alloys certified under environmental product declarations. Chemical parks in Germany and the Netherlands prioritize mixers that integrate with plant-wide digital twins. ATEX and IECEx mandates for hydrogen electrolysis units increase certification costs, yet they also protect incumbent suppliers with robust documentation systems. Circular economy initiatives are expanding demand for mixers in plastic recycling, anaerobic digestion, and organic fertilizer production. Collectively, these drivers promote a balanced yet technologically intensive outlook for the industrial mixer market in Europe.

Regulatory Landscape
Industrial mixers sold into regulated processing environments must meet machinery safety, hygienic-design, and workplace rules that vary by region and application. In the European Union, Regulation (EU) 2023/1230 (Machinery Regulation) sets essential health and safety requirements for machinery design and construction. It affects guarding, emergency-stop architecture, and the conformity documentation that mixer OEMs and integrators compile.
For food and feed mixing, EN 13389:2005+A1:2009 specifies safety and hygiene requirements for horizontal shaft mixers. This shapes cleanability, access and inspection provisions, and maintenance procedures in hygienic installations. In the United States, industrial mixer installations commonly reference OSHA general machine guarding requirements under 29 CFR 1910.212 for point-of-operation hazards and safeguarding expectations, especially where application-specific standards do not fully cover vertical or vessel-mounted mixer configurations. Industry guidance, such as EuPIA guidelines for the safe use of vertical post mixers, also influences buyer specifications around interlocked guards, safe access, and emergency stopping. Where hazardous-area deployment applies, the risk assessment and documentation burdens tied to ATEX requirements add another layer to buyer compliance.
Competitive Landscape
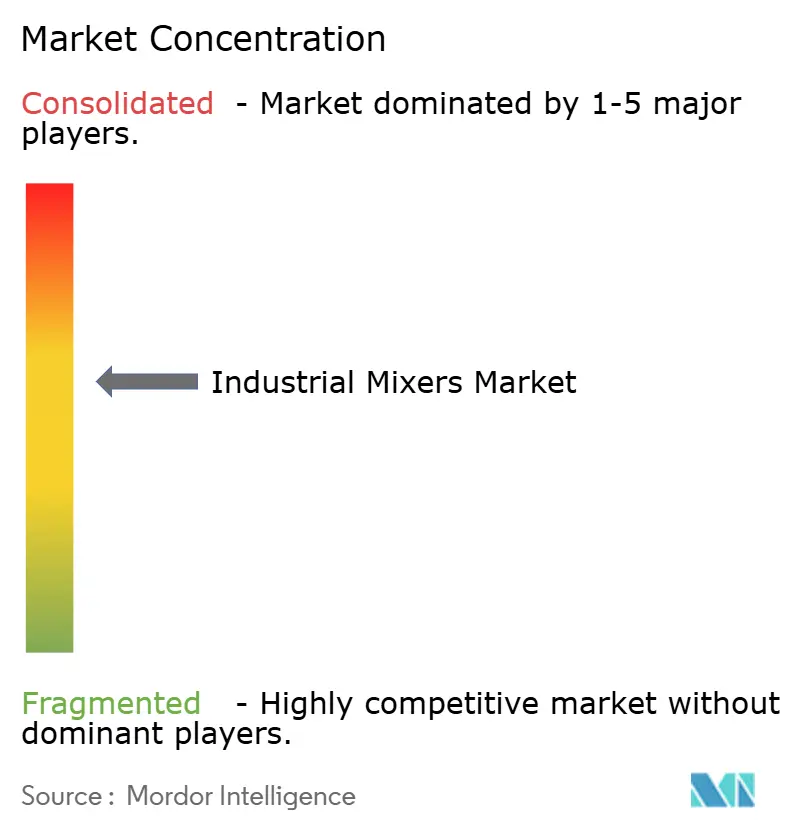
The industrial mixers market remains moderately fragmented. Top players SPX Flow, Sulzer, Alfa Laval, Xylem, and GEA Group, relying on broad portfolios, global service networks, and long-standing customer relationships. These leaders embed IoT gateways and AI-powered analytics that predict seal wear and gearbox fatigue, bundling performance-based service contracts that deepen client lock-in. SPX Flow’s 2025 digital twin demonstration with Siemens illustrates how virtual commissioning reduces validation time for new lines.
Regional specialists fill application gaps. Philadelphia Mixing Solutions delivers corrosion-resistant impellers for high-acidity leach tanks, while Silverson Machines leads the way in laboratory high-shear units with sub-millimeter rotor-stator tolerances. Start-ups target cultivated-meat and lithium-iron-phosphate cathode production with cell-friendly impellers and wear-optimized coatings. Mergers and acquisitions remain active: Alfa Laval’s 2024 acquisition of a niche high-shear firm broadened its pharma footprint, and Xylem’s USD 75 million research and development push in submersible mixers underscores a strategic bet on wastewater. Competitive success increasingly hinges on deep process knowledge, documented validation capabilities, and the ability to deliver modular, digitally connected systems across the industrial mixers market.
Supply-chain security and sustainability now frame the procurement process. Vendors with dual sourcing for castings and gearboxes, as well as ISO 14001-certified plants, gain selection advantages. Companies unable to document scope-3 emissions or provide end-of-life recycling plans risk exclusion from European tenders. Consequently, alliances with green-steel producers and recycled-alloy foundries provide a marketing edge in an industrial mixer industry where ESG scores influence financing and buyer shortlists.
Industrial Mixers Industry Leaders
-
SPX FLOW Inc.
-
Sulzer Ltd.
-
Alfa Laval AB
-
Xylem Inc.
-
GEA Group AG
- *Disclaimer: Major Players sorted in no particular order

Market Opportunities and Future Outlook
White-space continues to open where end users standardize around hygienic, validated, and energy-managed mixing packages across food, beverage, and pharmaceutical operations. In regulated plants, documented cleanability and process repeatability support demand for mixer platforms that build in sensors, connectivity, and serviceability features, rather than treating them as add-on retrofits. Vendor reorganizations point to a continuing focus on higher-value processing segments: GEA moved to a four-division structure from January 1, 2026 (including Pure Flow Processing and Pharma & Food Applications), while Alfa Laval renamed its divisions effective January 1, 2026, including shifting to a Food & Pharma Division. These changes align product and go-to-market attention with hygiene-critical production lines.
There is also room for compliant upgrades and replacements driven by safety and conformity requirements, particularly in Europe under the Machinery Regulation and in facilities adopting harmonized hygienic mixer standards for food and feed duties. OEMs that package mixers with variable-speed drives, condition monitoring, and documentation bundles (risk assessments, guard designs, and maintenance procedures) are positioned to win multi-site standardization programs. This is most visible where customers are rationalizing spares and consolidating service contracts across global footprints.
Recent Industry Developments
- March 2026: Alfa Laval launched the EnSaLine agitator platform for hygienic production, claiming up to 80% energy savings. The rollout expands hygienic design capabilities for pharma and food processing, strengthening Alfa Laval's position in sustainable, energy-efficient mixing.
- April 2025: SPX FLOW introduced updated TM and STM series heavy-duty side-entry mixers for demanding industrial environments. The updates broaden SPX FLOW's portfolio for rugged operations, supporting efficiency gains and reduced downtime in process plants.
- March 2025: SPX FLOW launched ECL Series Quick Connect and Side Entry Mixers to support hygiene-critical applications. The product line improves SPX FLOW's offerings for cleanability and faster maintenance in regulated industries.


Research Methodology Framework and Report Scope
Market Definition and Coverage
For this methodology, the industrial mixers market covers revenue generated from equipment used to blend, disperse, emulsify, homogenize, or suspend materials in industrial processes across major end use industries and geographies.
Scope exclusions: We exclude concrete and mortar mixers, lab scale mixers, and aftermarket services such as installation and maintenance unless they are bundled with new equipment sales.
Segmentation Overview
-
By Product Type
- Agitators
- Special Mixers
- Submersible Mixers
- High-shear Mixers
- Static Mixers
- Jet Mixers
- Other Product Types
-
By End-User Industry
- Chemicals
- Water and Wastewater
- Food and Beverage
- Petrochemicals
- Pharmaceuticals
- Pulp and Paper
- Energy (Power and Renewables)
- Mining and Minerals
- Other Process Industries
-
By Power Rating
- < 5 kW
- 5 – 15 kW
- 15 – 50 kW
- > 50 kW
-
By Geography
-
North America
- United States
- Canada
- Mexico
-
South America
- Brazil
- Argentina
- Rest of South America
-
Europe
- Germany
- United Kingdom
- France
- Italy
- Rest of Europe
-
Asia-Pacific
- China
- Japan
- India
- South Korea
- South-East Asia
- Rest of Asia-Pacific
-
Middle East and Africa
-
Middle East
- Saudi Arabia
- United Arab Emirates
- Rest of Middle East
-
Africa
- South Africa
- Egypt
- Rest of Africa
-
Middle East
-
North America
Data Sources, Market Sizing, and Validation
Desk Research
Desk research is used to build the initial shape of demand and to anchor the model to visible industry signals before assumptions are tested with people in the market. Public sources that helped us cross check industrial activity and relevant end markets included, such as, UN Comtrade and World Bank trade statistics (for mixing and kneading machinery codes), the US Census Bureau manufacturing data, Eurostat industrial production series, and the OECD short term indicators.
We also reviewed technical and regulatory context that changes mixer specifications, using sources such as FDA food processing guidance, 3-A sanitary standards, and openly available articles in engineering journals that discuss hygienic design and mixing performance. Company annual reports, investor decks, and reputable industry press were used to confirm product focus and geographic exposure, and a paid subscription for company financials and news helped fill gaps where public disclosures were limited. These desk sources are not exhaustive, and many other public documents were referenced to collect data, validate it, and clarify open questions.
Primary Interviews and Surveys
Primary work was carried out through expert interviews and structured surveys with a mix of equipment manufacturers, distributors, plant engineering teams, and procurement and maintenance roles that see replacement cycles firsthand. Since demand differs by process intensity and compliance needs, inputs were validated across chemical processing, food and beverage, pharmaceuticals, and water and wastewater applications, and then checked across major regions to confirm the final assumptions we used.
Distribution of primary research fieldwork respondents
| Company type | Respondent position | Region |
|---|---|---|
| Top tier: 27% | CXOs: 15% | APAC: 41% |
| Mid tier: 58% | Functional/Unit leaders: 33% | EMEA: 36% |
| Smaller Players: 15% | Managers: 52% | Americas: 23% |
Market-Sizing & Forecasting
Market sizing starts with a top-down build that reconstructs the addressable equipment spend from industrial output and trade movement, which is then narrowed by application level mixing intensity and typical replacement cycles. To keep the totals realistic, we corroborate the result with selective bottom-up approximations like sampled price and volume checks by mixer type, distributor channel feedback, and supplier revenue splits where disclosures allow it.
A few inputs that materially shape the model include industrial production trends in process industries, capital expenditure appetite in food and pharmaceuticals, wastewater infrastructure additions, typical mixer life and refurbishment cadence, and average selling price ranges that move with materials, motor power, and sanitary design requirements. Where bottom-up detail is missing for smaller geographies or niche mixer designs, gaps are handled through proxy indicators (plant counts, import reliance, and relative equipment intensity) and then adjusted back to the global control total.
For forecasting, scenario analysis is used so that we can reflect different capital spending outcomes, with the base case anchored to what interviewees expect for project pipelines and replacement demand. Growth is then distributed by region and end use using a small set of measurable drivers, which makes the forecast easier to reproduce and explain on a client call.
Data Validation & Update Cycle
Validation is done through multiple checks so the numbers do not rely on one single signal. We compare outputs against independent indicators like trade values for mixing machinery, industrial production direction, and known capex cycles in key end markets, and then we review any large variances before internal sign off.
If an input moves unexpectedly, such as a sharp price change or a sudden shift in order books, the team re-contacts selected interviewees and reruns the sensitivity checks so assumptions stay consistent. Reports are refreshed annually, and interim updates are made when material events occur, followed by a final pre delivery review so clients receive the latest updated view.
Mordor Intelligence's Industrial Mixers Market Size Compared Against Other Published Estimates
Published market sizes for industrial mixers can look quite different because the underlying definitions and counting logic are not always aligned. In our experience, the biggest differences usually come from what equipment types are included, whether services are added to equipment revenue, and how price and replacement demand are treated over the forecast window.
A second driver is the handling of adjacent categories that sound similar but do not belong in the same demand pool, along with the timing of currency conversion and the year used as the base. Some estimates lean on older base years or report growth only, which makes it harder to reconcile to a clear current year value, and then the gap widens when aggressive price escalation is applied without checks against trade and production signals.
Benchmark comparison
| Source | Market Size | Gaps in Research Methodology |
|---|---|---|
| Mordor Intelligence | USD 2.88 B (2025) | |
| Trade Journal A | USD 2.60 B (2020) | Uses an older base year and a broad end use view, which can understate the current cycle when more recent price and project activity are not revalidated. |
| Industry Brief B | USD 3.30 B (2026) | Reports a forward year value without a clear current year bridge, and the inclusion of wider mixing equipment definitions can inflate the number versus dedicated industrial mixer equipment revenue. |
The table shows that the spread is largely explained by year alignment and by whether adjacent equipment and services are counted. When the model is anchored to a defined equipment only scope and then cross checked with trade and industrial activity signals, the current year value becomes easier to trace and repeat, which is the approach applied by Mordor Intelligence.


Key Questions Answered in the Report
How large is the industrial mixers market in 2026?
The industrial mixers market size stands at USD 3.1 billion in 2026 and is projected to grow at a 7.64% CAGR through 2031.
Which region is expanding the fastest?
Asia-Pacific leads growth with an 8.18% CAGR on the strength of chemical, pharmaceutical, and water-treatment investments.
What product category leads current revenue?
Agitators hold the largest 35.85% revenue share owing to versatility and broad installed base across process industries.
Which end-user segment is growing quickest?
Pharmaceuticals are set to post a 7.74% CAGR as continuous manufacturing and biologic production expand.
How are energy-efficiency regulations shaping product design?
IE5 motors and VFD-integrated drives cut mixer power consumption by up to 20%, aligning with EU and forthcoming global efficiency mandates.
Page last updated on:






