
Industrial Metrology Market Size and Share
Market Overview
| Study Period | 2020 - 2031 |
|---|---|
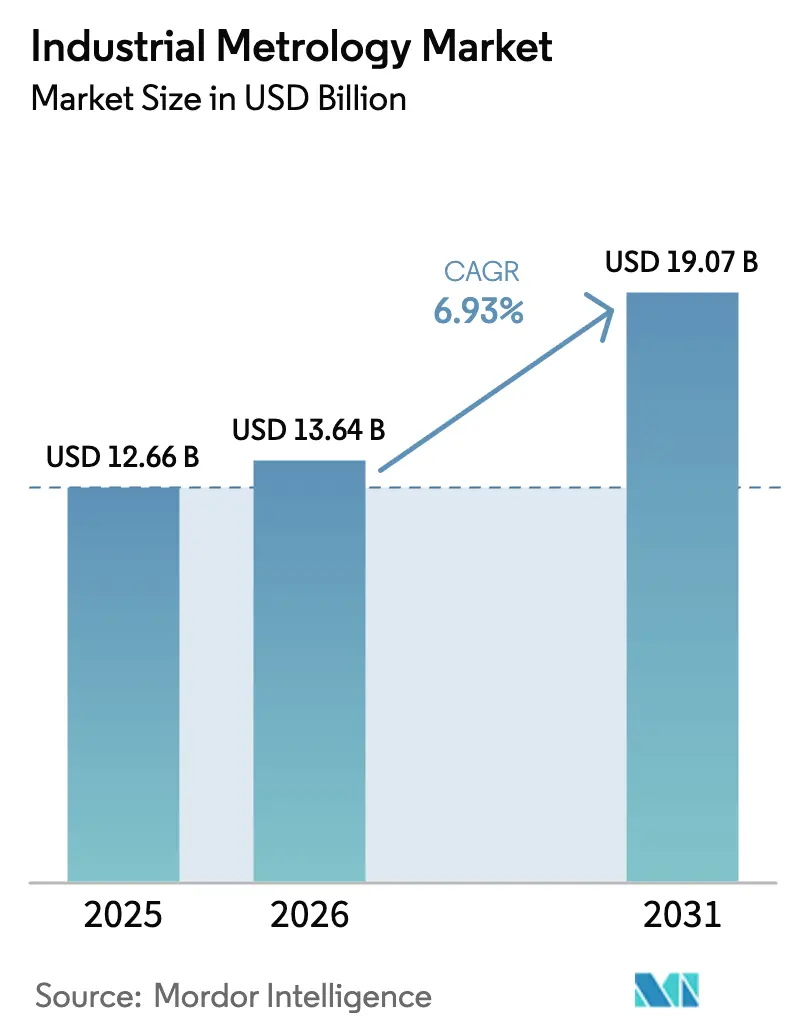
| Market Size (2026) | USD 13.64 Billion |
| Market Size (2031) | USD 19.07 Billion |
| Growth Rate (2026 - 2031) | 6.93% CAGR |
| Fastest Growing Market | Asia Pacific |
| Largest Market | Asia Pacific |
| Market Concentration | Medium |
Major Players *Disclaimer: Major Players sorted in no particular order Image © Mordor Intelligence. Reuse requires attribution under CC BY 4.0. | |
Industrial Metrology Market Analysis by Mordor Intelligence
The Industrial Metrology Market size is projected to expand from USD 12.66 billion in 2025 and USD 13.64 billion in 2026 to USD 19.07 billion by 2031, registering a CAGR of 6.93% between 2026 to 2031. Semiconductor fabs moving to sub-5-nanometer nodes, battery gigafactories tightening electrode tolerances, and digital-twin programs demanding real-time dimensional data are converging to accelerate adoption. Vendors that deliver nanometer-scale accuracy, inline speed, and cloud connectivity are winning contracts, especially in Asia-Pacific, where electric-vehicle and display supply chains are expanding. North America’s growth is anchored by CHIPS and Science Act incentives, while Europe’s momentum stems from Industrie 4.0 mandates that require machine-to-enterprise data exchange.
Key Report Takeaways
- By offering, hardware led with 73.44% revenue share in 2025, services are forecast to expand at a 7.61% CAGR through 2031.
- By equipment, coordinate measuring machines commanded 39.83% of the industrial metrology market share in 2025, and optical digitizers and scanners are projected to grow at an 8.22% CAGR to 2031.
- By form factor, stationary benchtop systems captured 47.59% of revenue in 2025, while portable handheld solutions are advancing at a 7.71% CAGR through 2031.
- By application, quality control and inspection held 43.27% of the industrial metrology market share in 2025; virtual simulation and digital twins are expected to accelerate at a 7.96% CAGR to 2031.
- By end-user industry, automotive accounted for 34.62% of revenue in 2025, and semiconductor and electronics are set to rise at an 8.43% CAGR through 2031.
- By geography, Asia-Pacific contributed 38.19% of revenue in 2025 and is forecast to expand at a 7.91% CAGR to 2031.
Note: Market size and forecast figures in this report are generated using Mordor Intelligence’s proprietary estimation framework, updated with the latest available data and insights as of January 2026.
Global Industrial Metrology Market Trends and Insights
Drivers Impact Analysis*
| Driver | (~) % Impact on CAGR Forecast | Geographic Relevance | Impact Timeline |
|---|---|---|---|
| EV-battery Gigafactories Driving Inline Metrology Spend in Asia | +1.2% | Asia-Pacific core, spill-over to North America | Medium term (2-4 years) |
| Digital-Twin Adoption | +1.0% | Global, with early gains in Germany, United States, Japan | Medium term (2-4 years) |
| Sub-5 nm Node Migration Raising Overlay Metrology Demand in United States Fabs | +0.9% | North America and East Asia (Taiwan, South Korea) | Short term (≤ 2 years) |
| CHIPS-Act Mandates for Domestic Advanced-Packaging Metrology | +0.8% | United States, with supplier spill-over to Mexico and Canada | Medium term (2-4 years) |
| AI-enabled Predictive QA Reducing Recall Costs for Chinese OEMs | +0.7% | China, with adoption spreading to Southeast Asia | Short term (≤ 2 years) |
| Portable CMM Penetration of On-Machine Inspection on German Shopfloors | +0.6% | Europe core (Germany, France, Italy), expanding to Central Europe | Medium term (2-4 years) |
| Source: Mordor Intelligence | |||
EV-Battery Gigafactories Driving Inline Metrology Spend In Asia
Battery-cell tolerances have narrowed to single-digit micrometers, pushing gigafactories to replace sampling with 100% inline inspection. CATL and BYD together directed nearly USD 10 billion of 2025 capital outlays to new plants and earmarked about 8% for laser, X-ray, and robotic metrology hardware. Omron’s gauges now repeat to 0.5 µm at 100 m/min line speeds, letting operators catch coating defects before formation cycles.[1]Omron Corporation, “Laser-Based Thickness Gauges for Battery Manufacturing,” omron.com Thermo Fisher shipped 22% more XRF spectrometers to Asian battery sites during the first half of 2025 to verify lithium and nickel content in real time. Korean producers retrofitted lines with robotic CMM cells and cut scrap from 4.2% to 2.8% within a year. The cumulative effect is creating a USD 1.2 billion metrology opportunity in battery manufacturing by 2028.
Digital-Twin Adoption
Digital twins depend on continuous streams of as-built geometry, so factories are wiring CMMs and scanners directly to cloud platforms. ISO 23247 provides a reference architecture for device-agnostic data exchange and has gained traction as suppliers prepare for 2025 compliance deadlines. Siemens reported that 38% of Xcelerator licenses sold in 2025 included twin modules that ingest metrology data, up from 22% two years earlier.[2]Siemens AG, “Xcelerator Digital Twin Software Licenses,” siemens.com NIST’s testbed validates interoperability among multi-vendor devices, removing a key integration bottleneck. Aerospace users trimmed first-article inspection cycles from six weeks to ten days by letting the twin flag deviations automatically. Edge gateways that compress 500 MB point clouds in situ are further reducing network latency to acceptable levels.
Sub-5 nm Node Migration Raising Overlay Metrology Demand In United States Fabs
Logic fabs moving to 3 nm and 2 nm nodes face overlay budgets below 1.5 nm, making ultra-precise metrology indispensable. The CHIPS Metrology Program steered USD 252 million toward new reference standards for overlay and critical-dimension measurement during 2024-2025.[3]National Institute of Standards and Technology, “CHIPS Metrology Program,” nist.gov Intel’s Arizona site installed KLA Archer systems that deliver sub-nanometer accuracy, helping first-silicon yield reach 85% in late 2025. Applied Materials’ PROVision eBeam platform images line-edge roughness at 0.1 nm, supporting gate-all-around architectures. Domestic gaps remain in micro-bump coplanarity gauges, forcing fabs to source certain tools abroad despite policy goals. Partnerships between startups and incumbents aim to close that gap before high-volume 3D packaging ramps in 2027.
CHIPS-Act Mandates For Domestic Advanced-Packaging Metrology
The CHIPS and Science Act ties manufacturing grants to sourcing at least 50% of metrology tools from the United States or allied suppliers by 2028, shifting purchase preference overnight. Onto Innovation co-developed an optical-acoustic system with Intel that measures through-silicon-via depth without wafer damage, demonstrating how domestic collaborations can fill capability gaps. NIST’s Albany testbed offers vendors a neutral site to benchmark chiplet-inspection accuracy and earn qualification status. TSMC’s Arizona fab pledged to purchase 40% North American metrology equipment, creating a USD 800 million demand pool through 2027. The lack of United States suppliers for sub-micrometer CT remains a bottleneck but also a clear white space for innovators.
Restraints Impact Analysis*
| Restraint | (~) % Impact on CAGR Forecast | Geographic Relevance | Impact Timeline |
|---|---|---|---|
| Shortage of Nanometrology Engineers in North America | -0.5% | United States and Canada | Long term (≥ 4 years) |
| Interoperability Gaps Between Legacy CMM and Cloud Platforms | -0.4% | Global, with acute pain in Europe and North America | Medium term (2-4 years) |
| CapEx Pull-Backs Amid Semiconductor Down-Cycle 2025-26 | -0.8% | Global, concentrated in East Asia and North America | Short term (≤ 2 years) |
| Cyber-Risk Concerns Hindering Cloud-Hosted Measurement Data | -0.3% | Global, with heightened sensitivity in defense and aerospace | Medium term (2-4 years) |
| Source: Mordor Intelligence | |||
Shortage Of Nanometrology Engineers In North America
Advanced nodes require specialists versed in scatterometry, atomic-force microscopy, and e-beam techniques, yet United States universities graduated fewer than 200 nanometrology engineers in 2024. Intel needed 120 such professionals for its 3 nm ramp in Arizona, but had filled only 68 roles by mid-2025, relying on foreign hires to bridge the gap. Median time to fill senior metrology positions stretched to 22 weeks, hampering tool installations and process qualification schedules. NIST launched a program to train 500 technicians, though the curriculum focuses on calibration rather than advanced measurement science. Rising salaries, with starting offers averaging USD 140,000, are 35% above 2023 levels, adding cost pressure without fully solving the capacity shortfall.
Interoperability Gaps Between Legacy CMM And Cloud Platforms
Many CMMs purchased before 2020 lack modern APIs, forcing 62% of United States plants to rely on manual data entry or custom middleware to feed inspection results into analytics systems. Retrofit connectivity kits from Hexagon and Zeiss cost USD 25,000-80,000 each, limiting adoption at small and medium enterprises. Proprietary file formats introduce rounding errors that can exceed 1 µm when translated for digital-twin platforms, undermining accuracy goals. ISO 23952 will define a universal schema, but publication is not expected until 2027. Until then, manufacturers must maintain parallel IT stacks, which will inflate support budgets by an estimated 18%.
*Our forecasts treat driver/restraint impacts as directional, not additive. The impact forecasts reflect baseline growth, mix effects, and variable interactions.
Segment Analysis
By Offering: Outcome-Based Contracts Reshape Spending
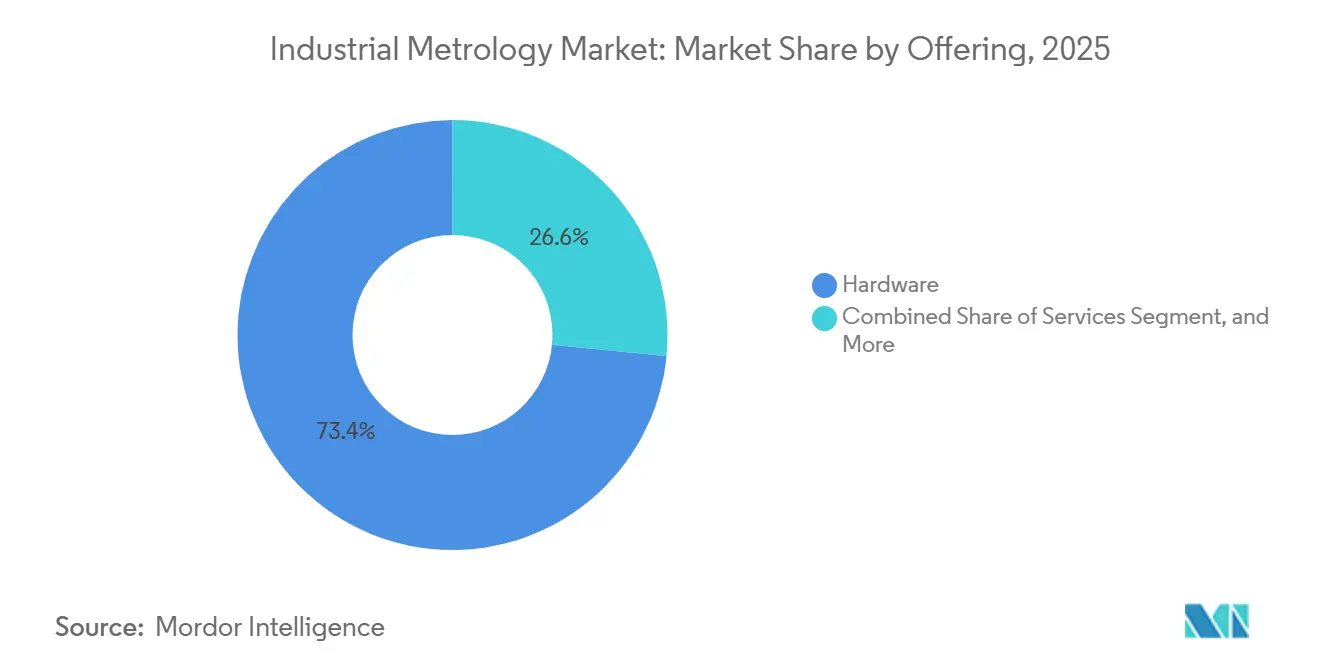
Hardware accounted for a 73.44% share of revenue in 2025, while services are anticipated to grow at a steady 7.61% CAGR through 2031. Hardware still anchors spending, but the shift to subscriptions is unmistakable. Hexagon drew 28% of 2025 metrology revenue from service contracts, up nine points in two years. Tool-as-a-service models from KLA and Applied Materials guarantee uptime, converting fixed capital outlays to operating expenses. For smaller plants, Renishaw’s pay-per-use Equator gauging trimmed three-year ownership costs by 22%.
Market appetite for services lifts the industrial metrology market, driven by recurring revenue streams, as more users bundle calibration, updates, and analytics under multi-year contracts. Vendors that demonstrate uptime and deliver AI-based process recommendations capture loyalty, while pure hardware suppliers risk commoditization.


By Equipment: Optical Digitizers Lead The Growth Curve
CMMs, long the backbone of automotive and aerospace quality rooms, accounted for 39.83% of industrial metrology market revenue in 2025, yet blue-light scanners from GOM and others are expanding at an 8.22% CAGR. FAA Advisory Circular 20-62B cleared optical scanning for first-article inspection of non-critical parts, unlocking a USD 680 million yearly aerospace niche.
X-ray CT and AOI systems add momentum, especially in battery lines and advanced packaging. Nikon’s collaborative robotic CMM, priced 35% below conventional cells, is widening access for small manufacturers. As 3D printing proliferates, full-field optical capture shortens reverse-engineering cycles, edging contact CMMs toward niche ultraprecision roles.
By Form Factor: Portable Tools Empower Field Teams
Stationary benches accounted for 47.59% of revenue in 2025, but portable handheld systems are rising 7.71% annually. Hexagon’s 8.5 kg Absolute Arm lets wind-farm technicians measure blade roots on-site, and Zeiss’s T-SCAN Hawk 2 gives maintenance crews 25 micrometer accuracy without a fixed lab.
Inline machine-mounted probes shrink first-article loops by 68% on German shopfloors. Robotic cells leveraging laser scanners support 100% inspection at battery line speeds above 100 m/min. The industrial metrology market for field service and maintenance tasks is therefore expanding beyond factory walls, prompting vendors to balance ruggedness with micrometer-level precision.
By Application: Digital Twins Gain Momentum
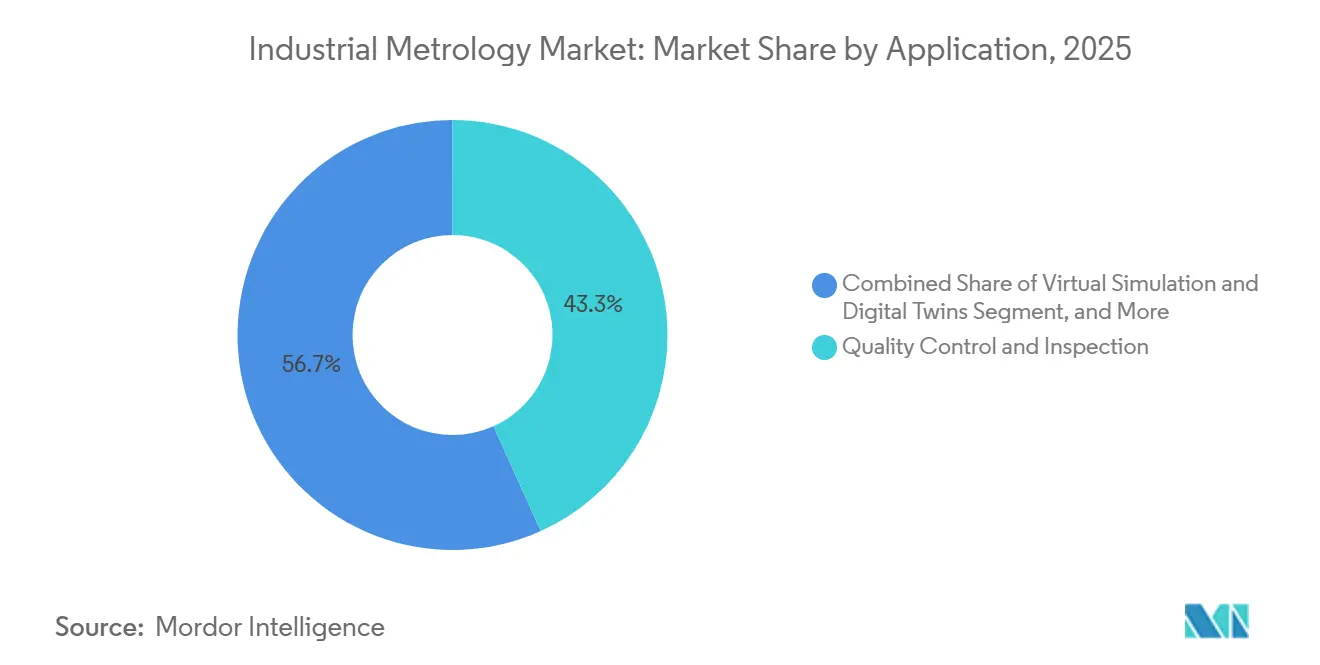
Quality control keeps the lion’s share at 43.27% in 2025, but virtual simulation and digital twins are climbing 7.96%, as ISO 23247 drives standardized data pipelines. Siemens Teamcenter users embed metrology feedback to update FEA models, and Boeing trims fuselage rework by 18% by linking CMM data to assembly twins.
Reverse engineering thrives as aerospace maintains aging fleets; structured-light scans recreate obsolete parts in hours. Alignment systems guided by laser trackers position EV battery packs to sub-millimeter tolerances. Together, these workflows push the industrial metrology market toward data-centric value propositions rather than discrete inspection tasks.
By End-User Industry: Semiconductor Leads The Upside
Automotive contributed 34.62% of revenue in 2025, but semiconductor and electronics grew fastest at an 8.43% CAGR, buoyed by the CHIPS Act and 3 nm process ramps requiring up to 50 tools per fabrication line. Advanced packaging demands micro-bump coplanarity measurement below 2 micrometers, an area where domestic capability is scarce, creating space for innovators.
Aerospace and defense adopt portable CMMs for large-scale assemblies, and medical devices embrace optical systems to verify implants under 10 micrometers. Renewable energy, notably wind, leverages field scanners for blade and tower inspections, illustrating the industrial metrology industry’s diversification.
Geography Analysis
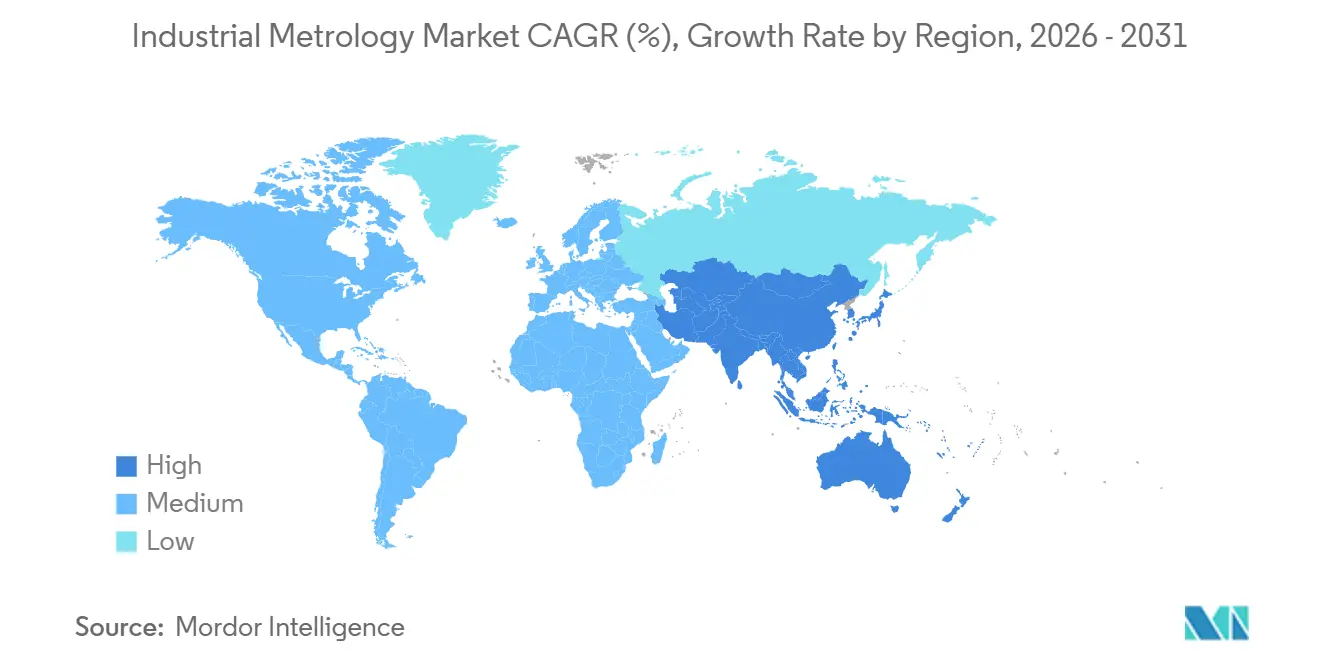
Asia-Pacific generated 38.19% of revenue in 2025, and its 7.91% CAGR will outpace other regions. China’s gigafactory build-out allocates about 8% of equipment budgets to metrology, translating to a USD 400 million annual spend, while South Korea’s OLED expansions drive AOI demand with pixel-defect thresholds below 5 micrometers. Japan’s USD 310 million subsidy for domestic toolmakers nurtures supply resilience. India and Australia provide secondary momentum via export-oriented auto components and mining digital twins.
North America accounted for 28% of 2025 revenue. The CHIPS Metrology Program’s USD 252 million outlay funds reference standards, and fabs in Arizona, New York, and Utah will install more than 300 tools by 2027, adding USD 1.8 billion to regional demand. Canada’s aerospace cluster and Mexico’s EV supply base further broaden the footprint.
Europe held about a 26% share, propelled by Germany’s Industrie 4.0 requirements for real-time dimensional data. On-machine metrology shaved first-part cycle time by 68% at Tier-1 suppliers, yielding USD 2.6 million in annual plant savings. The EU Chips Act promises EUR 43 billion, yet its rollout lags behind the United States. UK aerospace, French body-panel stamping, and Italian machine-tool touch probes round out demand, while export controls limit Russia’s access to sub-10 nm tools.

Regulatory Landscape
Industrial metrology operates under a mix of legal-metrology rules and voluntary industrial standards that affect calibration, traceability, and conformity assessment for measurement devices used in regulated manufacturing settings. In the United States, NIST updates the legal-metrology framework through annual editions of Handbook 44 and Handbook 130 (2025 editions), which influence how measurement systems are specified, tested, and accepted across states and regulated applications. In the United Kingdom, The Product Safety and Metrology etc. (Amendment) Regulations 2024 updated elements tied to the Measuring Instruments Regulations 2016, while the Product Regulation and Metrology Act 2025 expanded ministerial powers to set measurement units, product requirements, and enforcement mechanisms, supporting faster rule updates as measurement technologies evolve.
On the standards side, ISO releases continue to tighten requirements for industrial measurement management and equipment specification, shaping OEM documentation and user audit readiness. ISO 10012:2026 reinforces measurement management system requirements aligned with broader quality frameworks, while ISO 10360-102:2026 adds common grammar for symbols used in coordinate measuring system specifications, supporting clearer procurement and verification across multi-vendor fleets. Australia is also emphasizing compliance programs in its 2025-26 legal metrology priorities through the National Measurement Institute, aligning national practices with international approaches and increasing the weight of traceable calibration and documented compliance for suppliers serving global manufacturing networks.
Value Chain Analysis
The industrial metrology value chain begins with precision component inputs (optics, sensors, lasers, motion stages, controllers) and measurement software, then moves into system design and integration by OEMs that bundle hardware, software, and calibration into turnkey solutions. Distribution and deployment are largely handled through direct sales to large accounts (semiconductor fabs, automotive OEMs, battery lines) and specialized integrators that connect metrology tools to automation, MES/QMS, and digital-twin platforms. Aftermarket services, including calibration, maintenance, retrofit connectivity kits for legacy assets, and application engineering, are taking more of the spend as manufacturers shift toward uptime guarantees and outcome-based contracts.
Upstream and midstream collaboration is tightening as measurement moves from lab-based inspection to in-line process control, particularly in semiconductors and advanced packaging where hybrid metrology and data continuity affect yields. Partnerships announced in 2026 illustrate this integration trend, including Rigaku and Onto Innovation aligning around hybrid metrology for complex devices, and Applied Materials and Advantest working to link manufacturing and test flows for AI-chip development via platform integration. On manufacturing localization, supply chains are also being reinforced through region-specific alliances tied to new capacity, such as GlobalWafers America working with NADA Technologies around a new 300 mm wafer facility in the United States and Tata Electronics partnering with ASML to support lithography integration and training for India fab ramp activities. These moves bring metrology vendors closer to upstream materials and downstream process-control ecosystems, while increasing the role of interoperability and secure data handling across multi-party production networks.
Competitive Landscape
The industrial metrology market is moderately consolidated, with the five largest suppliers, Hexagon, Zeiss, KLA, Applied Materials, and Nikon collectively accounting for about 45% of 2025 revenue, while dozens of regional and niche players fill application-specific gaps. Incumbents differentiate through software ecosystems that blend AI-driven analytics with multi-sensor hardware, a strategy that locks in recurring service fees and raises switching costs. Consolidation continued in 2025 when Hexagon acquired FARO for USD 1.4 billion, instantly adding portable arms and laser trackers to its predominantly stationary CMM lineup. The deal highlights a broader push to own the entire form-factor spectrum and to cross-sell cloud analytics across hardware fleets. At the same time, service contracts now account for roughly one-third of aggregate vendor revenue, signaling a pivot from transactional hardware sales to outcome-based relationships.
Technology roadmaps among market leaders center on tighter process control for sub-5 nm semiconductors, faster battery-line inspection, and cloud-native data exchange. KLA launched the Archer 900 overlay tool with sub-0.3 nm precision, boosting wafer-per-hour throughput by 40% and giving fabs headroom to sustain EUV yields. Zeiss answered with INSPECT 2025, a browser-based platform that fuses CMM, scanner, and third-party data into unified dashboards that recommend recalibration intervals. Nikon teamed up with Universal Robots to introduce a collaborative CMM priced 35% below traditional robotic cells, enabling small manufacturers to automate mixed-model inspection without writing code. Applied Materials expanded its Israeli R&D hub, hiring 180 engineers to accelerate the development of multi-beam e-metrology for 3D packaging, underscoring its willingness to invest ahead of node transitions.
Below the top tier, specialty suppliers are leveraging price-performance angles or novel sensing physics to steal share in high-growth niches. Bruker Alicona’s focus-variation systems deliver nanometer-scale vertical resolution at roughly 70% of the cost of traditional interferometers, attracting medical-device firms that must verify fine surface finishes. CyberOptics scaled its multi-function 3D sensors from semiconductor to PCB inspection, expanding the total addressable market without increasing the bill of materials. Cloud-first startups offer API-rich analytics layers that sit above heterogeneous hardware, eroding proprietary data silos and shortening proof-of-concept cycles for digital twins. Competitive intensity is therefore migrating from pure accuracy claims toward integrated workflows that couple sub-micrometer measurement, real-time analytics, and service guarantees, a dynamic likely to keep pricing disciplined yet favor vendors that innovate fastest.
Industrial Metrology Industry Leaders
Carl Zeiss AG
Nikon Corporation
FARO Technologies
Renishaw plc
Mitutoyo Corporation
- *Disclaimer: Major Players sorted in no particular order


Market Opportunities and Future Outlook
A key opportunity is in semiconductor advanced packaging and 3D integration, where metrology requirements extend beyond wafer overlay into panel-level and chiplet-centric process control. Panel packaging formats and higher-density redistribution layers increase the need for semiconductor-grade measurement across larger substrates, creating room for high-throughput optical and hybrid approaches that can maintain accuracy while scaling field of view. Commercial traction for packaging-focused metrology shows up in 2026 activity, including Nova reporting its WMC platform selection as a tool-of-record for advanced packaging processes, reinforcing demand for specialized metrology tied to packaging yield and line control.
A second opportunity is the shift from discrete inspection toward data-centric, closed-loop manufacturing workflows that connect metrology outputs with process tools, test systems, and digital twins. That is expanding demand for software layers, secure data pipelines, and in-line analytics that reduce measurement cycle time and turn measurement results into control actions, particularly as factories work around legacy equipment interoperability gaps before broader schemas mature. Wireless and automation-ready measurement systems also broaden use cases on production floors and in field environments, supported by 2026 product activity such as new robot-mountable laser radar and large-stage confocal measurement systems targeting high-throughput electronics manufacturing and automated inspection workflows.
Recent Industry Developments
- July 2026: Carl Zeiss AG introduced Virtual Clamping as an app for ZEISS INSPECT, enabling more flexible component clamping and alignment workflows in 3D metrology. The release supports software-led productivity gains by reducing setup friction and enabling more repeatable measurement routines. It also reinforces the shift toward software ecosystems that standardize inspection steps across mixed hardware fleets.
- May 2026: Nikon launched the NEXIV VMF-K6561 3D confocal measurement system with a 650 x 610 mm stage, targeting full-panel measurement needs in electronics manufacturing. The larger measurement envelope supports higher-throughput inspection for panel-level processes where coverage and repeatability are recurring bottlenecks. It places Nikon more directly in metrology use cases tied to advanced packaging and large-format substrate workflows.
- November 2024: Nikon completed the divestment of its laser scanning and Focus Inspection software business to LK Metrology. The transaction narrowed Nikon's portfolio focus while transferring selected scanning and inspection assets to a specialist metrology player. It also pointed to ongoing portfolio rationalization as vendors prioritize segments where they can pair sensors, automation integration, and software workflows.


Research Methodology Framework and Report Scope
Market Definition and Coverage
This market covers tools, software, and related services used to measure manufactured parts and assemblies so manufacturers can verify dimensions, form, and surface quality during inspection and production.
Scope exclusions: Stand-alone laboratory microscopes and general test and measurement instruments that are not used for dimensional verification are excluded.
Segmentation Overview
- By Offering
- Hardware
- Software
- Services
- By Equipment
- Coordinate Measuring Machines
- Optical Digitizers and Scanners
- X-ray and Computed Tomography Systems
- Automated Optical Inspection
- 2D Metrology Equipment
- Inline Metrology Cells, Robotic
- By Form Factor
- Stationary Benchtop Systems
- Portable Handheld Systems
- Inline, On-Machine Solutions
- Robotic and Automated Cells
- By Application
- Quality Control and Inspection
- Reverse Engineering
- Alignment and Assembly
- 3D Mapping and Modelling
- Virtual Simulation and Digital Twins
- By End-User Industry
- Automotive
- Aerospace and Defense
- Semiconductor and Electronics
- Energy and Power Generation, Renewables
- Heavy Machinery and Machine Tools
- Medical Devices and Healthcare
- Other End-User Industries
- By Geography
- North America
- United States
- Canada
- Mexico
- Europe
- Germany
- United Kingdom
- France
- Russia
- Rest of Europe
- Asia-Pacific
- China
- Japan
- India
- South Korea
- Australia
- Rest of Asia-Pacific
- Middle East and Africa
- Middle East
- Saudi Arabia
- United Arab Emirates
- Rest of Middle East
- Africa
- South Africa
- Egypt
- Rest of Africa
- Middle East
- South America
- Brazil
- Argentina
- Rest of South America
- North America
Data Sources, Market Sizing, and Validation
Desk Research
Desk research was used to set the market boundary, map the typical buying chain, and build reference ranges for volumes and pricing. We used public sources such as manufacturing output and industrial production series, customs and trade statistics for measurement and inspection equipment, patent databases covering metrology filings, and standards and guidance from bodies such as ISO and NIST.
In addition, company annual reports, investor presentations, product documentation, and reputable press coverage were reviewed to understand product bundles, replacement cycles, and the move toward inline and automated metrology cells. Where needed, paid subscriptions were used for company financials and news monitoring, plus patent lookups and import and export shipment-level views to check regional movement. The sources listed above are illustrative, and many other public references were used for collection, validation, and clarification.
Primary Interviews and Surveys
Primary work included expert interviews and structured surveys with metrology hardware suppliers, software and service providers, system integrators, and end users managing quality labs and production inspection. Inputs were collected across APAC, EMEA, and the Americas to test assumptions on inline adoption, software attach rates, and calibration needs across different manufacturing footprints.
Distribution of primary research fieldwork respondents
| Company type | Respondent position | Region |
|---|---|---|
| Top tier: 28% | CXOs: 15% | APAC: 41% |
| Mid tier: 56% | Functional/Unit leaders: 34% | EMEA: 32% |
| Smaller Players: 16% | Managers: 51% | Americas: 27% |
Market-Sizing & Forecasting
Sizing starts with a top-down build that reconstructs the demand pool from manufacturing output and investment signals, and then allocates spending into metrology hardware, software, and services across key end-use industries. Once the first cut is ready, we corroborate it with selective bottom-up approximations, including sampled average selling prices by equipment category multiplied by expected unit activity, channel checks on project deal sizes for inline metrology cells, and supplier revenue splits used to adjust totals.
Key inputs used (illustrative) include automotive and aerospace production trends, electronics and semiconductor capacity additions, factory automation adoption, the share of inline versus lab-based inspection, and typical refresh and calibration cycles for measurement systems. Pricing progression was kept practical by linking it to mix shifts toward automated and portable systems, and to software attach rates, rather than assuming one uniform inflation factor across all instruments. For forecasting, scenario analysis was used around manufacturing capex and policy-linked expansion plans, and the final path was aligned to what industry experts expect for utilization and procurement timing. When granular details were missing in smaller geographies, gaps were handled through proxy ratios tied to industrial output and installed manufacturing base, followed by reasonableness checks from interviews.
Data Validation & Update Cycle
Outputs were checked against independent signals, including regional manufacturing activity, trade flows for measurement equipment, and implied spending per unit of industrial output, so larger jumps could be challenged early. When the model showed variances that were hard to explain, assumptions were revisited, and then a second-pass review by another analyst was completed before sign-off.
The report is refreshed annually, and interim updates are triggered when material events occur, such as large plant announcements, changes linked to quality compliance requirements, or sharp shifts in industrial capex expectations. Before delivery, a fresh validation pass is completed so clients receive the most current view that can be traced back to clear inputs and repeatable steps.
Mordor Intelligence's Industrial Metrology Market Estimate Compared With Other Published Estimates
Published market sizes for industrial metrology often differ because sources do not always count the same product sets, and they also anchor base years and currency timing differently. The treatment of software and services, plus how inline measurement is counted versus lab equipment, creates visible spread in final totals.
Stand-alone laboratory microscopes and general test and measurement instruments that are not used for dimensional verification sit outside Mordor Intelligence's scope, which reduces overlap with adjacent instrumentation categories that some publishers may include.
Benchmark comparison
| Source | Market Size | Gaps in Research Methodology |
|---|---|---|
| Mordor Intelligence | USD 12.66 B (2025) | |
| Global Consultancy A | USD 13.27 B (2024) | Uses a different base year and may blend a wider set of smart manufacturing measurement spend into industrial metrology, which can shift the equipment mix and the rolled-forward value. |
| Industry Publisher B | USD 11.76 B (2024) | The lower starting point can reflect a narrower count of software and services, and differences in whether X-ray and CT systems are consistently assigned to industrial production use cases. |
The spread is mostly explained by timing, adjacent product inclusions, and how software and services are attached to hardware revenue in the build. When these items are held consistent and checked against manufacturing and trade signals, the final number becomes easier to reconcile across years and regions.


Key Questions Answered in the Report
How large is the industrial metrology market in 2026?
The industrial metrology market size reached USD 13.64 billion in 2026 and is projected to hit USD 19.07 billion by 2031.
Which region leads spending on dimensional inspection tools?
Asia-Pacific held 38.19% of 2025 revenue and is expanding fastest at a 7.91% CAGR, fueled by battery and semiconductor investments.
What segment of equipment is growing quickest?
Optical digitizers and scanners are forecast to rise at an 8.22% CAGR as aerospace suppliers embrace blue-light scanning for additive parts verification.
Why are services gaining share in metrology budgets?
Manufacturers prefer outcome-based contracts that bundle hardware, calibration, software updates, and cloud analytics, driving services to a 7.61% CAGR.
How is the CHIPS and Science Act influencing demand?
U.S. incentives require domestic metrology capability, prompting fabs to install hundreds of new overlay, CD, and CT tools between 2025 and 2027.
What skills shortage is restraining growth?
Fewer than 200 nanometrology engineers graduated in the United States in 2024, delaying advanced-node fab ramp-ups and adding labor cost pressure.
Page last updated on:


