
Industrial Metaverse Market Size and Share
Market Overview
| Study Period | 2020 - 2031 |
|---|---|
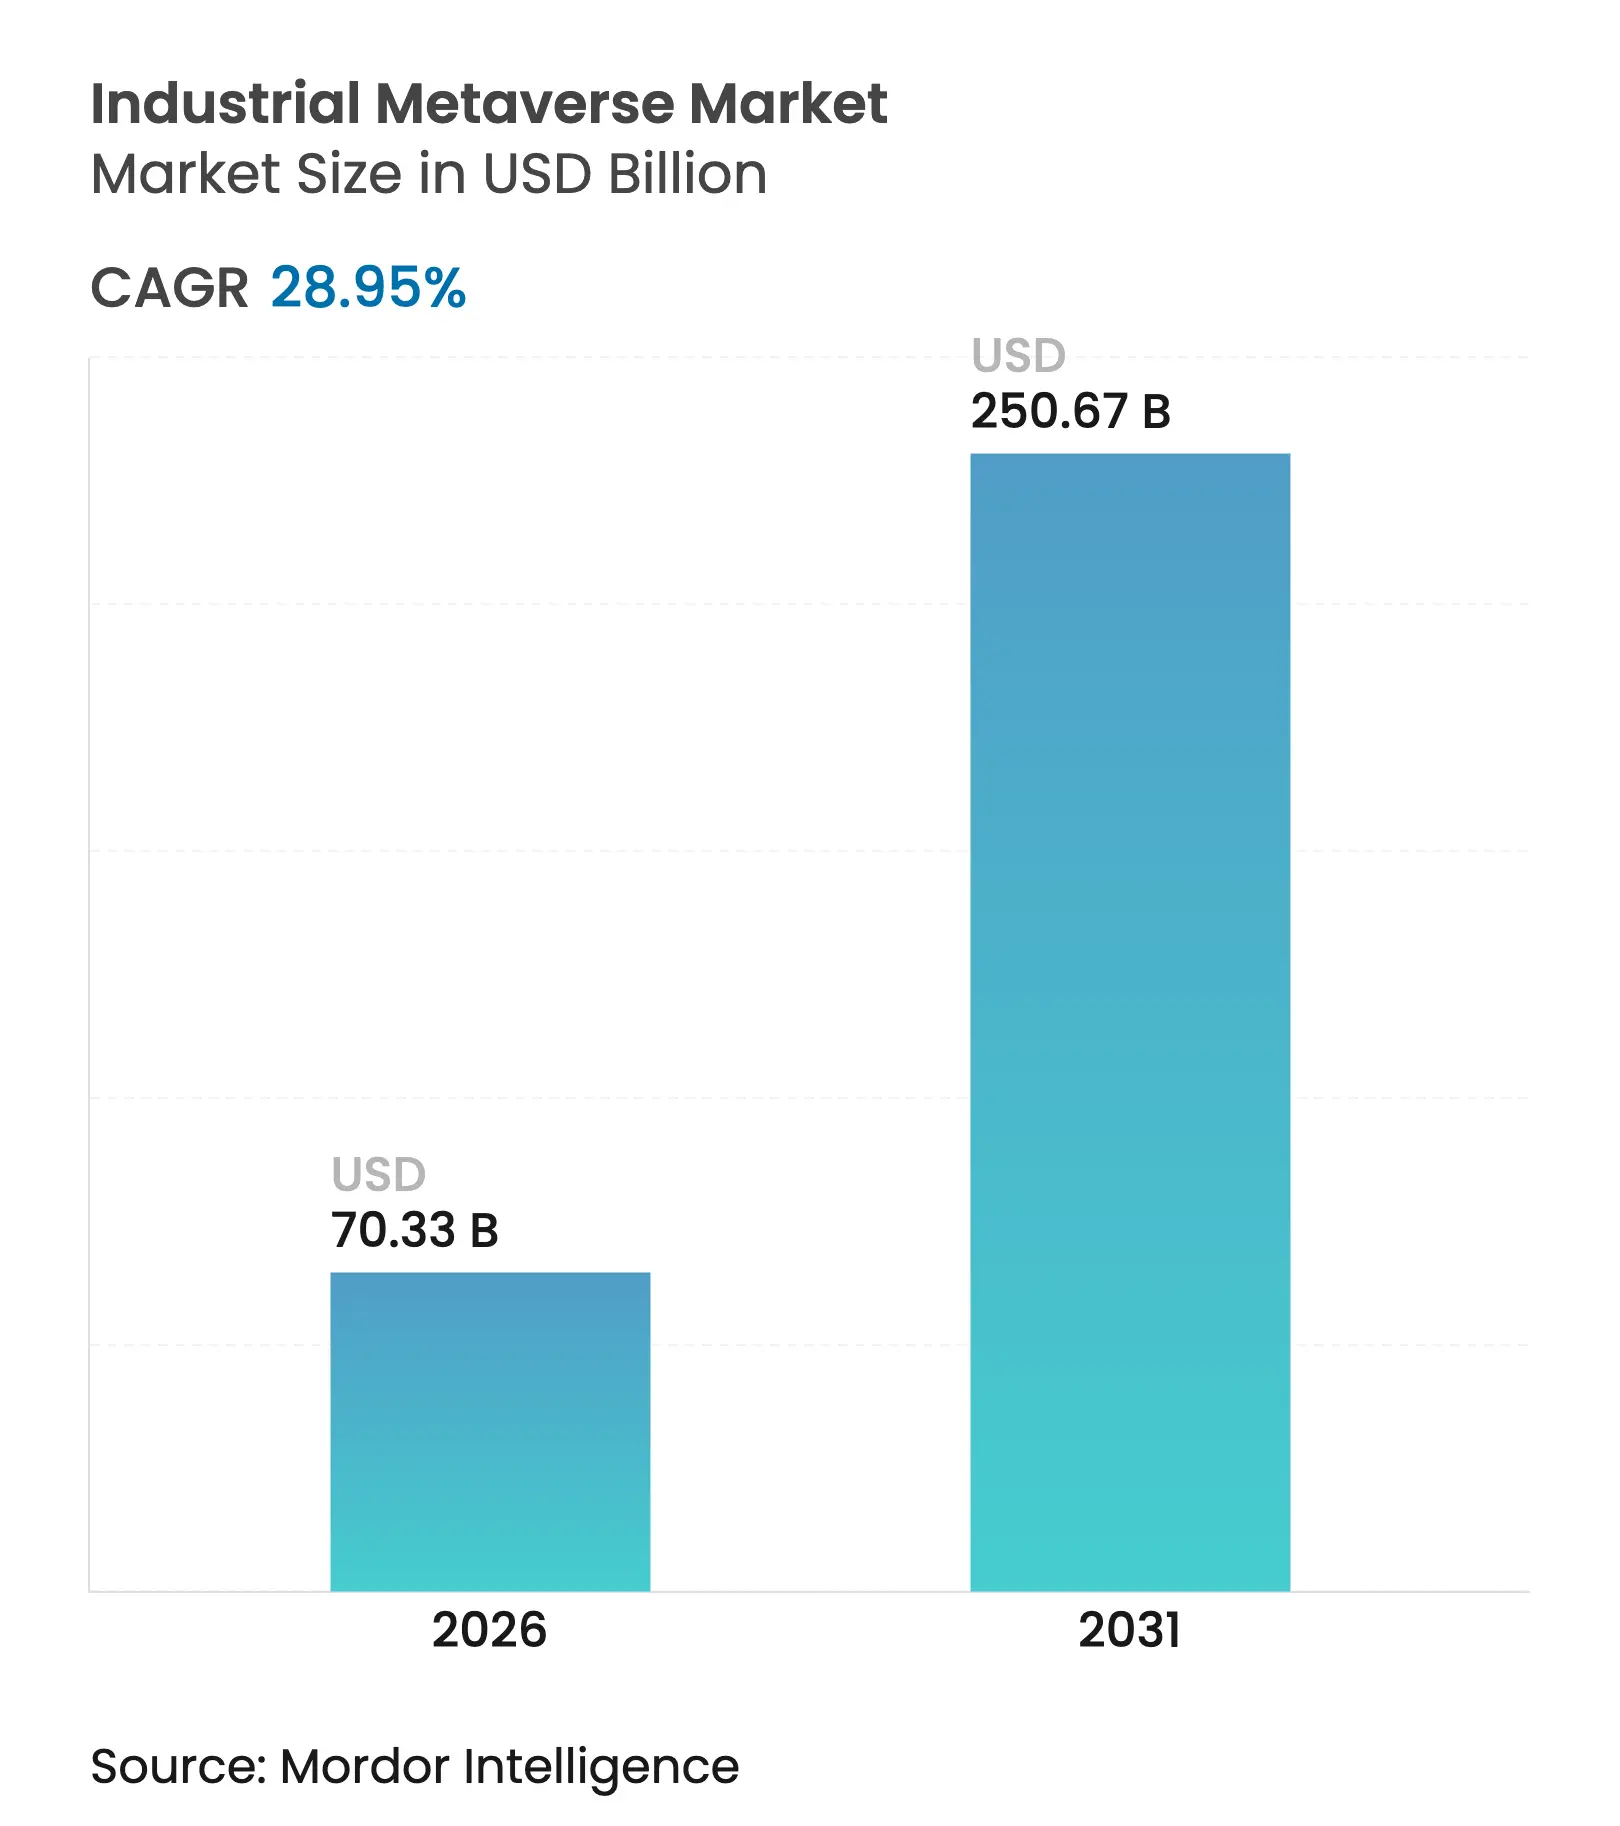
| Market Size (2026) | USD 70.33 Billion |
| Market Size (2031) | USD 250.67 Billion |
| Growth Rate (2026 - 2031) | 28.95 % CAGR |
| Fastest Growing Market | Asia Pacific |
| Largest Market | North America |
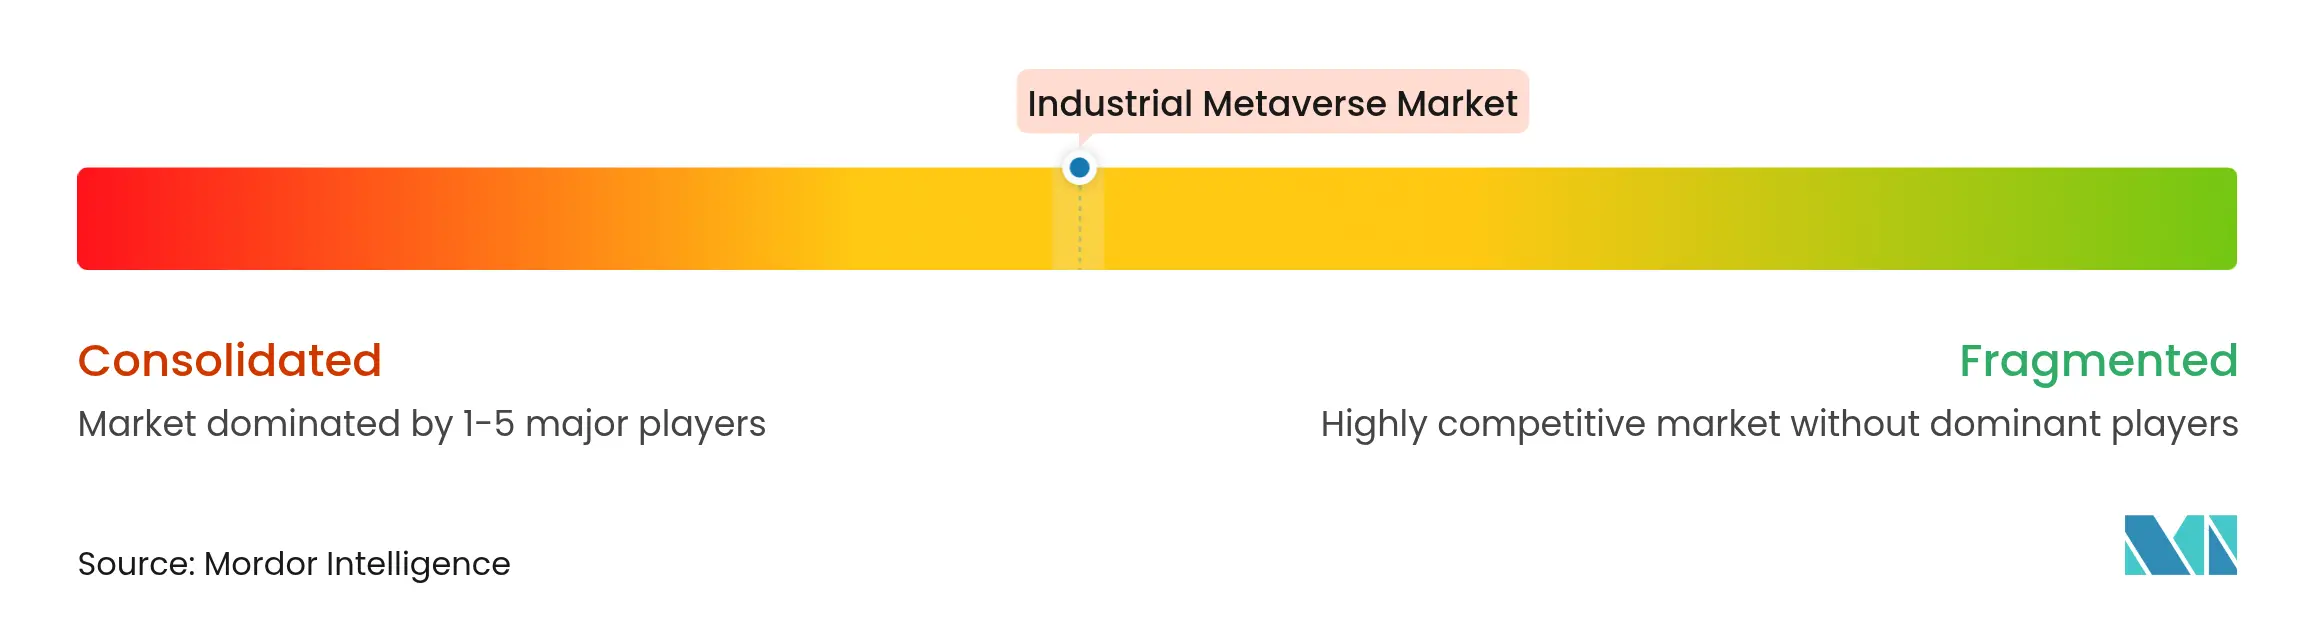
| Market Concentration | Medium |
Major Players *Disclaimer: Major Players sorted in no particular order. Image © Mordor Intelligence. Reuse requires attribution under CC BY 4.0. |

Industrial Metaverse Market Analysis by Mordor Intelligence
The Industrial Metaverse market size was valued at USD 54.53 billion in 2025 and estimated to grow from USD 70.33 billion in 2026 to reach USD 250.67 billion by 2031, at a CAGR of 28.95% during the forecast period (2026-2031). This rapid climb is propelled by a synchronized build-out of digital-twin platforms, extended-reality (XR) hardware, and industrial IoT networks that allow factories, energy grids, and logistics hubs to operate inside persistent, data-rich virtual environments. Early adopters highlight carbon-cutting virtual commissioning results—Schneider Electric recorded a 25% reduction in CO₂ while shortening product launch cycles—which reinforce the return-on-investment logic for immersive engineering workflows.
Demand is further lifted by mixed-reality training that narrows workforce skill gaps, private-5G rollouts enabling millisecond latency, and a growing ecosystem of edge-AI chipsets optimized for real-time simulation workloads. Software keeps the largest component foothold because digital twins and physics engines remain the metaverse’s functional core, yet service providers capture the fastest expansion track as enterprises rely on outside expertise for integration, cybersecurity hardening, and change management. Geographically, the Industrial Metaverse market witnesses North American revenue leadership, but APAC policy incentives, notably South Korea’s metaverse road map, give Asia the steepest growth slope.
Key Report Takeaways
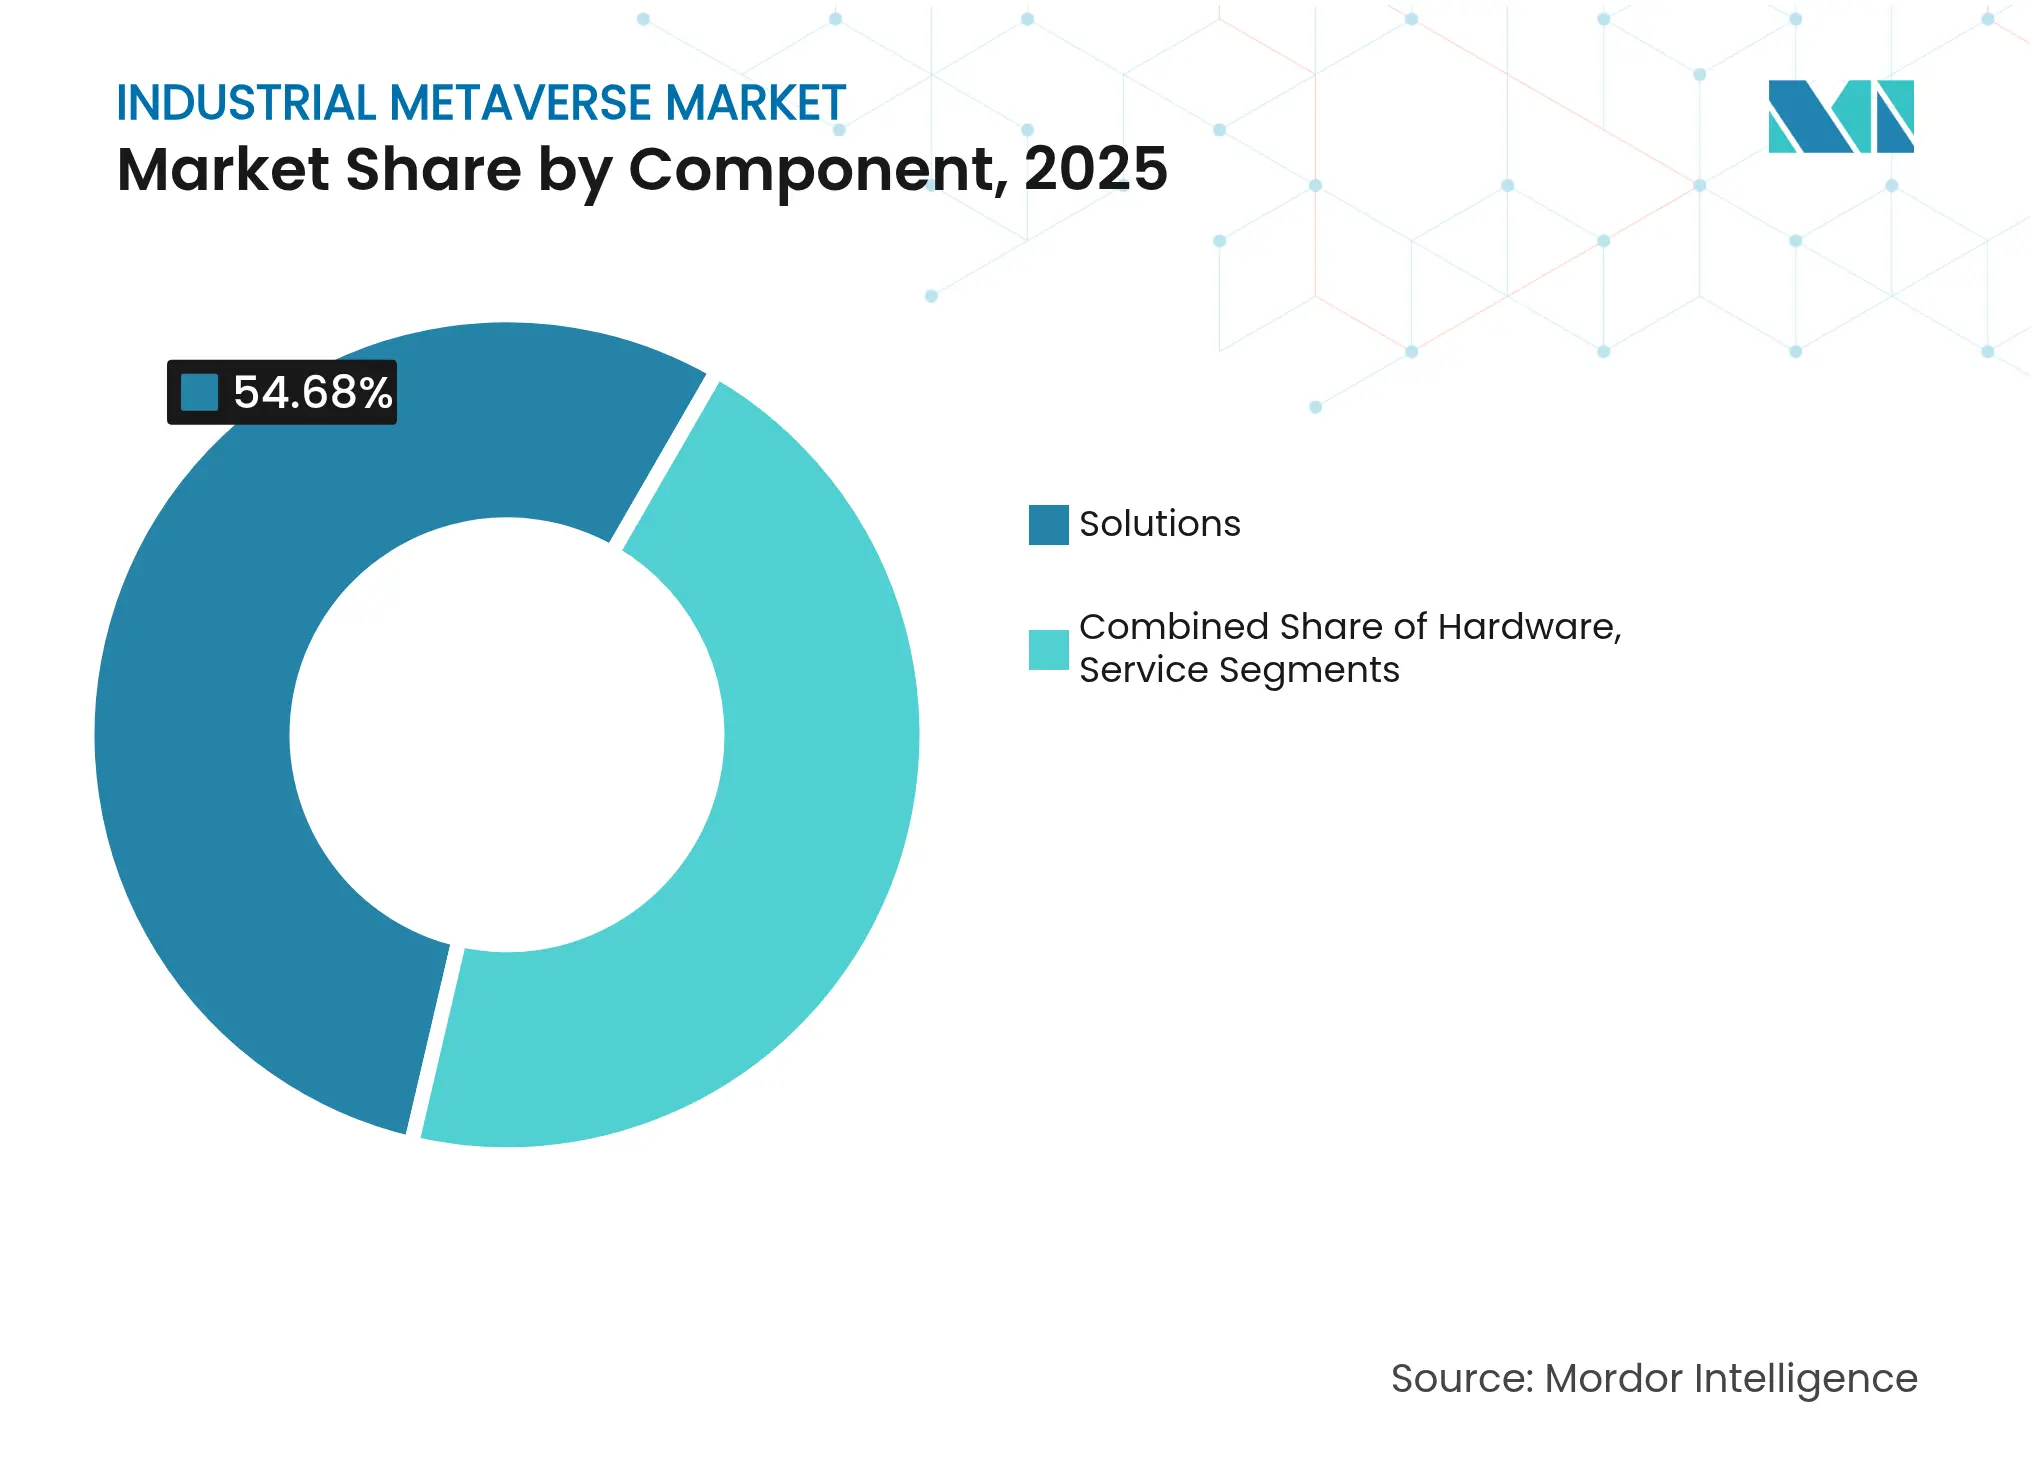
- By component, software dominated with 54.68% of the Industrial Metaverse market share in 2025; the services segment is forecast to accelerate at a 36.42% CAGR through 2031.
- By technology, digital twin & simulation captured 28.05% of the Industrial Metaverse market size in 2025, while mixed reality is advancing at a 38.1% CAGR to 2031.
- By end-user, manufacturing held 33.25% revenue share in 2025; energy & utilities segment is projected to expand at a 34.2% CAGR over 2026-2031.
- By geography, North America led with a 41.10% share of the Industrial Metaverse market size in 2025, whereas APAC is tracking a 33.9% CAGR
Note: Market size and forecast figures in this report are generated using Mordor Intelligence's proprietary estimation framework, updated with the latest available data and insights as of 2026.
Global Industrial Metaverse Market Trends and Insights
Drivers Impact Analysis
| Driver | (≈) % Impact on CAGR Forecast | Geographic Relevance | Impact Timeline |
|---|---|---|---|
Digital-twin-led predictive
maintenance
|
+8.2%
|
Global; strong in North America
and EU
|
Medium term (2-4 years)
|
Remote monitoring and
collaboration across distributed plants
| +6.8% | Global; Asia-Pacific hubs scaling fastest | Short term (≤ 2 years) |
IIoT + 5G + edge-AI integration
| +7.5% | North America and EU first movers | Medium term (2-4 years) |
Sustainability-focused virtual
commissioning
| +4.9% | EU regulations drive; NA following | Long term (≥ 4 years) |
Immersive AI upskilling for
industrial workforce
| +5.3% | Global; developed markets | Medium term (2-4 years) |
OEM monetization of virtual
product twins
| +3.8% | North America and EU OEM clusters | Long term (≥ 4 years) |
| Source: Mordor Intelligence | |||
Rising Adoption of Digital-Twin-Led Predictive Maintenance
Renault saved USD 595 million by pairing IoT sensors with digital twins that predict asset failure early, a blueprint now replicating across automotive, semiconductor, and chemical plants.[1] LG Innotek cut substrate warping analysis from 11 days to 3.6 hours, underscoring how virtual replicas compress RandD cycles. As machine-learning models continuously ingest live shop-floor data, manufacturers report 18% fewer workplace incidents after switching from textbook maintenance to immersive, VR-based safety drills. OEMs are also bundling post-sale “virtual twin subscriptions,” turning one-off equipment deals into recurring digital revenue streams.
Need for Remote Monitoring and Collaboration Across Distributed Plants
Industrial metaverse workspaces let engineers “walk through” remote facilities in real time. Siemens and Microsoft link Omniverse with Teams so multidisciplinary teams annotate the same digital factory regardless of continent. Verizon’s campus-wide 5G rollouts supply the sub-10 ms latency engineers need to share high-fidelity holograms, improving issue-resolution speed by 30% over standard video calls.[2] This real-time co-presence reduces travel-related emissions and accelerates root-cause analysis for complex machinery.
Integration of IIoT, 5G and Edge-AI Enabling Real-Time Metaverse Workloads
Private 5G spending is forecast to reach USD 6 billion by 2027, with 60% tagged to factory and energy projects where deterministic connectivity is mandatory. Qualcomm and Honeywell embed low-power AI cores at machinery edge nodes so vibration, thermal, and acoustic signals are processed locally, trimming cloud-backhaul latency and sharpening metaverse response loops.[3] Tesla’s Gigafactory networks illustrate how autonomous forklifts reference live digital-twin maps that update routes every second to avoid congestion.
Sustainability-Focused Virtual Commissioning to Cut CO₂ and Time-to-Market
Testing production lines in a virtual sandbox cut Schneider Electric’s commissioning emissions 25% and raised first-time-right rates. BASF drafts entire chemical plants in AR, running thousands of parameter permutations to select the lowest energy pathway before any steel is ordered. McKinsey finds product digital twins slice launch timelines by 50% and uplift quality 25%, benefits now factored into corporate ESG scorecards.
Restraints Impact Analysis
| Restraint | (≈) % Impact on CAGR Forecast | Geographic Relevance | Impact Timeline |
|---|---|---|---|
Lack of standards and
interoperability
|
-4.2%
|
Global; fragmentation acute in
emerging markets
|
Medium term (2-4 years)
|
High CAPEX for XR hardware and
private-5G
| -6.1% | Cost-sensitive regions, SME segment | Short term (≤ 2 years) |
Cyber-physical security risks
| -3.7% | Critical infrastructure everywhere | Long term (≥ 4 years) |
Cross-border data-sovereignty
uncertainty
| -2.8% | EU GDPR zones, China localization | Long term (≥ 4 years) |
| Source: Mordor Intelligence | |||
Lack of Standards and Interoperability Across Metaverse Platforms
The Industrial Metaverse market still lacks a lingua franca. IEEE’s Metaverse Standards Forum and NIST’s February 2025 call-to-action both urge common schemas for asset semantics, yet competing vendors often pursue proprietary data models. Siemens and Microsoft are aligning Digital Twin Definition Language with W3C Thing Description, but without consistent adoption, multi-vendor rollouts stay cumbersome. ISO/IEC 5927:2024 and ISO 23247 give safety and framework guidance, yet a full stack standard is years away.
High CAPEX for XR Hardware and Private-5G Infrastructure
First-generation industrial HMDs, such as Siemens-Sony’s USD 4,750 headset, stretch ROI calculations for smaller plants. Private-5G deployments can top USD 9 million for a single multi-site enterprise, causing many SMEs to delay investment. Neutral-host architectures and falling component prices are easing the burden, but budget constraints remain the biggest near-term headwind for the Industrial Metaverse market.
Segment Analysis
By Component: Services Accelerate Digital Transformation
The Services segment is on track to clock a 36.42% CAGR through 2031, reflecting boardroom recognition that immersive environments demand multidisciplinary expertise in cybersecurity, change management, and OT-IT integration. Capgemini’s Digital Continuity playbook bundles strategy, architecture, and field rollout into one service stack, shortening client payback windows. Accenture’s collaboration with Vitesco Technologies shows how implementation partners increasingly get paid on performance milestones tied to operational metrics rather than on billable hours alone.
Software nonetheless holds 54.68% Industrial Metaverse market share in 2025 because digital twin kernels, physics solvers, and simulation orchestration engines form the backbone of every deployment. Hardware demand scales at a steady clip as enterprises order advanced XR displays, photogrammetry rigs, and edge-AI gateways that secure and synchronize real-time model updates. Together, these spending patterns confirm that the Industrial Metaverse market size gains hinge on a balanced value chain where services grow fastest but software retains margin leadership.
Note: Segment shares of all individual segments available upon report purchase
By Technology: Mixed Reality Emerges as Growth Leader
Digital twin and simulation tools captured 28.05% of Industrial Metaverse market size in 2025, indicating enterprises have largely accepted virtual replicas as a must-have for modern operations. Mixed reality, however, races ahead at a 38.1% CAGR as HoloLens 2 and purpose-built headsets overlay live telemetry onto physical assets so technicians can fix faults hands-free. Siemens-Sony’s engineered optics reduce eye fatigue during eight-hour shifts, a prerequisite for scale on the factory floor.
Augmented reality fills in-line guidance gaps while virtual reality excels in safety drills for confined-space or high-heat scenarios. Complementing both, edge-AI inference chips from Qualcomm compress vision and Lidar feeds on device, guaranteeing frame-accurate overlays even inside noisy RF environments. This multi-technology stack validates that the Industrial Metaverse market will not be winner-take-all but a portfolio play where MR gains velocity yet digital twins stay the value anchor.
By End-User: Energy and Utilities Drive Fastest Adoption
Energy and utilities adopt at a 34.2% CAGR because grid operators confront growing volatility from renewables, aging transformers, and cyber-physical threats. IBM’s AI-fueled twin for a North American utility trimmed fault-location time by 25%, freeing maintenance crews for high-value work . Hydrogen-electrolyzer projects model thermal loads virtually to avoid costly overspecification, driving 5-15% capex savings and underlining why boardrooms now earmark digital twin spend in every green-energy budget.
Manufacturing retains a 33.25% revenue share through entrenched Industry 4.0 programs, notably in automotive, where Tesla streams live machine states into cell-assembly twins to safeguard takt-time. Healthcare, logistics, aerospace, and chemicals follow, experimenting with virtual prototyping and regulatory compliance simulations. These patterns underline that the Industrial Metaverse industry remains cross-vertical, but investment intensity correlates with asset criticality and sustainability imperatives.

Recognized by Experts. Trusted by Leaders.
A trusted intelligence partner to global decision-makers across 90+ countries.







Geography Analysis
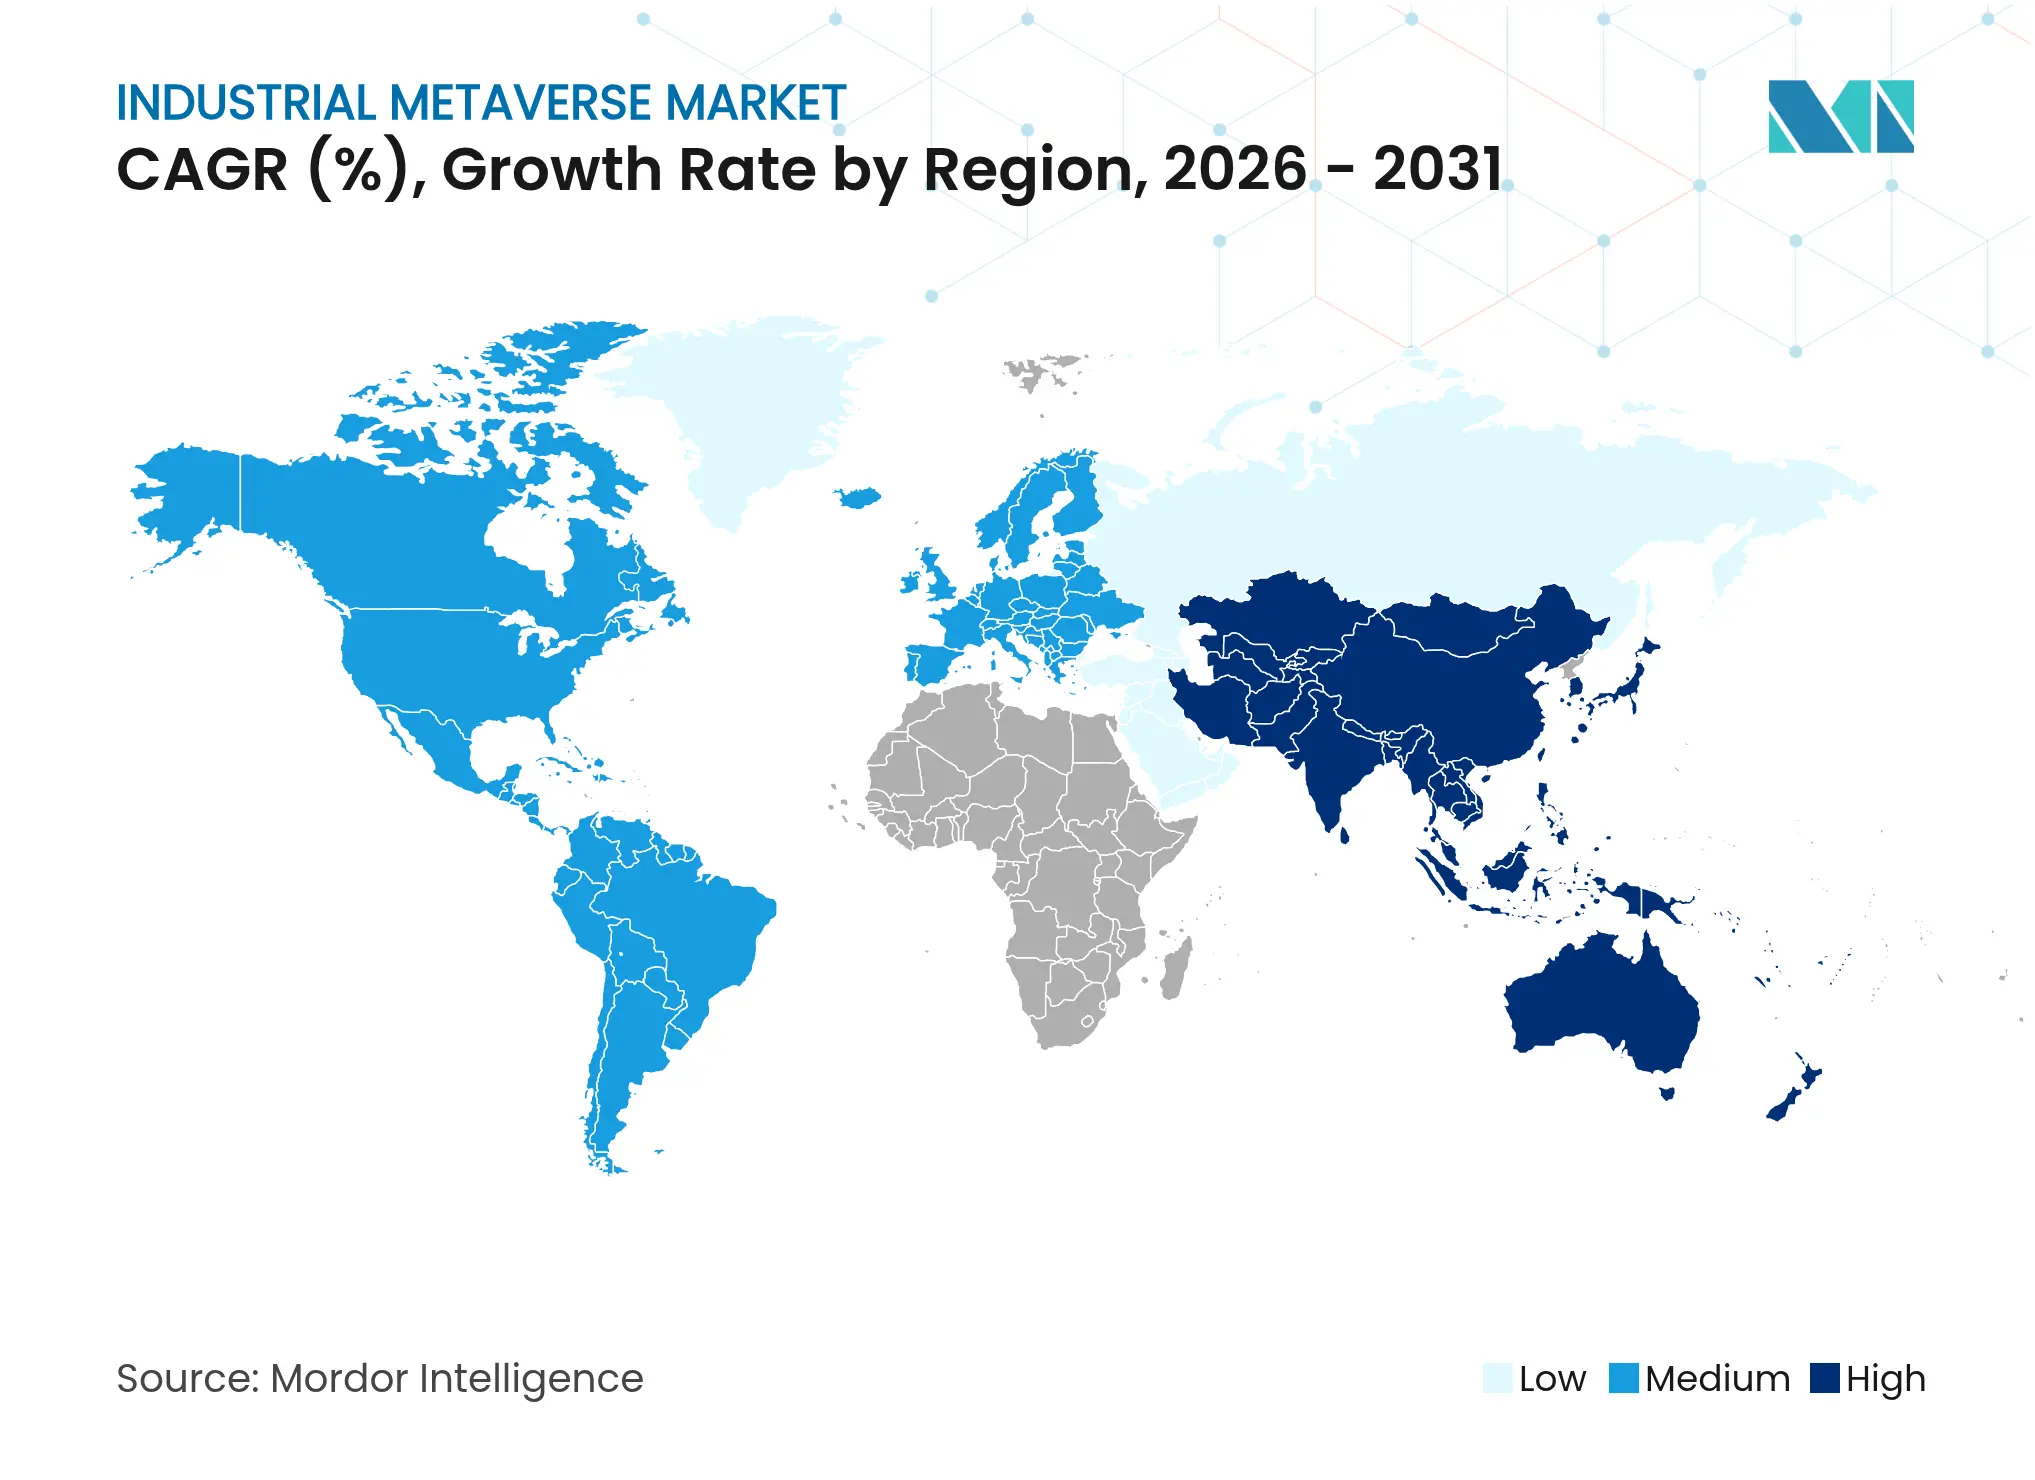
North America anchors 41.10% of 2025 revenue on the back of deep cloud penetration, abundant edge AI startups, and hyperscale-backed ecosystems. Federal tax incentives for smart-manufacturing gear, such as the CHIPS Act, further strengthen capital outlays. The region also fields the most pilot-to-production conversions, making it the benchmark sub-market for proof-of-value studies.
APAC, with a forecast 33.9% CAGR, grows fastest as South Korea invests USD 4.7 million to crack the global top-five metaverse league and China rolls out its Three-Year Action Plan that grants tax rebates to factory digital-twins built on domestic clouds. LG’s smart-factory unit lines up multi-industry orders that could tally USD 170 million by 2030, signaling broad private-sector appetite. India’s electronics clusters co-develop Omniverse-based twins with NVIDIA to leapfrog legacy automation stages.

Competitive Landscape
Market Concentration
Global revenue is distributed across a mix of integrated giants and niche innovators. NVIDIA’s USD 39.3 billion Q4 2025 turnover, driven by data-center GPUs that render colossal scene graphs, underscores the hardware gravity well around which the wider ecosystem orbits. Siemens and Microsoft leverage cross-licensing to weave automation stacks with cloud twins, while Unity and Dassault Systèmes concentrate on gaming-grade rendering engines and PLM integrations, respectively.
Consultancies such as Accenture and Capgemini parlay domain knowledge into turnkey deployments, often assuming outcome-based contracts tied to uptime or energy-saving metrics. Start-ups add competitive spice: MetAI, backed by NVIDIA, layers generative AI onto CAD pipelines to fabricate high-resolution digital twins in minutes rather than weeks. Standards bodies become indirect competitive arenas; vendors shaping IEEE or ISO schemas will capture mindshare when buyers insist on future-proofed architectures. Overall competitive intensity is moderate, with platform lock-in strategies counter-balanced by open-source consortia that lobby for vendor-neutral APIs.
Industrial Metaverse Industry Leaders

*Disclaimer: Major Players sorted in no particular order
Recent Industry Developments
- January 2025: KION Group partnered with NVIDIA and Accenture to debut AI-powered warehouse twins at CES 2025, optimizing robot fleet traffic flow and safety.
- November 2024: Rockwell Automation embedded NVIDIA Omniverse APIs into Emulate3D for advanced virtual commissioning in automotive and energy plants.
- August 2024: LG Innotek teamed with Ansys to shrink substrate warping analysis time from 11 days to 3.6 hours via high-fidelity twins.
- July 2024: Dassault Systèmes and Mistral AI integrated generative AI into 3DEXPERIENCE, accelerating virtual twin creation for aerospace and industrial customers.
Table of Contents for Industrial Metaverse Industry Report
1. INTRODUCTION
- 1.1 Study Assumptions and Market Definition
- 1.2 Scope of the Study
2. RESEARCH METHODOLOGY
3. EXECUTIVE SUMMARY
4. MARKET LANDSCAPE
- 4.1 Market Overview
- 4.2 Market Drivers
- 4.2.1 Rising adoption of digital-twin-led predictive maintenance
- 4.2.2 Need for remote monitoring and collaboration across distributed plants
- 4.2.3 Integration of IIoT, 5G and edge-AI enabling real-time metaverse workloads
- 4.2.4 Sustainability-focused virtual commissioning to cut CO? and time-to-market
- 4.2.5 Immersive AI-driven workforce upskilling narrowing industrial skills gap
- 4.2.6 OEM monetisation of virtual product twins as new aftermarket revenue
- 4.3 Market Restraints
- 4.3.1 Lack of standards and interoperability across metaverse platforms
- 4.3.2 High CAPEX for XR hardware and private-5G infrastructure
- 4.3.3 Cyber-physical security risks from semantic digital-twin hijacks
- 4.3.4 Cross-border data-sovereignty uncertainty in persistent virtual spaces
- 4.4 Supply-Chain Analysis
- 4.5 Regulatory Landscape
- 4.6 Technological Outlook
- 4.7 Porter's Five Forces
- 4.7.1 Bargaining Power of Suppliers
- 4.7.2 Bargaining Power of Buyers
- 4.7.3 Threat of New Entrants
- 4.7.4 Threat of Substitutes
- 4.7.5 Intensity of Competitive Rivalry
- 4.8 Macroeconomic Trends Impact
5. MARKET SIZE AND GROWTH FORECASTS
- 5.1 By Component
- 5.1.1 Software
- 5.1.2 Hardware
- 5.1.3 Services
- 5.2 By Technology
- 5.2.1 Augmented Reality (AR)
- 5.2.2 Virtual Reality (VR)
- 5.2.3 Mixed Reality (MR)
- 5.2.4 Digital Twin and Simulation
- 5.2.5 Industrial IoT and Edge-AI
- 5.3 By End-user
- 5.3.1 Manufacturing
- 5.3.2 Automotive
- 5.3.3 Energy and Utilities
- 5.3.4 Logistics and Transportation
- 5.3.5 Healthcare
- 5.3.6 Other End-users
- 5.4 By Geography
- 5.4.1 North America
- 5.4.1.1 United States
- 5.4.1.2 Canada
- 5.4.1.3 Mexico
- 5.4.2 South America
- 5.4.2.1 Brazil
- 5.4.2.2 Argentina
- 5.4.2.3 Rest of South America
- 5.4.3 Europe
- 5.4.3.1 United Kingdom
- 5.4.3.2 Germany
- 5.4.3.3 France
- 5.4.3.4 Italy
- 5.4.3.5 Spain
- 5.4.3.6 Russia
- 5.4.3.7 Rest of Europe
- 5.4.4 Asia-Pacific
- 5.4.4.1 China
- 5.4.4.2 Japan
- 5.4.4.3 India
- 5.4.4.4 South Korea
- 5.4.4.5 Australia and New Zealand
- 5.4.4.6 Rest of Asia-Pacific
- 5.4.5 Middle East and Africa
- 5.4.5.1 Middle East
- 5.4.5.1.1 Saudi Arabia
- 5.4.5.1.2 UAE
- 5.4.5.1.3 Turkey
- 5.4.5.1.4 Rest of Middle East
- 5.4.5.2 Africa
- 5.4.5.2.1 South Africa
- 5.4.5.2.2 Nigeria
- 5.4.5.2.3 Kenya
- 5.4.5.2.4 Rest of Africa
6. COMPETITIVE LANDSCAPE
- 6.1 Market Concentration
- 6.2 Strategic Moves
- 6.3 Market Share Analysis
- 6.4 Company Profiles (includes Global Overview, Market Overview, Core Segments, Financials, Strategy, Market Rank/Share, Products and Services, Recent Developments)
- 6.4.1 NVIDIA Corporation
- 6.4.2 Siemens AG
- 6.4.3 Microsoft Corporation
- 6.4.4 PTC Inc.
- 6.4.5 Dassault Systemes SE
- 6.4.6 Amazon Web Services (AWS)
- 6.4.7 IBM Corporation
- 6.4.8 Meta Platforms Inc.
- 6.4.9 HTC Corporation
- 6.4.10 ABB Ltd.
- 6.4.11 Unity Technologies
- 6.4.12 Schneider Electric SE
- 6.4.13 Bosch Rexroth AG
- 6.4.14 Rockwell Automation Inc.
- 6.4.15 Autodesk Inc.
- 6.4.16 GE Digital
- 6.4.17 Honeywell International Inc.
- 6.4.18 Qualcomm Technologies Inc.
- 6.4.19 ANSYS Inc.
- 6.4.20 Bentley Systems Inc.
7. MARKET OPPORTUNITIES AND FUTURE OUTLOOK
- 7.1 White-space and Unmet-Need Assessment
Global Industrial Metaverse Market Report Scope
Industrial metaverse is a blending of the digital and physical world that accelerates efficiency through engineering, manufacturing, and field service. The vision is for it to enable real-time collaboration, connectivity, and spatially-aware context within industrial environments.
The industrial metaverse market is segmented by component (software, hardware, services), by technology (AR, VR, MR), by end-user (automotive, healthcare, logistics & transportation, manufacturing, energy and utilities, other end-users), by geography (North America, Europe, Asia-Pacific, Latin America, Middle East and Africa). The market sizes and forecasts are provided in terms of value (USD) for all the above segments.
| By Component | Software | ||
| Hardware | |||
| Services | |||
| By Technology | Augmented Reality (AR) | ||
| Virtual Reality (VR) | |||
| Mixed Reality (MR) | |||
| Digital Twin and Simulation | |||
| Industrial IoT and Edge-AI | |||
| By End-user | Manufacturing | ||
| Automotive | |||
| Energy and Utilities | |||
| Logistics and Transportation | |||
| Healthcare | |||
| Other End-users | |||
| By Geography | North America | United States | |
| Canada | |||
| Mexico | |||
| South America | Brazil | ||
| Argentina | |||
| Rest of South America | |||
| Europe | United Kingdom | ||
| Germany | |||
| France | |||
| Italy | |||
| Spain | |||
| Russia | |||
| Rest of Europe | |||
| Asia-Pacific | China | ||
| Japan | |||
| India | |||
| South Korea | |||
| Australia and New Zealand | |||
| Rest of Asia-Pacific | |||
| Middle East and Africa | Middle East | Saudi Arabia | |
| UAE | |||
| Turkey | |||
| Rest of Middle East | |||
| Africa | South Africa | ||
| Nigeria | |||
| Kenya | |||
| Rest of Africa | |||
