
Industrial Machinery Market Size and Share
Industrial Machinery Market Analysis by Mordor Intelligence
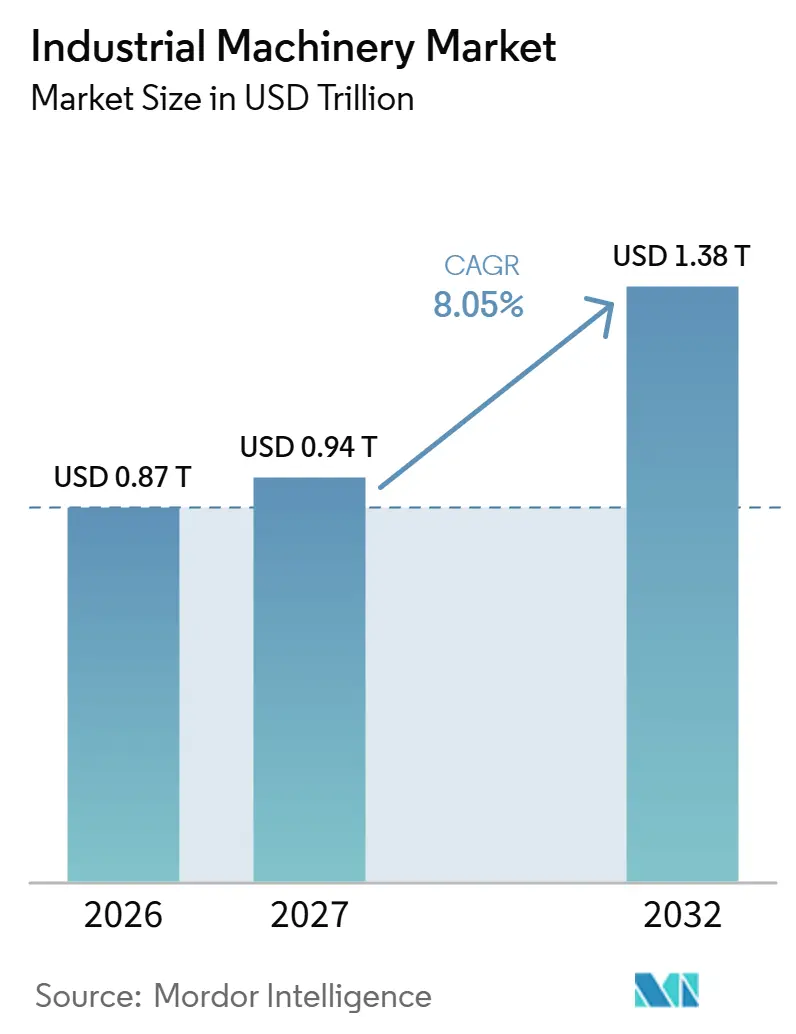
The industrial machinery market size is expected to increase from USD 0.87 trillion in 2026 to USD 0.94 trillion in 2027 and reach USD 1.38 trillion by 2032, growing at a CAGR of 8.05% over 2027-2032.
Factory modernization and U.S. reshoring support equipment investment around integrated CNC and automation capabilities. Connecting renewable generation adds a lifting-intensive construction channel in places such as Australia’s New South Wales, where building transmission for a renewable energy zone requires crane lifting of steel towers. Integration difficulty and material-cost pressure can limit conversion of these opportunities into usable production capacity and new-equipment commitments. Software partnerships, predictive maintenance and cross-brand fleet management can make operating support part of the machinery offer, helping suppliers compete on productive deployment as well as equipment delivery.
Key Report Takeaways
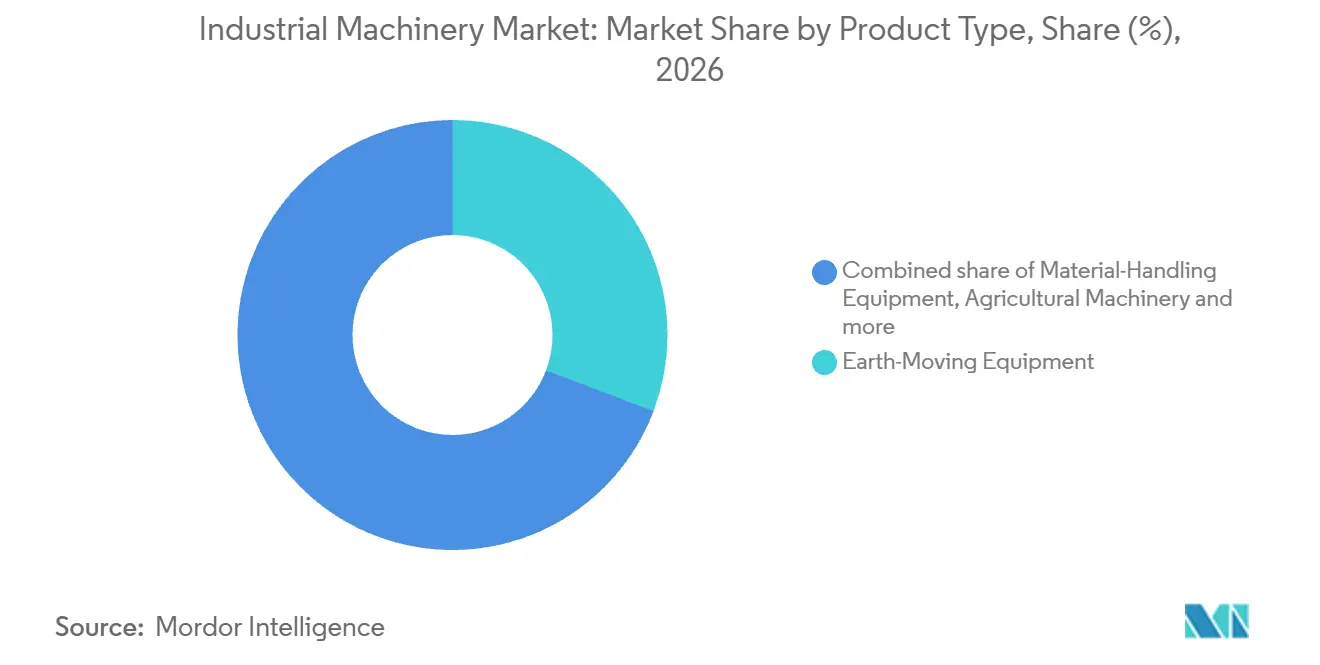
- By product type, earth-moving equipment held a 30.76% industrial machinery market share in 2026, while industrial robots and automation cells are forecast to grow fastest at a CAGR of 9.15% over 2027-2032.
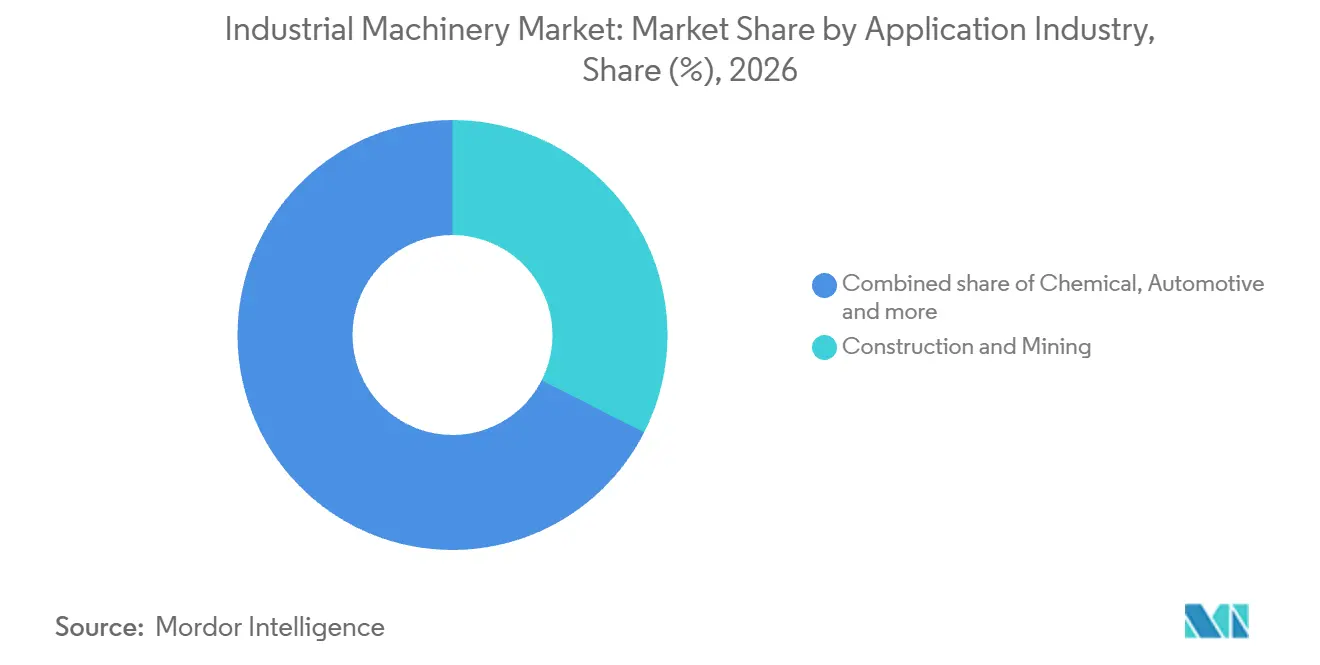
- Across application industries, construction and mining accounted for a 32.49% share of the industrial machinery market size in 2026, and the pharmaceuticals segment is projected to grow fastest at a CAGR of 10.35% over 2027-2032.
- Within end-user ownership, contract manufacturers are forecast to grow fastest at a 9.5% CAGR over 2027-2032, while original equipment manufacturers (OEMs) led with 37.83% of new-machinery spending in 2026.
- By automation level, semi-automated and CNC equipment held 45.75% of new-equipment spending in 2026, with fully automated and lights-out cells projected to grow fastest at a 9.3% CAGR over 2027-2032.
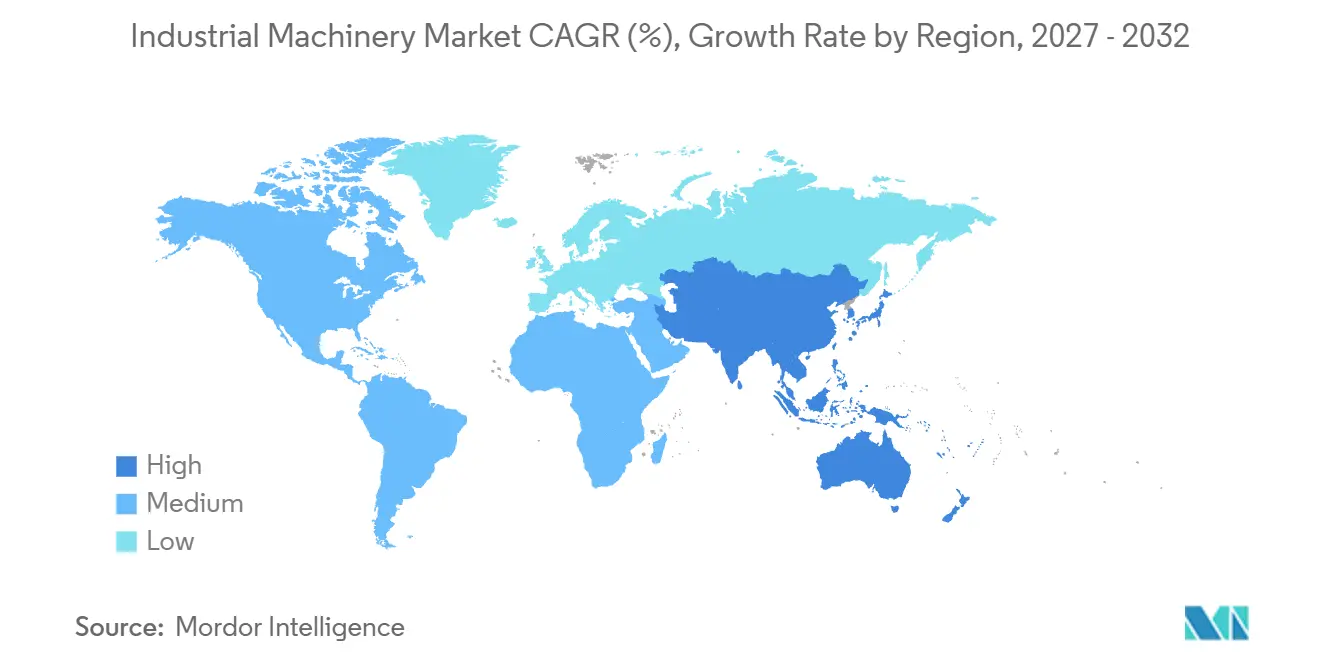
- Geographically, Asia-Pacific led with a 41.08% share in 2026 and is also forecast to grow fastest at a 9.5% CAGR over 2027-2032.
Note: Market numbers in this report are based on Mordor Intelligence's proprietary estimation framework, which combines nine months of actuals with Q4 projections for base year 2026.
Market Trends and Insights
Drivers Impact Analysis of Industrial Machinery Market*
| Driver | (~) % Impact on CAGR Forecast | Geographic Relevance | Impact Timeline |
|---|---|---|---|
| Accelerating Adoption of Industry 4.0-Ready Retrofits in Brownfield Facilities | +2.7% | Europe, United States and South Korea | Medium term (2-4 years) |
| Construction Super-Cycle Fueled by Clean-Energy and Resilient Infrastructure Spend | +3% | Australia, Europe and North America | Long term (≥ 4 years) |
| Shift Toward Outcome-Based, Predictive-Maintenance Service Contracts | +1.6% | Japan, China and the United States | Short term (≤ 2 years) |
| Reshoring Drives Demand for Flexible, Multi-Process CNC Platforms | +2.1% | United States manufacturing centers | Medium term (2-4 years) |
| Rapid Uptake of Compact, Zero-Emission Machinery for Urban Retrofit Projects | +0.9% | Norway and Germany | Short term (≤ 2 years) |
| Defense and Critical-Minerals CAPEX Elevates Heavy-Duty Equipment Orders | +0.6% | United States military locations | Long term (≥ 4 years) |
| Source: Mordor Intelligence | |||
Accelerating Adoption of Industry 4.0-Ready Retrofits in Brownfield Facilities
A plant that already operates can modernize in place, making a retrofit a potential requirement for connected automated equipment within an existing building. In May 2025, HD Hyundai Construction Equipment completed modernization of its own Ulsan plant in South Korea.[1] The upgrade integrated real-time product tracking with welding robots, vision sensors, automated guided vehicles and AI-based inspection systems. This combination links production-line automation with material movement and quality control inside an established manufacturing operation. For a machinery supplier, that creates a potential equipment requirement spanning several connected production functions within one modernization program. A supplier can expand its role within the same factory by addressing the interfaces between production, material handling and inspection.
Construction Super-Cycle Fueled by Clean-Energy and Resilient Infrastructure Spend
Connecting renewable generation to the grid requires transmission towers, and raising them is lifting work. The Central-West Orana Renewable Energy Zone transmission build in New South Wales, Australia, began construction in June 2025 to connect renewable generation. EnergyCo reported that its first 70-meter, 500-kilovolt transmission tower was raised by crane on April 2, 2026, after pre-assembly by network operator ACEREZ. Global government spending on power generation and grid infrastructure reached USD 135 billion in 2025, more than double its 2015 level, according to the International Energy Agency. For crane suppliers, lifting transmission towers connects equipment demand to the construction phase of power-network investment.
Shift Toward Outcome-Based, Predictive-Maintenance Service Contracts
Predictive maintenance can strengthen a machinery investment when operating data helps the owner anticipate component deterioration. Komatsu Ltd. reported 57 aggregate contract lines for large-press predictive maintenance in fiscal year 2025. As of May 18, 2026, Komatsu Industries Corp. offered an AI-based system for large servo presses that used drive-component deterioration data to support planned replacement before failure. This gives the operator a basis for linking maintenance intervention to the condition of equipment components. In 2025, ABB described its Motors and Drives service agreements as shifting maintenance toward outcome-based performance, with predictive maintenance embedded in many service offerings. Component-replacement planning becomes a concrete part of the machinery offer when suppliers pair equipment with lifecycle support.
Reshoring Drives Demand for Flexible, Multi-Process CNC Platforms
Where production returns to the United States, machines that combine several processing steps become more relevant to the plant. In the 2026 USA Reshoring Survey, 36% of OEM respondents had reshored or were actively engaged in additional reshoring, up from 29% in 2025. MMG Extrusions’ Franklin, New Hampshire, expansion culminated in 2025 to meet demand including manufacturers reshoring extrusion operations. Its machining investments included 2 fully automated 5-axis CNC centers designed for single-step processing of extruded aluminum components. Combining processing steps can make a domestic production expansion more useful to customers seeking finished components from an integrated producer. The resulting equipment opportunity centers on the depth of processing available locally, alongside the amount of capacity added.
Restraints Impact Analysis of Industrial Machinery Market*
| Restraint | (~) % Impact on CAGR Forecast | Geographic Relevance | Impact Timeline |
|---|---|---|---|
| High Capital-Expenditure and Long Payback Horizons for Advanced Automation | -1.2% | Manufacturing centers across Canada | Medium term (2-4 years) |
| Volatile Raw-Material Pricing Compresses OEM Margins and Buyer Budgets | -0.8% | North America, Europe and Asia-Pacific | Short term (≤ 2 years) |
| Acute Skilled-Labor Shortage for Smart-Machine Programming and Service | -0.6% | United States and Canada | Long term (≥ 4 years) |
| Cyber-Security Vulnerabilities in Connected, OT-IT Converged Equipment | -0.3% | Manufacturing centers across Canada | Short term (≤ 2 years) |
| Source: Mordor Intelligence | |||
High Capital-Expenditure and Long Payback Horizons for Advanced Automation
An advanced-automation purchase can require a broader investment decision than approving the machine’s initial price. In 2026, 33% of surveyed Canadian manufacturing executives and leaders cited cost as a reason for not investing in technology. In the same survey, 40% cited difficulties integrating advanced technologies into existing systems as a challenge to technology investment. These findings put affordability and implementation within the same investment decision, although each presents a distinct hurdle. A lower equipment price alone would not resolve that systems problem. For a buyer unable to integrate a new machine, committed capital cannot deliver usable production capacity, making postponement commercially defensible.
Volatile Raw-Material Pricing Compresses OEM Margins and Buyer Budgets
Higher material costs leave machinery producers choosing between absorbing production expenses and recovering them through selling prices. Deere & Company reported USD 126 million in higher pretax production costs in the third quarter of fiscal 2026 than a year earlier, primarily from higher material costs. The quarter ended August 2, 2026, and the reported burden covered the company’s consolidated operations. If an equipment producer absorbs such increases, less revenue remains available to cover other costs and earnings. Passing them into new-machine prices can instead increase the capital required from buyers. The remaining constraint is the trade-off between protecting production economics and preserving equipment affordability.
*Our forecasts treat driver/restraint impacts as directional, not additive. The impact forecasts reflect baseline growth, mix effects, and variable interactions.
Industrial Machinery Market Segment Analysis
By Product Type:
Earth-Moving Demand and Robot Deployment ScaleEarth-moving equipment accounted for a 30.76% share of the industrial machinery market size in 2026. In Europe, heavy-equipment sales grew 2% in 2025, while crawler excavators, the highest-volume product in that equipment group, recorded 4% growth. Within Europe, crawler excavators grew twice as fast as the heavy-equipment total in 2025. For suppliers serving European earth-moving customers, crawler excavators therefore represented a firmer source of demand than the broader heavy-equipment growth alone suggests.
Industrial robots and automation cells are the fastest-growing segment, with a 9.15% CAGR forecast for 2027-2032. Worldwide industrial-robot installations reached 603,000 units in 2025, up 11% year over year.[2] The global operational stock of industrial robots also reached 5.08 million units in 2025. Annual deployments at that scale can make repeatable cell designs commercially attractive because engineering investment can be spread across more equipment installations. The large operating stock adds a potential replacement and expansion channel for complete machines alongside new automation projects.

By Application Industry:
Mining Scale and Pharmaceutical InvestmentConstruction and mining represented a 32.49% industrial machinery market share in 2026. Mining illustrates the largest segment’s equipment scale, with Komatsu commissioning its 1,000th autonomous ultra-class haul truck worldwide in April 2026. The 290-metric-ton-payload milestone truck was deployed at Barrick’s Nevada Gold Mines operation in the United States. The combination of high payload and autonomous operation makes the individual machine part of a mine’s production system, giving equipment capability a direct operating role. That creates a substantial equipment requirement at the operator level, where haulage capacity and automation can be considered within the same deployment.
The pharmaceuticals industry is the fastest-growing segment, with a 10.35% CAGR forecast for 2027-2032. PMMI reported that 56% of surveyed pharmaceutical manufacturing end users definitely intended to purchase packaging or processing machinery in 2026. GEA also identified pharmaceuticals among the main customer-industry growth drivers of its global order intake in 2025. Food and beverage presents another automation application, illustrated by U.S. food-industry industrial-robot installations rising 30% to approximately 3,000 in 2025. Serving pharmaceutical projects and food-plant automation can spread a supplier’s exposure across buyers with different equipment applications.
By End-User Ownership:
OEM Programs and Contract Manufacturing ExpansionOriginal equipment manufacturers (OEMs) led end-user ownership with a 37.83% share of new-machinery spending in 2026. BMW Group completed installation and functional checks of manufacturing equipment in the new body shop and assembly line at its Munich plant in December 2025. An OEM program of this kind can link equipment demand across multiple production stages, making the readiness of the combined production system commercially important. A linked production program is the supplier’s unit of opportunity, which favors equipment offers covering several stages of the plant’s production.
Contract manufacturers are the fastest-growing segment, with a 9.5% CAGR forecast for 2027-2032. Fabrinet, which provides manufacturing services to OEMs, invested in equipment to expand its manufacturing facilities in Thailand during fiscal year 2026. Rental and leasing companies demonstrate a fleet-ownership channel, with United Rentals, Inc. reporting USD 4.19 billion in gross rental capital expenditures in 2025. Government and municipalities provide a public-fleet channel, illustrated by Oslo’s adopted 2026 Climate Budget for zero-emission machinery, with specialized machinery replacement assigned to a later stage. For machinery suppliers, Fabrinet’s expansion illustrates how serving OEM production programs can generate equipment investment at a manufacturing-services provider’s own facilities.
By Automation Level:
CNC Scale and Overnight AutomationSemi-automated and CNC equipment was the largest segment by automation level, holding 45.75% of new-equipment spending in 2026. Yamazaki Mazak Corporation completed its 40,000th machine-tool production milestone at its Florence, Kentucky, factory in August 2025. That cumulative total stretches back to the factory’s 1974 start and covers machine tools including machining centers and turning centers. Production of both machining and turning centers gives buyers a supplier with capabilities across related processing operations. That production history creates a potential replacement channel when owners of earlier machines renew their machining or turning equipment.
Fully automated and lights-out cells are the fastest-growing segment, with a 9.3% CAGR forecast for 2027-2032. A May 2026 report described ABA-PGT’s Vernon, Connecticut, plant operating injection molding machines unattended overnight. A small crew arrived each morning to review output and make adjustments. This arrangement can extend machine operation into unstaffed hours while concentrating human review at the next production handover. For buyers, the operating case turns on productive unattended hours and the resources needed to check and adjust the night’s output.
Geography Analysis
Asia-Pacific Industrial Machinery Market
Asia-Pacific held a 41.08% share of the industrial machinery market size in 2026 and is the fastest-growing region, with a 9.5% CAGR forecast for 2027-2032. Within this regional base, the International Federation of Robotics reported 457,315 robot shipments in Asia in 2025, up 13.3% year over year. On October 23, 2025, KUKA and Vietnamese system integrator Automech signed a contract for 60 KUKA robots to automate stamping-line operations in Vietnam. The contract gives the region a specific equipment-and-integration channel alongside its broader robot-shipment flow. For suppliers, pairing robot delivery with local integration capability can turn a regional automation opportunity into a defined industrial-production project.
U.S. agricultural tractor sales fell 16.4% year over year in September 2026, while European construction-equipment sales rose 4.6% in 2025 after declining 19% in 2024. On March 24, 2026, Liebherr-Export and official Bulgarian supplier Alki-L delivered a 300-metric-ton-class R 9350 E electric face-shovel excavator to Assarel-Medet at Bulgaria’s Assarel copper mine. In March 2026, Hitachi Construction Machinery’s authorized dealer West Balkans Machinery delivered a 250-metric-ton EX2600-7E electric ultra-large excavator to Rudnik uglja Pljevlja for coal extraction at northern Montenegro’s Pljevlja mine. The Balkan deliveries add a dealer-mediated mining channel to Europe’s construction-equipment recovery, while U.S. tractor suppliers face a monthly sales decline.
In South America, Brazil’s machinery and equipment industry reported 8.4% domestic-market revenue growth in 2025. Extractive industries, agribusiness and infrastructure works supported that growth. Chile’s Codelco recorded a January 2025 award covering 5 hydraulic shovels from Komatsu Chile S.A. for its Salvador Division. Within the Middle East and Africa, HD Hyundai Construction Equipment secured orders for 333 construction-equipment units from Middle Eastern countries including Saudi Arabia, the UAE and Qatar in January and February 2025. South Africa’s MYSOL Holdings expanded its chrome-mining fleet with 30 Volvo articulated haulers and 10 Volvo excavators delivered in February 2025 through its collaboration with Volvo Construction Equipment and dealer Babcock.
Regulatory Framework and Outlook
The comparison covers selected jurisdictions from the perspective of new-machinery suppliers serving industrial workplaces, with the United Kingdom discussion focused on Great Britain. Great Britain’s machinery-supply framework comes under Health and Safety Executive enforcement for workplace machinery, while the Office for Product Safety and Standards may also enforce it. China’s recommended GB/T 20850-2025 provides guidance on applying machinery-safety standards and took effect on October 1, 2025. The commercial comparison distinguishes established supply-framework enforcement from the product-preparation work associated with a scheduled safety-specification transition.
Regulatory Table of Industrial Machinery Market
| Decision factor | United Kingdom | China |
|---|---|---|
| Primary authority | Health and Safety Executive; Office for Product Safety and Standards may also enforce in Great Britain | Ministry of Industry and Information Technology, lead department for GB 48002-2026 |
| Key instruments or direction | Supply of Machinery (Safety) Regulations 2008 in Great Britain | Recommended GB/T 20850-2025; GB 48002-2026 scheduled for February 1, 2027 |
| Commercial effect | Workplace-machinery supply within the Great Britain enforcement framework | Earth-moving product preparation before the 2027 safety specification applies |
| Current policy attractiveness | High | Medium |
| Future direction of policy attractiveness | No change | Hardening |
| Source: Mordor Intelligence | ||
In February 2026, the UK Government said it intended to continue CE recognition for machinery in Great Britain and update the 2008 regulations with measures similar to the EU’s. This supports continuity for suppliers using the CE route while retaining machinery-safety enforcement. China’s GB 48002-2026 earth-moving machinery safety technical specification is scheduled to apply on February 1, 2027. Suppliers of earth-moving machinery in China have a fixed date against which to review product configurations, and recommended GB/T 20850-2025 provides machinery-safety guidance more generally.
Value Chain Stages
The comparison follows how supplier earnings move from machinery production through distribution, installation and operating support. KION Group AG combines industrial-truck development and manufacturing with sales and service, while its Dematic business develops and installs integrated supply-chain technology and software. Komatsu Ltd. completed the transfer of 6 former Core Machinery dealerships in Arizona and California to Komatsu-owned dealers on June 9, 2025. These roles show how a producer can participate in several customer handoffs while an integrator earns from bringing equipment and software together.
Value Chain Analysis Table of Industrial Machinery Market
| Primary activity | Key participants | Value capture | Bottleneck | Resilience response |
|---|---|---|---|---|
| Machinery development and manufacturing | Industrial-truck producers such as KION Group AG | Equipment sales | Coordinating product design and manufacturing | Standardize repeatable machine configurations |
| Equipment distribution | Producers with dealer networks such as Komatsu Ltd. | Dealer equipment sales | Local sales and service coverage | Coordinate dealer access with field support |
| System integration and installation | Supply-chain system integrators such as Dematic | System integration and software sales | Aligning equipment and software at installation | Phase integration and validate interfaces |
| Parts fulfillment and after-sales support | Parts and service providers such as Hitachi Construction Machinery Co., Ltd. | Parts sales and service fees | Parts availability near operating equipment | Coordinate regional stocking and service dispatch |
| Source: Mordor Intelligence | ||||
Hitachi Construction Machinery Co., Ltd. described parts and service as a core earnings pillar in June 2026. In September 2025, AGCO Corporation broke ground on its Europe and Middle East parts distribution center in Amnéville, France, and scheduled opening by the end of 2026. Producer-owned distribution and regional parts infrastructure can extend the commercial relationship from delivering a machine to supporting its working life.
Competitive Landscape
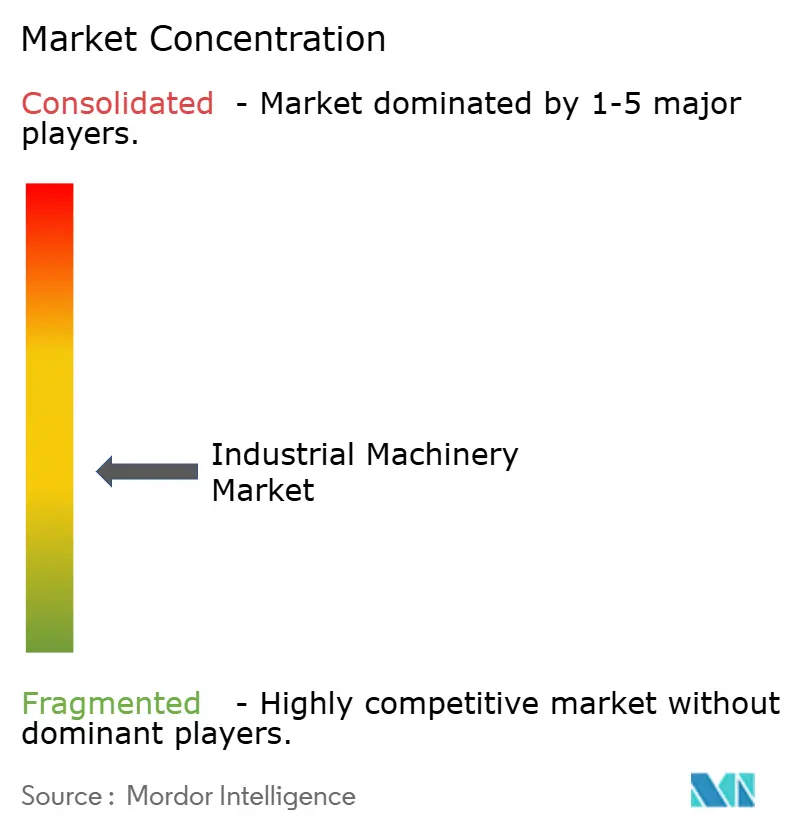
Competition spans integrated machinery producers and technology specialists, with equipment supply, software and service providing distinct bases for differentiation. Caterpillar Inc. supplies construction equipment through a global dealer network, while Komatsu Ltd. produces construction, mining and utility equipment. Deere & Company’s Construction & Forestry net sales rose 18% year over year to USD 3.62 billion in Q3 2026, while Hitachi Construction Machinery Co., Ltd. supplies excavators and wheeled loaders. CNH Industrial N.V.’s Construction net sales rose 12% year over year to USD 866 million in Q2 2026, including shipments delayed from Q1. Caterpillar’s Construction Industries Q2 2026 sales rose 35% to USD 8.35 billion, mainly on higher volume and prices, while Komatsu’s construction, mining and utility equipment sales grew in April 2025-March 2026 despite lower volume, mainly on prices.
In September 2025, Komatsu and Applied Intuition agreed to co-develop a software-defined vehicle and autonomy platform for Komatsu’s next-generation mining equipment.[3] The agreement called for combining Applied Intuition’s vehicle operating systems, autonomy stacks and tooling with Komatsu’s mining-equipment expertise. The agreement gives a technology specialist a route into mining machinery through an equipment manufacturer’s system architecture, with commercialization dependent on completing development and deployment. The equipment manufacturer can retain the machine relationship while accessing specialized software capability, giving the partnership a different entry mechanism from competing as a complete truck producer.
Hitachi Construction Machinery began providing LANDCROS Connect in April 2025 for central management of customer machines, including equipment made by other manufacturers. That design gives mixed-brand operators a potential basis for centralizing machine management without replacing their existing machines. Deere’s acquisition brings a mixed-fleet technology business under an equipment manufacturer’s ownership. In February 2026, Deere acquired Tenna LLC, a U.S. construction technology company offering mixed-fleet equipment operations and asset-tracking solutions, and assigned it to Construction & Forestry. The competitive opening is control of the operator’s working system, where cross-brand management can extend a supplier’s reach beyond its own installed machinery.
Industrial Machinery Industry Leaders
-
Caterpillar Inc.
-
Komatsu Ltd.
-
Deere & Company
-
Hitachi Construction Machinery Co., Ltd.
-
CNH Industrial N.V.
- *Disclaimer: Major Players sorted in no particular order
Industrial Machinery Market Companies Covered in this Report
- Caterpillar Inc.
- Komatsu Ltd.
- Deere & Company
- Hitachi Construction Machinery Co., Ltd.
- CNH Industrial N.V.
- Volvo Construction Equipment AB
- Liebherr-International AG
- Sandvik AB
- HD Construction Equipment Co., Ltd.
- J.C. Bamford Excavators Ltd. (JCB)
- Terex Corporation
- Manitowoc Company, Inc.
- Astec Industries, Inc.
- Illinois Tool Works Inc.
- Lincoln Electric Holdings, Inc.
- AGCO Corporation
- Alamo Group Inc.
- Wacker Neuson SE
- SANY Heavy Industry Co., Ltd.
- XCMG Construction Machinery Co., Ltd.
- Zoomlion Heavy Industry Science & Technology Co., Ltd.
- Kubota Corporation
- Yanmar Holdings Co., Ltd.
- Atlas Copco AB
- ABB Ltd.
Key Opportunities for Market Participants
The opportunities compare machinery investments for eligible Egyptian industrial buyers, distinguishing production-line renewal, added local processing and new domestic production. On February 27, 2026, Egypt’s Industrial Development Authority announced priority-sector financing for machinery, equipment and production lines at 15% annually for 5 years. Additional reductions of up to 2% were conditional on higher local value added or newly established industries with high import bills. The supplier opportunity is to match complete-equipment proposals to these distinct production objectives.
Market Opportunities Table of Industrial Machinery Market
| Opportunity | Why now | Buyer / lead segment | Recommended play | Main barrier | Likely beneficiaries |
|---|---|---|---|---|---|
| Production-line modernization | The February 2026 financing announcement included production lines | Existing manufacturers in priority industrial sectors | Align equipment delivery and acceptance with the production ramp-up | Servicing financing before new capacity generates returns | Complete-line machinery suppliers and eligible manufacturers |
| Additional local processing | The 2026 terms linked an additional financing reduction to higher local value added | Priority-sector manufacturers adding local value | Supply machinery that brings an additional processing step into Egypt | Capital committed across a more complex processing sequence | Machine builders and local processing businesses |
| Import-substitution production capacity | The 2026 terms also covered qualifying newly established industries with high import bills | Newly established priority-sector industrial businesses | Develop complete-machine packages for new domestic production facilities | Commissioning and sustaining a new manufacturing operation | Production-equipment suppliers and new domestic manufacturers |
| Source: Mordor Intelligence | |||||
On May 9, 2026, the authority reported coverage of 9 major sectors and more than 70 industrial activities, with gradual sector expansion underway at that date. The central opening is machinery for eligible production projects whose output can justify the financing burden. Linking equipment acceptance to usable production gives the supplier a concrete way to address commissioning risk within that investment case.
Recent Industry Developments in Industrial Machinery Market
- Sep 2026: Komatsu opened a parts distribution center in St. Albert, Alberta, with approximately 135,000 square feet, doubling its previous Canadian warehouse capacity.
- Apr 2026: On April 21, Komatsu commissioned its 1,000th autonomous ultra-class haul truck, a 930E-5AT with a 290-metric-ton payload, at Barrick’s Nevada Gold Mines operation in the United States.
- Mar 2026: On March 24, Liebherr-Export and official Bulgarian supplier Alki-L delivered a 300-metric-ton-class R 9350 E electric face-shovel excavator to Assarel-Medet at Bulgaria’s Assarel copper mine.
Industrial Machinery Market Report Scope and Research Methodology
Market Definition and Coverage
The industrial machinery market measures annual end-user spending on new machinery and equipment sold globally for industrial, agricultural, construction, mining, and commercial operations. It covers equipment sales across manual, semi-automated, and fully automated configurations.
Scope exclusions: Used machinery resales, separately sold spare parts and replacement components, maintenance, repair, retrofit and predictive-maintenance services, raw materials and production inputs sold to machinery manufacturers, and finished goods made using machinery are excluded.
Segments Covered in This Report
- By Product Type
- Earth-Moving Equipment
- Material-Handling Equipment
- Agricultural Machinery
- Industrial Robots and Automation Cells
- Other Product Types
- By Application Industry
- Construction and Mining
- Chemical
- Automotive
- Food and Beverage
- Pharmaceuticals
- Power Generation
- Other Application Industries
- By End-User Ownership
- Original Equipment Manufacturers (OEMs)
- Contract Manufacturers
- Rental and Leasing Companies
- Government and Municipalities
- By Automation Level
- Conventional Manually-Operated
- Semi-Automated / CNC
- Fully-Automated / Lights-Out Cells
- By Geography
- North America
- United States
- Canada
- Mexico
- South America
- Brazil
- Argentina
- Rest of South America
- Europe
- Germany
- France
- United Kingdom
- Italy
- Rest of Europe
- Asia-Pacific
- China
- Japan
- South Korea
- India
- Australia
- Rest of Asia-Pacific
- Middle East and Africa
- Middle East
- Saudi Arabia
- United Arab Emirates
- Turkey
- Rest of Middle East
- Africa
- South Africa
- Kenya
- Rest of Africa
- Middle East
- North America
Data Sources, Market Sizing, and Validation
Desk Research
Public manufacturing and equipment indicators from sources such as the World Bank's World Development Indicators, which attributes its machinery and transport equipment series to UNIDO industrial statistics, help describe machinery production within manufacturing. The U.S. Census Bureau's Manufacturers' Shipments, Inventories, and Orders survey provides shipment, order, and backlog signals, while the International Federation of Robotics' World Robotics findings track automation deployments.
Company annual reports, SEC 10-K filings, investor presentations, and reputable trade press can cross-check product mix, orders, manufacturing investment, and equipment deliveries, with attention to avoiding double counting of dealer transfers and separately reported services. These sources are not exhaustive, and further sources inform collection, validation, and clarification.
Primary Interviews and Surveys
Interviews and structured surveys should cover machinery manufacturers, dealers and integrators, and equipment buyers across industrial, agricultural, construction, mining, and commercial operations, with respondents responsible for product, sales, procurement, operations, or finance. Analysts should use responses to test secondary-source interpretations of new-equipment spending, channel treatment, replacement timing, and segment mix, then reconcile material differences against shipment, order, and installation indicators. Where direct evidence is sparse, estimates should be bounded with comparable equipment classes and selective supplier or channel checks, with unresolved gaps flagged for follow-up rather than treated as confirmed.
Distribution of primary research fieldwork respondents
| Company type | Respondent position | Region |
|---|---|---|
| Top tier: 30% | CXOs: 18% | APAC: 42% |
| Mid tier: 50% | Functional/Unit leaders: 34% | EMEA: 30% |
| Smaller Players: 20% | Managers: 48% | Americas: 28% |
Market-Sizing & Forecasting
A top-down model estimates global annual spending on new complete machinery at the end-user purchase price, then distributes the total across geography and the product, application, ownership, and automation classes in the study. The analyst tracks manufacturing output and capacity investment, construction and mining project spending, agricultural equipment demand, manufacturer orders and backlogs, and robot installations as indicators of new capacity, replacement cycles, and automation adoption. Equipment price and product mix help translate unit activity into market value. Where historical series are consistent, multivariate regression can relate spending to these indicators. Where project timing or commodity-linked demand creates instability, scenario analysis can test alternative equipment-investment paths. Segment shares are derived from reported product and regional sales mixes, application exposure, buyer ownership evidence, and automation data, then checked against each segment's demand drivers. Selective bottom-up checks use supplier roll-ups or sampled average selling price times shipment volume to test large categories. Where supplier coverage or unit data are incomplete, analysts bound the check with comparable products and reconcile it to the top-down total. Primary respondents can test whether forecast drivers and segment share movements reflect actual purchasing and replacement decisions.
Data Validation & Update Cycle
Analysts triangulate company disclosures with independent shipment, order, backlog, construction, agricultural, and robot-installation signals, while checking currency, price changes, transaction stages, and coverage for anomalies. A second review compares totals and segment movements with prior periods and adjacent indicators. Analysts investigate variances, correct supported errors, and re-contact relevant respondents when a material contradiction, changed purchase plan, or unclear channel treatment could alter an estimate. The model is refreshed annually, updated between cycles when a material event changes investment or delivery conditions, and reviewed afresh before delivery, with analysts resolving flagged anomalies before sign-off.
Mordor Intelligence's Industrial Machinery Market Size Measured Against Other Published Estimates
Published estimates can differ in the transactions and products they count and the inputs used to model demand. The industrial machinery market measures annual end-user spending on new machinery and equipment sold globally for industrial, agricultural, construction, mining, and commercial operations.
Key Gap Drivers include the study's defined coverage and market-specific modeling choices. The analyst tracks manufacturing output and capacity investment, construction and mining project spending, agricultural equipment demand, manufacturer orders and backlogs, and robot installations as indicators of new capacity, replacement cycles, and automation adoption.
Benchmark comparison
| Source | Market Size | Gaps in Research Methodology |
|---|---|---|
| Mordor Intelligence | USD 0.94 T (2027) | |
| Global Consultancy A | USD 745.6 B (2025) | At its 2025 base, this estimate is 20.7% below this report's 2027 value of USD 0.94 T, 2 years later. Its page defines spending as revenue accruing to OEMs and reports a pre-current-year base while forecasting market growth. |
| Regional Consultancy B | USD 766.6 B (2026) | At its 2026 base, this estimate is 18.4% below this report's 2027 value of USD 0.94 T, 1 year later. Its published estimate precedes the current year, and its forecast projects continued market growth from that estimate. |
Mordor Intelligence's analysts triangulate company disclosures with independent shipment, order, backlog, construction, agricultural, and robot-installation signals, while checking currency, price changes, transaction stages, and coverage for anomalies.
Key Questions Answered in the Report
What is the industrial machinery market size and growth outlook?
The market is expected to reach USD 0.94 trillion in 2027 and USD 1.38 trillion by 2032, growing at a CAGR of 8.05% over 2027-2032.
What drives new machinery investment?
Factory modernization and reshoring in the United States support CNC and automation investment, while clean-energy construction adds lifting-equipment demand.
Which machinery product segment leads spending?
Earth-moving equipment led with 30.76% of new-machinery spending in 2026. Industrial robots and automation cells are projected to grow fastest at a 9.15% CAGR over 2027-2032.
Which companies are major machinery suppliers?
Caterpillar Inc., Komatsu Ltd., Deere & Company, Hitachi Construction Machinery Co., Ltd., and CNH Industrial N.V. are major participants.
What constrains advanced machinery investment?
Cost and integration can hinder technology investment. In 2026, 33% of surveyed Canadian manufacturing executives and leaders cited cost as a reason for not investing in technology.
Which region leads new-machinery spending?
Asia-Pacific held a 41.08% share in 2026 and is forecast to grow fastest at a 9.5% CAGR over 2027-2032.