
Industrial Laser System Market Size and Share
Market Overview
| Study Period | 2020 - 2031 |
|---|---|
| Market Size (2026) | USD 6.71 Billion |
| Market Size (2031) | USD 8.72 Billion |
| Growth Rate (2026 - 2031) | 5.38% CAGR |
| Fastest Growing Market | Asia |
| Largest Market | Asia |
| Market Concentration | Medium |
Major Players *Disclaimer: Major Players sorted in no particular order Image © Mordor Intelligence. Reuse requires attribution under CC BY 4.0. | |
Industrial Laser System Market Analysis by Mordor Intelligence
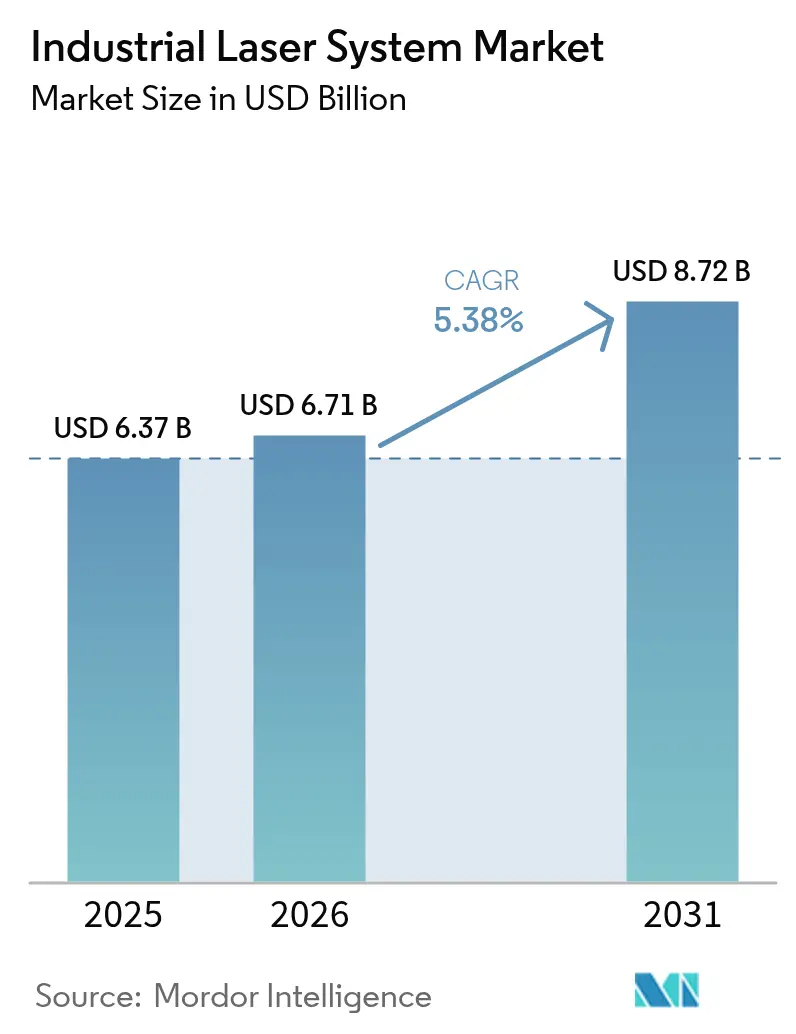
The Industrial laser system market size is expected to grow from USD 6.37 billion in 2025 to USD 6.71 billion in 2026 and is forecast to reach USD 8.72 billion by 2031 at 5.38% CAGR over 2026-2031. Demand is sustained by manufacturers switching from mechanical to laser-based tools, semiconductor fabs adding sub-micron via-hole capability, and battery gigafactories standardizing laser welding. Fiber technology remains entrenched because of its 51.9% revenue share in 2024, though ultrafast sources post the quickest 6.4% CAGR. Mid-range 1–6 kW platforms dominate with 48.3% share, yet systems above 6 kW are penetrating heavy-industry jobs as power scaling cuts cycle times. Cutting applications still command 41.2% of the industrial laser system market, but additive manufacturing exhibits a 7.3% CAGR on the back of aerospace lightweighting programs. Asia-Pacific retains a 46.1% revenue lead and a 6.7% growth clip due to semiconductor and EV investments, while Europe leverages climate policies to expand surface-texturing demand.
Key Report Takeaways
- By laser type, fiber sources held 51.25% of industrial laser system market share in 2025, whereas ultrafast lasers are set to grow 6.05% CAGR through 2031.
- By power range, medium-power (1-6 kW) units captured 47.70% of the industrial laser system market size in 2025, while >6 kW solutions advance at 5.85% CAGR.
- By application, cutting delivered 40.65% of 2025 revenue, and additive manufacturing is projected to rise 6.95% CAGR to 2031.
- By end-user industry, automotive led with 27.05% share in 2025; medical devices will accelerate at 6.55% CAGR over 2026-2031.
- By geography, Asia-Pacific accounted for 45.70% of 2025 revenue and is tracking a 6.35% CAGR through 2031.
Note: Market size and forecast figures in this report are generated using Mordor Intelligence’s proprietary estimation framework, updated with the latest available data and insights as of 2026.
Global Industrial Laser System Market Trends and Insights
Drivers Impact Analysis*
| Driver | (~) % Impact on CAGR Forecast | Geographic Relevance | Impact Timeline |
|---|---|---|---|
| Rapid Transition from Mechanical to Laser‐Based Metal Cutting in Automotive Manufacturing | +1.5% | Global, with concentration in Germany, China, Japan | Medium term (2-4 years) |
| Proliferation of 5G/AI Chip Fabrication Demanding Sub-Micron Via-Hole Lasers | +0.8% | APAC core, spill-over to North America | Short term (≤ 2 years) |
| Battery-Pack Welding Needs in e-Mobility Gigafactories-Europe-Led | +0.7% | Europe & China, expanding to North America | Medium term (2-4 years) |
| Growing Adoption of Ultrafast Lasers for OLED and Micro-LED Processing-Asia | +0.6% | APAC core, particularly South Korea, China, Japan | Short term (≤ 2 years) |
| Laser-Based Additive Manufacturing in Aerospace Lightweighting-U.S.-Centric | +0.5% | North America & Europe | Long term (≥ 4 years) |
| EU "Fit-for-55" Drives Laser Surface-Texturing for Energy-Efficient Turbines | +0.4% | Europe, with technology transfer to global markets | Long term (≥ 4 years) |
| Source: Mordor Intelligence | |||
Rapid transition from mechanical to laser-based metal cutting in automotive manufacturing
Automakers are standardizing fiber laser lines to shorten chassis and battery-enclosure cycles, boost edge quality, and minimize scrap. German plants report 40% shorter processing time when swapping plasma cutters for 6 kW fiber units. Asian EV producers follow with multi-kilowatt installations that keep pace with rising vehicle output while supporting aluminum-steel hybrid designs prized for lightweighting. The same trend reaches suppliers preparing for Europe’s 2035 internal-combustion phase-out, cementing long-term demand across the industrial laser system market.[1]TRUMPF SE + Co. KG, “TRUMPF Annual Report 2024,” trumpf.com
Proliferation of 5G/AI chip fabrication demanding sub-micron via-hole lasers
Advanced nodes at 3 nm and 2 nm require femtosecond drilling to preserve signal integrity in multilayer substrates. Taiwan, South Korea, and the United States are installing high-precision platforms whose 100-fs pulses avoid heat-affected zones. Delivery lead times have stretched past one year because optical-component makers struggle to expand capacity, yet chip foundries continue signing multi-tool contracts that widen the industrial laser system market.
Battery-pack welding needs in e-mobility gigafactories-Europe-led
European cell makers confront aluminum-to-copper joining challenges that only nanosecond fiber welding can solve without forming brittle intermetallics. Systems now integrate AI-driven vision modules that detect micro-cracks on the fly, keeping defect rates below 50 ppm. Chinese and US gigafactories mirror these specifications as they localize production, creating a globally harmonized set of welding benchmarks that bolsters the industrial laser system market
Growing adoption of ultrafast lasers for OLED and micro-LED processing-Asia
Display makers need sub-100-fs pulses to cut flexible substrates and drill micro-LED channels without carbonizing organic layers. South Korean leaders purchase dual-beam femtosecond tools that deliver micron-scale accuracy for foldable screens, while Chinese peers accelerate capex to supply premium smartphones. These investments propel the industrial laser system market into new form-factor opportunities such as transparent dashboards and heads-up displays. [2]BOE Technology Group, “BOE Annual Report 2024,” boe.com
Restraints Impact Analysis*
| Restraint | (~) % Impact on CAGR Forecast | Geographic Relevance | Impact Timeline |
|---|---|---|---|
| Capital-Intensive Above 6 kW Systems Limit Penetration into Tier-2 Job-Shops | -0.9% | Global, particularly affecting emerging markets | Medium term (2-4 years) |
| Stringent IEC/EN 60825-1 Safety Re-Certification Costs for Retrofitted Lines | -0.6% | Europe & North America, with spillover to Asia | Short term (≤ 2 years) |
| Heat-Affected Zone (HAZ) Micro-Cracking in Next-Gen Battery Foils | -0.4% | Global, with concentration in battery manufacturing hubs | Medium term (2-4 years) |
| Volatile Rare-Earth (Yb, Nd) Supply Chain from China Elevates Laser BOM Cost | -0.3% | Global, particularly affecting Western manufacturers | Long term (≥ 4 years) |
| Source: Mordor Intelligence | |||
Capital-intensive >6 kW systems limit penetration into tier-2 job shops
High-power units now cost upward of USD 500,000, and the infrastructure-chillers, three-phase wiring, Class 1 enclosures-can double that outlay. Smaller fabricators in Southeast Asia, Latin America, and Eastern Europe face currency swings and scarce leasing options, slowing adoption even as OEMs push for thicker-plate cutting. As a result, segments of the industrial laser system market remain under-served despite clear productivity gains
Stringent IEC/EN 60825-1 safety re-certification costs for retrofitted lines
Re-certifying older lines may reach USD 200,000 once external audits, guarding retrofits, and operator training are counted. The burden is highest for SMEs that still run legacy mechanical equipment; many delay upgrades, creating a compliance bottleneck that tempers near-term expansion of the industrial laser system market.
*Our forecasts treat driver/restraint impacts as directional, not additive. The impact forecasts reflect baseline growth, mix effects, and variable interactions.
Segment Analysis
By Laser Type: Fiber leadership, ultrafast momentum
Fiber sources accounted for 51.25% of revenue in 2025, reflecting their rugged build, high wall-plug efficiency, and easy integration with motion platforms. Their dominance is visible in automotive and semiconductor fabs that depend on hour-by-hour uptime. The industrial laser system market size for fiber systems is expected to expand at 5.25% CAGR, supported by ongoing price drops in ytterbium diodes. Ultrafast lasers, despite a smaller base, add 6.05% CAGR as electronics, medical, and display customers adopt pulse widths under 200 fs. Cooling innovations and OPCPA pumping architectures raise average power, enabling mass-production throughput that once favored continuous-wave tools.
Solid-state and disc architectures serve niche wavelengths that suit exotic alloys or thick copper cutting, whereas CO₂ units retreat to thick acrylic or wood applications because their long wavelength lacks efficiency in metals. Direct-diode arrays address cladding, hardening, and polymer welding tasks where beam quality tolerance is higher and 50% electrical efficiency lowers operating cost. Excimer systems persist in semiconductor lithography and catheter hole drilling, while quantum cascade designs sit in R&D but could unlock mid-IR ablation markets later in the decade. Collectively, these dynamics keep technology diversity high within the industrial laser system market.


By Power Range: Mid-range anchor, high-power acceleration
Systems rated 1-6 kW generated almost half of 2025 revenue as they balance capital cost against sheet-metal speed. Automotive sub-contractors favor 4 kW cutters that process 2 mm steel at 30 m/min while remaining affordable. The industrial laser system market share for this band is projected to remain stable even as high-power units gain ground. Platforms above 6 kW grow 5.85% CAGR thanks to shipyards, bridge yards, and heavy-equipment makers that need 100 mm-thick steel processing in single passes. Early adopters report labor savings that compensate for higher capex within two years.
Below 1 kW, nanosecond and continuous-wave tools process printed circuit boards, sensor housings, and stents where heat control trumps speed. OEMs pair these low-power heads with galvanometer scanners to achieve 500 mm/s engraving while holding 10 µm positional accuracy. Together, the tiers ensure every material thickness and productivity target has a matching laser, maintaining a broad power-range spectrum across the industrial laser system market.
By Application: Cutting core, additive surge
Cutting stayed dominant in 2025, earning 40.65% of revenue because sheet-metal part counts far exceed any other operation in global manufacturing. The task’s universality-from EV battery trays to aircraft brackets-continues to anchor the industrial laser system market. Yet additive manufacturing, especially laser powder bed fusion and directed-energy deposition, records 6.95% CAGR as aerospace primes and orthopedic firms seek geometry freedom.
Welding, brazing, and soldering advance steadily as gigafactory production triples over the decade; real-time seam-monitoring modules drive zero-defect targets. Marking and engraving flourish under traceability mandates such as EU MDR, while drilling and micro-processing secure semiconductor and medical catheter business. Surface treatment, including hardening and texturing, answers turbine and mold-tool life extension needs, rounding out a comprehensive set of growth avenues for the industrial laser system market.

By End-User Industry: Automotive scale, medical precision
Automotive customers procured 27.05% of 2025 shipments, spurred by platform electrification and the climb toward 150 GWh annual battery capacity in Europe alone. Welding quality directly affects battery safety, making lasers indispensable across tab, pack, and enclosure stations. Meanwhile, medical-device builders adopt ultrafast and UV lasers at 6.55% CAGR to cut nitinol stents, ablate polymer guidewires, and texture implant surfaces for osteointegration. These divergent needs demonstrate the industrial laser system market’s versatility.
Electronics fabs rely on femtosecond drilling for high-density interconnects; aerospace primes fuse nickel superalloys layer by layer for turbine blades; energy companies laser-clean wind-turbine molds to improve epoxy release. Heavy-machinery firms use 15 kW heads to slice crawler frames, while jewelry ateliers engrave intricate 20 µm motifs. Each sector draws on distinct laser specs, sustaining healthy cross-industry demand diversity.
Geography Analysis
Asia-Pacific commanded 45.70% of 2025 revenue and is projected at a 6.35% CAGR through 2031. China’s “Made-in-China 2025” policy funds semiconductor mega-fabs, EV lines, and photovoltaic plants that turn to high-brightness fiber systems for cutting and welding. South Korean and Japanese display makers order femtosecond platforms to advance OLED and micro-LED projects. Southeast Asian contract manufacturers embrace 1-3 kW cutters for appliance chassis, aided by government import-duty relief. Local service networks, surplus engineering talent, and extensive supply chains keep capital efficiency high, reinforcing leadership in the industrial laser system market
Europe follows with strong installation momentum anchored in Germany, Italy, and Sweden. Automotive laser content per vehicle rises as premium brands shift toward aluminum body-in-white and battery enclosures. EU “Fit-for-55” rules require turbine blade texturing and hydrogen-ready pipeline welding; both favor high-power lasers. Battery gigafactory build-outs in Sweden and France adopt laser welding lines synced with inline X-ray inspection, while aerospace hubs in Toulouse and Hamburg invest in laser powder bed fusion for structural brackets. Overall, policy, sustainability targets, and engineering heritage combine to keep Europe central to the industrial laser system market.
North America shows steady expansion propelled by defense, aerospace, and domestic semiconductor reshoring efforts. The CHIPS and Science Act frees capital incentives for via-hole drilling tools, and the Pentagon funds megawatt fiber laser demonstrators. Tier-1 automotive suppliers in Mexico transition to 4 kW units to meet OEM traceability standards, while Canadian mining-equipment builders install 20 kW machines to process quenched-and-tempered plate. Latin America and the Middle East & Africa remain emerging opportunities: Brazilian agri-machinery, Saudi desalination plants, and South African railcar factories pilot mid-power lasers, yet penetration stays low due to financing gaps and limited field service. Nonetheless, growth potential is recognized across the wider industrial laser system market.


Regulatory Landscape
Industrial laser systems are covered by product-safety standards and workplace exposure rules. In 2026, the IEC released updated laser-safety publications, including IEC 60825-1:2026 (revising hazard classification and measurement methods) and IEC TS 60825-13:2026 (updated guidance for radiometric measurements used in classification), which supports reclassification and documentation updates for OEMs selling globally.
In the European Union, Directive 2006/25/EC continues to set mandatory exposure limit values for workers exposed to artificial optical radiation, affecting safeguards such as enclosures, interlocks, and training across cutting, welding, and microprocessing lines. In the United States, industrial laser product compliance aligns with FDA radiation-emitting product requirements under 21 CFR 1040.10 and 21 CFR 1040.11 (as reflected in the eCFR update status as of May 2026), shaping labeling, reporting, and performance requirements for laser products shipped into the market.
Value Chain Analysis
The industrial laser system value chain runs from upstream optical and electronic components (pump diodes, gain media, optics, scanning heads, motion stages, controls, and safety enclosures) to midstream system integration that combines laser sources with beam delivery, automation, and safety. Downstream channels then support installation, applications engineering, and lifecycle service for end users. In high-precision segments such as semiconductor and electronics, toolmakers increasingly pair laser platforms with metrology, inspection, and factory automation to meet yield and traceability requirements, which raises switching costs for fabs and OSATs.
Recent moves show how suppliers expand capabilities and coverage through partnerships, IP protection, and channel expansion. In 2025, LPKF partnered with Onto Innovation to link Laser Induced Deep Etching (LIDE) with advanced inspection for glass substrate processing, and it defended LIDE patents in the EU and Korea, reinforcing control of critical process steps for through-glass via workflows. Also in 2025, Laser Photonics Corporation acquired Beamer Laser Marking Systems assets and expanded its North American footprint through a broader distribution and service network, while multi-system orders tied to semiconductor capital equipment customers point to the role of local support, applications tuning, and qualification assistance in the value delivered by integrated systems.
Competitive Landscape
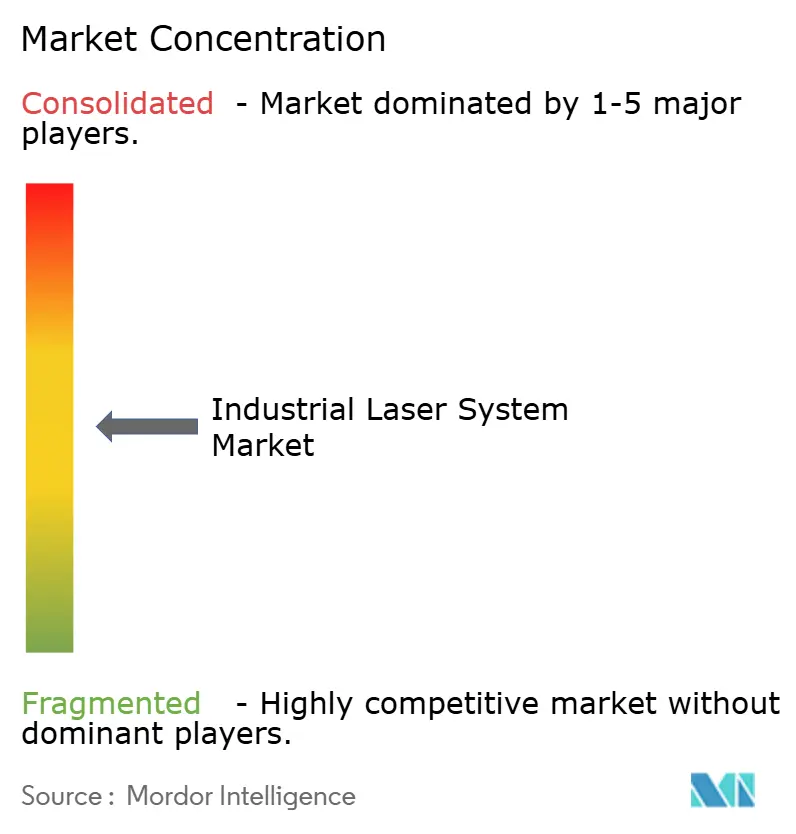
The market remains moderately concentrated. TRUMPF, IPG Photonics, and Coherent Corp hold top positions through proprietary sources, integrated motion-control, and global service footprints. Each allocates 8-10% of revenue to R&D, filing hundreds of patents yearly in beam modulation and AI process monitoring. IPG’s dual-beam technology tailors core/ring energy distributions, driving additive build rates. TRUMPF embeds SiMa.ai inference chips in controllers that tune parameters in real-time; early adopters report 25% scrap reduction. Coherent scales excimer output to meet EUV lithography demand, bolstering presence in semiconductor value chains.
Competition intensifies as Han’s Laser, HGTech, and Maxphotonics export low-cost platforms into Europe and the United States, often bundling local service agreements. Niche firms such as nLIGHT capture US defense contracts by delivering polarization-maintaining fiber chains that combine into >300 kW coherent beams. Acquisition activity accelerates: IPG absorbed cleanLASER to enter surface-cleaning, while Coherent spun off non-core photonics to fund excimer growth. Software ecosystems emerge as the next battleground, with cloud dashboards that benchmark OEE across multi-site fleets. These developments collectively expand the addressable industrial laser system market and raise the entry bar for new contenders.
Tier-2 suppliers differentiate through vertical specialization. Bystronic integrates sheet-handling automation to target job-shops seeking turnkey solutions, and Prima Industrie focuses on hybrid laser-punch centers for flexible manufacturing. Component makers—II-VI, Lumentum, Jenoptik—prioritize pump diodes, lenses, and beam shapers, creating interdependencies that reinforce supply-chain resilience. Despite rising Chinese competition, Western incumbents retain edge in ultrafast and defense-grade systems due to export-control regimes and lifetime performance guarantees. Market concentration remains stable yet leaves room for agile challengers utilizing open-source control stacks.
Industrial Laser System Industry Leaders
TRUMPF GmbH + Co KG
IPG Photonics Corporation
Newport Corporation (MKS Instruments)
Jenoptik AG
Coherent Corp.
- *Disclaimer: Major Players sorted in no particular order

Market Opportunities and Future Outlook
Microelectronics and advanced packaging create whitespace for ultrafast and precision laser platforms that reduce thermal damage while enabling new materials and structures, including glass substrates and fine via formation. LPKF's 2025 integration work around LIDE and inspection with Onto Innovation aligns with this trend toward toolchains where laser steps are qualified alongside metrology, which opens opportunities for laser OEMs that can supply process-capable packages rather than standalone sources.
At the same time, manufacturing expansions in indium phosphide (InP) photonics and optical infrastructure support upstream availability of semiconductor laser devices and related photonics ecosystems that feed into industrial laser architectures and adjacent high-volume laser-enabled manufacturing. In June 2026, Coherent broke ground on an expanded facility in Sherman, Texas, supported by a CHIPS Act letter of intent for USD 50 million and a partnership with NVIDIA to scale InP wafer production for AI optical infrastructure, while Lumentum announced in March 2026 a large manufacturing facility plan in Greensboro, North Carolina, for advanced InP-based optical devices. Supply-side alignment also shows up in Asia, where disclosed capital equipment ordering activity, such as Han's Laser being named in a June 2026 optics capacity-related order by Largan Precision, supports the broader installed base and service ecosystem for laser-enabled manufacturing.
Recent Industry Developments
- July 2026: TRUMPF announced a strategic partnership with Mate Precision Technologies to expand its tooling portfolio for sheet metal fabricators. The partnership expands TRUMPF's ability to deliver more complete, application-ready solutions around laser cutting and forming workflows, supporting adoption in job shops that prioritize turnkey productivity.
- June 2025: IPG Photonics released high-power fiber lasers on a new rack-integrated (RI) platform designed to reduce installation footprint. The architectural shift improves deployability in space-constrained factories and supports scaling toward higher power levels without proportionally increasing facility requirements.
- June 2024: IPG Photonics launched advanced dual-beam fiber lasers targeted at additive manufacturing applications. By improving control over energy distribution in the melt pool, the product supports higher build rates and process stability for aerospace and industrial metal AM users.


Research Methodology Framework and Report Scope
Market Definition and Coverage
This market covers revenue from industrial laser systems used for material processing in manufacturing. In scope, the laser source is sold as part of a system that includes optics, motion control, and safety features, and it is used for cutting, welding, drilling, and marking.
Scope exclusions: medical therapy lasers, scientific research bench systems, and consumer printing devices are excluded from this market size.
Segmentation Overview
- By Laser Type
- Fiber Lasers
- Solid-State Lasers
- Nd:YAG
- Disc Lasers
- CO2 Lasers
- Excimer Lasers
- Direct Diode Lasers
- Other Lasers (Ultrafast, QCW, QCL)
- By Power Range
- Low Power (Less than 1 kW)
- Medium Power (1-6 kW)
- High Power (Above 6 kW)
- By Application
- Cutting
- 2D Cutting
- 3D Cutting
- Welding and Brazing
- Marking and Engraving
- Drilling and Micro-Processing
- Surface Treatment (Cladding, Hardening, Texturing)
- Additive Manufacturing
- Cutting
- By End-user Industry
- Automotive
- Semiconductor and Electronics
- Aerospace and Defense
- Medical Devices
- Energy (Battery, Solar)
- Heavy Machinery and Tools
- Jewelry and Artisanal
- Others (Packaging, General Mfg.)
- By Geography
- North America
- United States
- Canada
- Mexico
- Europe
- Germany
- United Kingdom
- France
- Nordics
- Rest of Europe
- South America
- Brazil
- Rest of South America
- Asia-Pacific
- China
- Japan
- India
- South-East Asia
- Rest of Asia-Pacific
- Middle East and Africa
- Middle East
- Gulf Cooperation Council Countries
- Turkey
- Rest of Middle East
- Africa
- South Africa
- Rest of Africa
- Middle East
- North America
Data Sources, Market Sizing, and Validation
Desk Research
Desk research was used to build the starting structure of the model and to keep the definitions consistent across regions. We reviewed public manufacturing and trade signals tied to laser equipment demand, including UN Comtrade trade statistics, World Bank and OECD industrial output series, and national statistical offices that publish production indices and capital goods trends. We also used standards and technical adoption cues from sources such as ISO publications and peer reviewed photonics and manufacturing journals, which helped confirm which applications are scaling and where.
To translate activity into revenue, we added supply side context from annual reports, investor presentations, and press releases of laser equipment and component makers, along with association websites that track photonics activity. Where needed, we relied on paid subscriptions for company financials and intelligence, news and financials, and patent databases to verify product roadmaps and timing of technology shifts that can move average selling prices. These desk sources were not exhaustive, and we used additional public and paid references for data collection, cross checks, and clarification during analysis.
Primary Interviews and Surveys
Primary work focused on confirming which parts of system revenue are consistently captured, specifically whether it includes the laser source plus integrated optics, motion, and enclosures, versus items that are better treated as services or upgrades. We spoke with a mix of laser system suppliers, component ecosystem participants, integrators, and end users across automotive, electronics, general industrial, and metal fabrication. Follow up calls were used to stress test pricing, utilization, and replacement cycles across regions.
Distribution of primary research fieldwork respondents
| Company type | Respondent position | Region |
|---|---|---|
| Top tier: 26% | CXOs: 17% | APAC: 44% |
| Mid tier: 54% | Functional/Unit leaders: 30% | EMEA: 36% |
| Smaller Players: 20% | Managers: 53% | Americas: 20% |
Market-Sizing & Forecasting
We sized the market by first reconstructing the demand pool from manufacturing activity and equipment investment patterns by region, then applying adoption and replacement rates for laser based processing in key use cases. In the model, the main totals are driven by practical inputs such as metal fabrication output, automotive and electronics production momentum, capital spending cycles in factories, and the installed base replacement rhythm for cutting and welding cells. Pricing is handled through application level average selling price ranges, adjusted for laser type mix shifts and power level trends, and converted using consistent annual average currency assumptions.
To prevent the totals from drifting, we corroborated results with selective bottom-up approximations, including supplier revenue roll ups where disclosures allow it, sampled ASP multiplied by estimated shipments for common system classes, and channel checks with integrators to understand what share is new build versus upgrades. For forecasting, we use scenario analysis supported by an ARIMA check on the historical demand indicators, then refine assumptions using what industry experts share on lead times, order backlog direction, and near term pricing pressure. Where company disclosures are incomplete, we use peer group ratios and regional share splits validated through interviews, then normalize so the sums match the defined scope.
Data Validation & Update Cycle
Validation uses multiple checks so one data series does not overly influence the outcome. We compare model output against independent signals such as machine tool investment direction, trade flow shifts for laser equipment categories, and disclosed revenue trends from suppliers, then review any large variances before sign off. If an assumption moves the market size more than expected, we re contact experts and re check the input that caused the change, which helps remove one off effects.
Reports are refreshed annually, with interim updates when there are material events such as sharp currency swings, major demand slowdowns, or notable pricing changes in common laser system configurations. Before delivery, a final analyst pass is completed so the latest public disclosures and recent primary feedback are reflected in the numbers clients receive.
Mordor Intelligence's Industrial Laser System Market Sizing Compared With Other Published Estimates
Published market sizes for industrial laser systems often look far apart, even when the topic name sounds similar. The differences typically come from how each study sets system boundaries, how pricing is averaged across laser types and power classes, and which year and currency timing are used for conversion.
In practice, refresh cadence is a common driver because laser system pricing can change with component availability and mix shifts between fiber, CO2, and other types. Another driver is whether services, retrofits, and stand alone laser sources are included in the same revenue bucket, which can inflate totals relative to a view that counts only new integrated systems. Currency timing can also swing the USD value in a given year, since regional demand varies. For that reason, the refresh and conversion choices used by Mordor Intelligence are kept consistent with application level ASP checks and re validation through follow up calls.
Benchmark comparison
| Source | Market Size | Gaps in Research Methodology |
|---|---|---|
| Mordor Intelligence | USD 6.71 B (2026) | |
| Industry Publisher A | USD 28.00 B (2025) | This figure appears to use a wider definition that can fold in broader industrial laser categories beyond integrated systems, and it can also mix macro and micro processing revenue with adjacent tools and services, which increases the counted revenue pool. |
| Global Consultancy B | USD 20.03 B (2025) | This estimate likely captures a broader set of industrial laser system and laser equipment revenues, and differences in pricing treatment (single blended ASP versus application specific ASP ranges) and currency conversion timing can further lift the reported USD total. |
The comparison shows that most of the spread is explained by scope boundaries and pricing logic rather than disagreement on demand direction. When the counted revenue is limited to integrated industrial systems and the price curve is checked by application and region, the final market value stays traceable to clear inputs and can be repeated in future refreshes without large swings.


Key Questions Answered in the Report
What is the current size of the industrial laser system market?
The industrial laser system market is valued at USD 6.71 billion in 2026 and is forecast to reach USD 8.72 billion by 2031 at a 5.38% CAGR.
Which laser type dominates industrial applications today?
Fiber lasers led with a 51.25% revenue share in 2025 because of high efficiency and low maintenance.
Why is additive manufacturing the fastest-growing application?
Aerospace lightweighting and bespoke medical implants demand complex geometries that laser-based additive manufacturing delivers, resulting in a 6.95% CAGR to 2031.
Which region leads market revenue?
Asia-Pacific held 45.70% of 2025 revenue and is expanding at 6.35% CAGR due to semiconductor fabs, EV battery plants, and display manufacturing.
Page last updated on:






