
Industrial Gearbox Market Size and Share
Market Overview
| Study Period | 2021 - 2031 |
|---|---|
| Market Size (2026) | USD 31.65 Billion |
| Market Size (2031) | USD 38.49 Billion |
| Growth Rate (2026 - 2031) | 3.99 % |
| Fastest Growing Market | Asia Pacific |
| Largest Market | Asia Pacific |
| Market Concentration | Medium |
Major Players *Disclaimer: Major Players sorted in no particular order Image © Mordor Intelligence. Reuse requires attribution under CC BY 4.0. | |
Industrial Gearbox Market Analysis by Mordor Intelligence
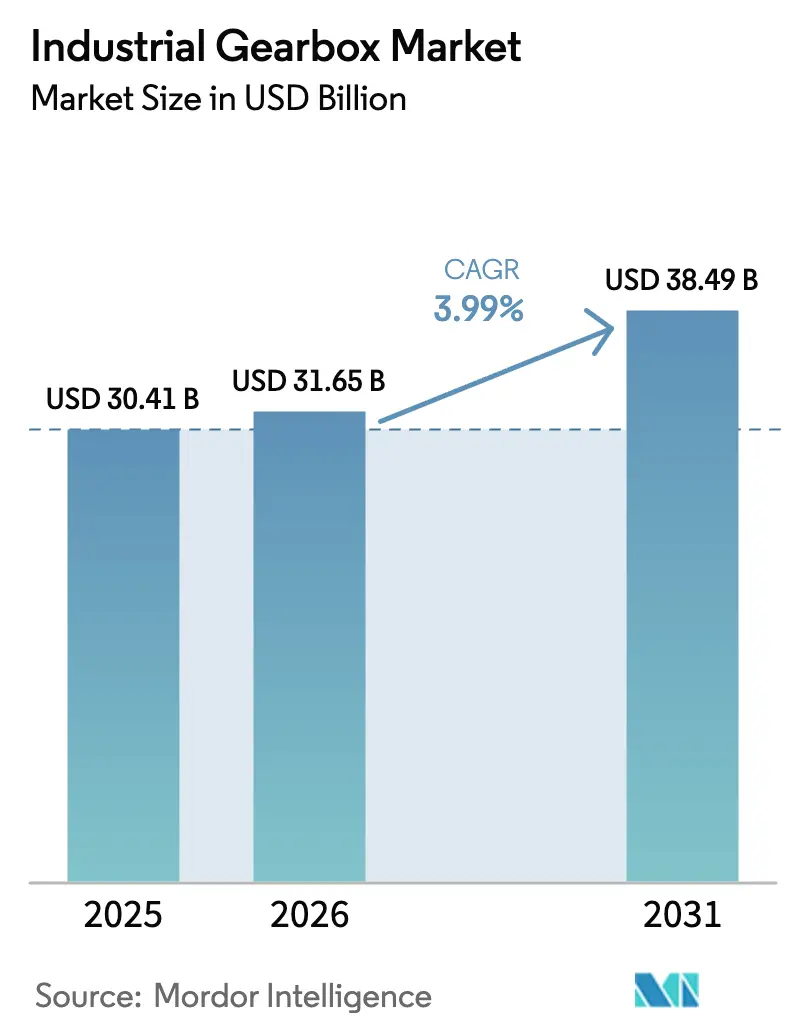
The Industrial Gearbox Market size is expected to grow from USD 30.41 billion in 2025 to USD 31.65 billion in 2026 and is forecast to reach USD 38.49 billion by 2031 at 3.99% CAGR over 2026-2031.
Ongoing factory-floor digitalization is turning gearboxes into edge-intelligent assets that collect vibration, temperature, and load data, feeding predictive-maintenance algorithms and lowering unscheduled downtime by 20-25%. Planetary designs are growing quickly on the back of robot, precision machine-tool, and solar-tracker demand, while helical units remain the workhorse for conveyors, mixers, and general-purpose machinery. Wind-turbine build-outs, intralogistics automation, and green-hydrogen programs are pulling incremental volume, especially in Asia-Pacific, where supportive industrial policies and infrastructure pipelines underpin fresh capacity. Competitive intensity is moderate because the top 20 suppliers command only 55-60% of global revenue, leaving space for regional specialists that compete on service responsiveness and application know-how.
Key Report Takeaways
- By type, helical configurations led with 37.58% of the industrial gearbox market share in 2025, while planetary designs are forecast to expand at a 4.71% CAGR through 2031.
- By end-user, manufacturing and machine tools accounted for 33.21% of the industrial gearbox market size in 2025, whereas the energy sector is projected to post the fastest 4.92% CAGR to 2031.
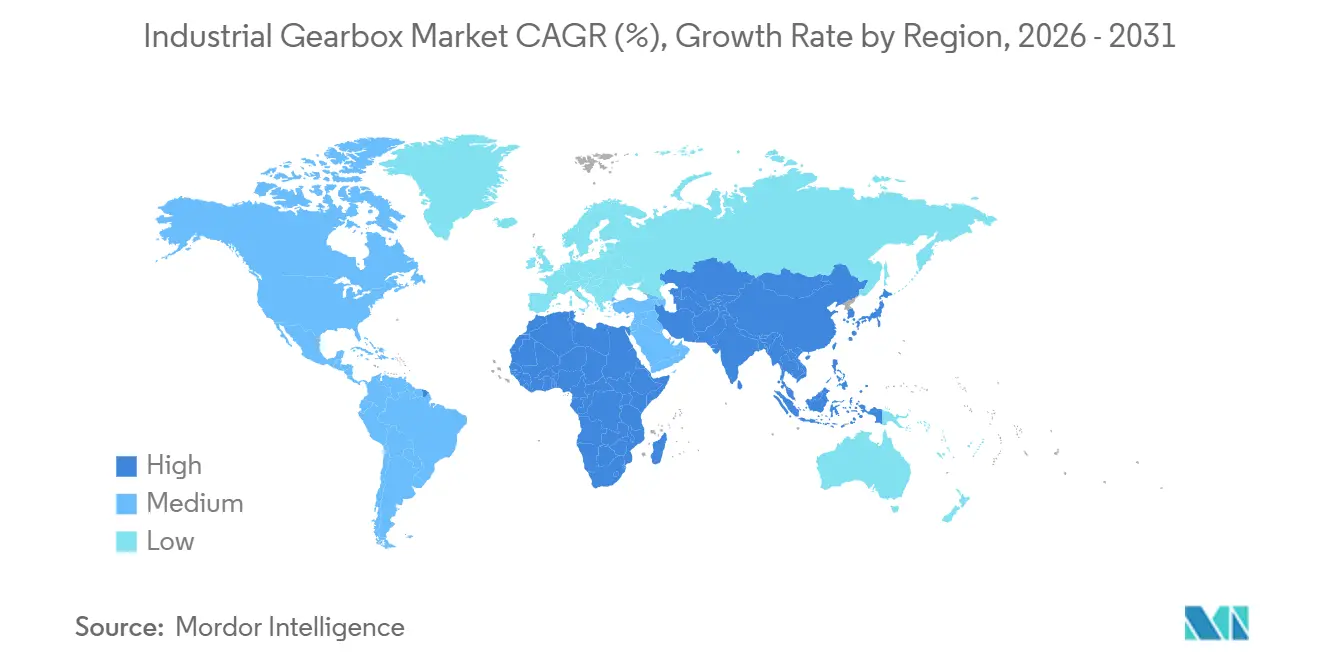
- By geography, Asia-Pacific captured 43.63% of 2025 revenue and is anticipated to grow at a 4.68% CAGR through 2031.
Note: Market size and forecast figures in this report are generated using Mordor Intelligence’s proprietary estimation framework, updated with the latest available data and insights as of January 2026.
Market Trends and Insights
Drivers Impact Analysis of Industrial Gearbox Market*
| Driver | (~) % Impact on CAGR Forecast | Geographic Relevance | Impact Timeline |
|---|---|---|---|
| Rising adoption of Industry 4.0-enabled automation | 1.2% | Global, with Asia-Pacific and Europe leading, early adoption in North America manufacturing hubs | Medium term (2-4 years) |
| Surging wind-turbine gear demand | 0.9% | Global, concentrated in China, Europe (Germany, UK, Denmark), North America (US offshore), emerging in Asia-Pacific (Taiwan, Japan) | Long term (≥ 4 years) |
| Rapid expansion of intralogistics and warehouse automation | 0.8% | North America (US, Canada), Europe (Germany, Netherlands, UK), Asia-Pacific e-commerce hubs (China, Japan, South Korea, Singapore) | Short term (≤ 2 years) |
| Growing construction and mining equipment output | 0.6% | Asia-Pacific (China, India, Indonesia), Middle East (Saudi Arabia, UAE), South America (Brazil, Chile, Peru), Africa (South Africa) | Medium term (2-4 years) |
| Data-driven predictive-maintenance contracts boosting upgrades | 0.5% | Global, early adoption in North America and Europe, expanding to Asia-Pacific mining and energy sectors | Medium term (2-4 years) |
| Shift to modular, 3D-printed gear components | 0.4% | North America (US, Canada), Europe (Germany, UK, France), early pilots in Asia-Pacific (Japan, South Korea) | Long term (≥ 4 years) |
| Source: Mordor Intelligence | |||
Industry 4.0-enabled automation
Condition-monitoring sensors, IO-Link interfaces, and edge-compute modules are being embedded inside gearboxes, enabling closed-loop control strategies that trim installation time by 40% on modular platforms launched in 2025.[1] Wireless vibration and temperature nodes paired with smart lubrication systems have extended service intervals beyond 10,000 hours in remote mines and offshore wind farms. Cloud-based digital twins ingest live telemetry to predict remaining useful life with up to 90% accuracy, letting operators align replacements with planned shutdowns. The roll-out of 5G low-latency networks supports on-machine analytics that dynamically adapt gear ratios to workpiece hardness, boosting throughput without hardware changes. As a result, the industrial gearbox market is pivoting from passive power transmission toward data-rich mechatronic subsystems.
Surging wind-turbine gear demand
Global offshore wind capacity hit 83.2 GW in 2024 and is forecast to swell by more than 350 GW between 2025 and 2034.[2] Multi-megawatt turbines now require main gearboxes that withstand torque loads exceeding 10,000 kN-m over 15-20 year lifecycles, spurring orders for large-diameter planetary stages. Germany has earmarked EUR 8 billion for offshore expansion, with 7-9 GW of auctions scheduled between 2025 and 2027. Medium-speed geared drivetrains held 91.3% market share in 2024, underlining gearbox relevance despite rising direct-drive adoption. Electrolyser projects for green hydrogen also specify 98%-efficiency compressor-train gearboxes, broadening the demand base beyond wind.
Rapid intralogistics and warehouse expansion
Fulfillment centers added more than 500,000 autonomous mobile robots (AMRs) in 2025, each integrating up to four precision gearboxes for wheel drives and lifts. Amazon incorporated 75,000 additional drive units in its 2025 sortation network, handling peak throughput above 1 million parcels per hour.[3] Shuttle-based automated storage and retrieval systems now demand zero-backlash hypoid gears that support 1 million start-stop cycles without efficiency loss. Synthetic lubricants stretching maintenance windows beyond 10,000 hours are being adopted to sustain 24/7 operations. A new 60 mm modular gearmotor released in 2025 trimmed commissioning time by 40%, underscoring the pace of design iteration.
Growth in construction and mining output
Infrastructure pipelines across Asia-Pacific and South America are lifting demand for high-horsepower gearboxes in mills, crushers, and conveyors, with predictive-maintenance contracts cutting unplanned downtime by up to 22% at major miners. Sensor-equipped planetary units tied to cloud dashboards accurately forecast remaining life in Chilean copper operations. India’s USD 1.4 trillion National Infrastructure Pipeline is stimulating orders for helical and bevel-helical units in cranes, mixers, and tunnel-boring machines. Middle East desalination megaprojects such as NEOM are specifying stainless-steel housings with NSF/ANSI 61-approved lubricants to handle seawater corrosion. The shift supports a consistent flow of large-frame gearbox orders through the medium term.
Restraints Impact Analysis of Industrial Gearbox Market*
| Restraint | (~) % Impact on CAGR Forecast | Geographic Relevance | Impact Timeline |
|---|---|---|---|
| Volatility in raw-material steel prices | -0.7% | Global, acute in Europe (energy-driven cost pressures) and North America, moderate impact in Asia-Pacific due to regional supply chains | Short term (≤ 2 years) |
| Extended replacement cycles in mature industries | -0.5% | North America and Europe, particularly in legacy manufacturing, automotive, and heavy machinery sectors with aging installed base | Long term (≥ 4 years) |
| Torque-dense electro-hydraulic actuators cannibalizing compact gearboxes | -0.4% | Aerospace and mobile equipment in North America and Europe, emerging substitution in Asia-Pacific construction equipment | Medium term (2-4 years) |
| Cybersecurity certification delays for smart gearboxes | -0.3% | Global, regulatory focus in Europe (EU Machinery Regulation 2027) and North America, compliance requirements spreading to Asia-Pacific | Short term (≤ 2 years) |
| Source: Mordor Intelligence | |||
Steel-price volatility
Hot-rolled coil swung between USD 620 and USD 900 per metric ton during 2024-2025, cutting gross margins by 2-3 percentage points for assemblers lacking hedging programs. Alloy-steel surcharges added USD 0.15-0.25 per kilogram in 2025, triggering selective substitution of case-hardened carbon steels at the expense of 10-15% fatigue-life reduction. Vertically integrated suppliers offset swings through captive gear-cutting and heat-treatment capacity. Additive-manufacturing platforms are driving modular designs that slash scrap from 18-22% to below 5%, compressing prototype lead times from eight weeks to five days. Although price risk is expected to moderate, it remains a near-term drag on the industrial gearbox market.
Electro-hydraulic actuator substitution
Electro-hydraulic actuators deliver 50-100 N-m per kilogram, roughly double the torque density of planetary units, and are penetrating aerospace, construction, and robotics where weight premiums are justified. Moog disclosed a 12% share in commercial-aircraft rotary drives by 2025, eroding demand for worm and bevel-helical gearboxes. Integrated hydraulic modules absorb shock loads without backlash, whereas mechanical alternatives need separate dampers. Fluid reservoirs, filtration, and thermal management raise complexity, limiting uptake in food-processing and pharma facilities. Gearbox vendors are prototyping hybrid electro-mechanical actuators that pair planetary stages with hydraulic dampers in a bid to reclaim share.
*Our forecasts treat driver/restraint impacts as directional, not additive. The impact forecasts reflect baseline growth, mix effects, and variable interactions.
Industrial Gearbox Market Segment Analysis
By Type:
Planetary Gains as Robotics ScalesPlanetary gearboxes are forecast to expand at a 4.71% CAGR through 2031 as robotics, precision machine tools, and solar trackers require high torque density in tight envelopes. Nabtesco controls over 60% of precision reduction gears, shipping strain-wave-free RV reducers that exceed 1 million cycles with zero backlash. Helical configurations delivered 37.58% of 2025 revenue, reflecting their versatility in conveyors, agitators, and general-purpose machinery.
The industrial gearbox market continues to prize helical designs for efficiency, low noise, and ease of maintenance, yet customers increasingly specify integrated sensors and IO-Link connectivity. Worm units retain niche roles where self-locking or extreme ratios are vital, such as elevator brakes and valve actuators. Bevel-helical styles transmit right-angle power for cooling-tower fans and vertical mixers, while cycloidal drives gain favor in precision indexing because of zero backlash and shock-load resilience. Online configurators launched in 2024 allow users to tailor torque, orientation, and lubrication, shrinking quote cycles from three days to one hour. Additive-manufactured, topology-optimized gear blanks further cut weight by 15-20%, enhancing power-to-mass ratios.


By End-User:
Energy Sector Outpaces ManufacturingManufacturing and machine tools held 33.21% of the industrial gearbox market share in 2025, anchored by CNC centers, injection-molding presses, and lathes that embed helical and planetary units in spindle and axis drives. The energy sector, however, is projected to log the fastest 4.92% CAGR through 2031 as offshore wind, pipeline compression, and green-hydrogen electrolyser projects proliferate.[4]
Multi-megawatt turbines rated at 15-20 MW require planetary stages with main bearings exceeding 4 m in diameter, stretching forging capacity, and supporting new investments such as Flender’s EUR 120 million Bocholt expansion. Oil-and-gas midstream operators specify 98%-efficiency gearbox trains to curb parasitic compressor losses. Electric-vehicle manufacturers are transitioning to single-speed reduction gears, standardizing on 9:1–11:1 coaxial helical designs that reach 96-97% efficiency. Mining, water, and wastewater plants continue to demand corrosion-resistant housings and IP66-plus ingress protection for harsh environments, though these segments grow at more modest rates tied to commodity cycles and municipal budgets.

Geography Analysis
APAC Industrial Gearbox Market
Asia-Pacific generated 43.63% of global revenue in 2025 and is projected to grow at a 4.68% CAGR through 2031, benefiting from China’s 330,000 industrial-robot installations in 2024 and the region’s dominant offshore-wind pipeline. India’s USD 1.4 trillion National Infrastructure Pipeline fosters demand for construction gearboxes, while the country’s wind capacity target of 140 GW by 2030 opens new opportunities for domestic suppliers. Japan and South Korea specialize in precision reducers for semiconductor tools and collaborative robots, and Vietnam has emerged as a lower-cost export base following Sumitomo’s 40,000 m² plant launch in 2024.
Europe Industrial Gearbox Market
Germany, Italy, and France are anchoring machine-tool and turbine supply chains in Europe. Germany’s EUR 8 billion offshore-wind program and the EU Machinery Regulation taking effect in 2027 drive uptake of IEC 62443-compliant smart gearboxes. Italy’s packaging-machinery cluster favors compact planetary units for high-speed filling lines, while Nordic electrolyser investments demand 98%-efficiency compressor gears to curb energy consumption. European suppliers increasingly use additive manufacturing to shorten prototype cycles and localize spare-part production.
The Americas and MEA Industrial Gearbox Market
Demand in North America is buoyed by warehouse-automation roll-outs, shale-gas infrastructure, and EV production ramp-ups. The U.S. Inflation Reduction Act’s 45X credit reimburses up to 25% of eligible gearbox manufacturing costs, catalyzing a USD 75 million Wisconsin expansion by Regal Rexnord in 2024. Canadian miners retrofit sensor-equipped drives to cut downtime, while Mexico’s EV transition fuels orders for single-speed reductions in battery-electric trucks. South America and the Middle East & Africa markets are dominated by Brazilian iron ore, Chilean copper, and Gulf desalination projects that demand corrosion-resistant gear trains.
Regulatory Landscape
Industrial gearbox suppliers face tighter design, documentation, and conformity requirements as standards and product-policy frameworks evolve across major manufacturing regions. In Europe, Regulation (EU) 2024/1781 (Ecodesign for Sustainable Products Regulation, adopted June 2024) expands ecodesign beyond energy use toward lifecycle sustainability and product information. In parallel, the European Commission (DG ENER) is reviewing Regulation (EU) 2019/1781 for electric motors and variable speed drives under the 2025-2030 working plan, with consultations running through mid-2026. This review is relevant for geared-motor packages and integrated drive selections.
Country-specific market access rules are also sharpening. India has mandated BIS Scheme X certification for gears and gearboxes under the Omnibus Technical Regulation Order, 2024, with a compliance deadline of August 28, 2025, raising entry requirements for imported transmission components. India has also indicated a mandatory energy efficiency labeling program for industrial machinery, including geared motors, with enforcement scheduled from Q3 2026. On the standards side, IEC 61400-4:2025 (April 2025) codifies design requirements for wind turbine gearboxes above 500 kW, and ISO 22109:2026 (February 2026) sets essential requirements for gearboxes used to operate industrial valves, reinforcing formal verification and conformity assessment for high-consequence applications.
Competitive Landscape
The industrial gearbox market remains moderately concentrated: the top 20 vendors hold about 55-60% of revenue, implying neither oligopoly nor fragmentation. Flender, Bonfiglioli, SEW-Eurodrive, and ZF maintain vertically integrated value chains encompassing gear cutting, heat treatment, and assembly, using digital-twin software to trim prototype iterations by up to 40%. Their global service footprints and mass-customization capabilities underpin customer loyalty in wind, factory automation, and e-mobility.
Regional specialists such as Elecon Engineering and Nanjing High Accurate Drive leverage localized service depots and cost-optimized helical designs to respond swiftly to demand spikes in mining, cement, and steel mills. Additive manufacturing is emerging as a white-space play: Renault Trucks cut helical-gear lead times from eight weeks to five days in 2025, validating on-demand production for obsolete or long-lead-time spares. Compliance with IEC 62443 cybersecurity standards has become a gating factor for smart-gearbox launches, favoring incumbents with in-house firmware teams.
Substitution risk from electro-hydraulic actuator vendors such as Parker Hannifin and Moog is noteworthy in aerospace and mobile equipment, where weight savings justify the 20-30% cost premium. Moog reached a 12% share of commercial-aircraft rotary drives in 2025, prompting gearbox makers to explore hybrid electromechanical concepts that integrate hydraulic dampers with planetary stages. Overall, pricing discipline, digital services, and rapid-response spare-parts logistics are key competitive levers.
Industrial Gearbox Industry Leaders
-
Sumitomo Drive Technologies
-
Flender International GmbH
-
ZF Friedrichshafen AG
-
Bonfiglioli Riduttori SpA
-
SEW-Eurodrive
- *Disclaimer: Major Players sorted in no particular order

Industrial Gearbox Market Companies Covered in this Report
- Flender International GmbH
- Bonfiglioli Riduttori SpA
- SEW-Eurodrive GmbH & Co KG
- Sumitomo Drive Technologies
- ZF Friedrichshafen AG
- Getriebebau NORD GmbH
- Liebherr-Components
- DB Santasalo
- Regal Rexnord Corporation
- Tandler Zahnrad- & Getriebefabrik
- Nanjing High Accurate Drive
- Emerson Power Transmission (Baldor-Dodge)
- Renold plc
- Dana Brevini
- Cone Drive (Timken)
- Nabtesco Corporation
- Elecon Engineering
- Jiangsu Tailong Decelerator
- Rossi SpA
- Zollern GmbH & Co KG
Market Opportunities and Future Outlook
Wind and energy-transition programs are expanding the addressable space for large-frame industrial gear units and related services, including validation, condition monitoring, and lifecycle support. India is a visible hotspot for capability build-out. ZF Wind Power completed a capacity expansion at Coimbatore that lifted annual gearbox capacity from 9 GW to 12 GW (mid-2025) and commissioned a 13 MW test rig (early 2025). Flender India installed a wind turbine gearbox testing facility at Walajabad (March 2026) to validate gearboxes up to 13.5 MW.
These capacity additions point to opportunities for localized testing, faster qualification cycles, and higher-value aftermarket offerings tied to offshore and larger onshore turbine platforms. More broadly, opportunities are clustering around modularization and digital integration that reduce commissioning time and improve uptime in intralogistics, mining, and continuous-process plants. Product roadmaps such as the February 2026 expansion of the Flender One gear unit platform (two-stage to four-stage variants, up to 4,807 kW and 153,000 Nm) show vendor investment in scalable architectures that can be configured across conveyors, crushers, compressors, and large pumps. Smart-gearbox adoption remains gated by cybersecurity and documentation needs, which creates room for suppliers that package IEC 62443-aligned connectivity, condition monitoring, and service contracts into standardized, auditable solutions for global OEMs and end users.
Recent Industry Developments in Industrial Gearbox Market
- June 2026: Triton Partners announced an agreement to acquire Flender from Carlyle, with the transaction subject to regulatory approvals and targeted to close in Q4 2026. A change in ownership can reshape capital allocation for capacity, R&D, and service-network investments across Flender's industrial and wind drivetrain portfolios.
- August 2025: Flender announced the acquisition of the gear service business of Wartsila Brasil in Cabo de Santo Agostinho, including wind gearbox testing capabilities, with unconditional approval from Brazil's antitrust authority CADE. The deal expands localized service and testing coverage in South America, supporting faster turnaround for repairs and lifecycle services for high-value gear units.
- June 2024: Siemens Mobility opened a new gearbox line in Cornella, Spain, with an annual capacity of 500 heavy rail drives. Added rail-gearbox output increases competitive intensity in transport-adjacent drivetrain applications and deepens regional manufacturing depth for gearbox assemblies.
Industrial Gearbox Market Report Scope and Research Methodology
Market Definition and Coverage
For this study, the industrial gearbox market is defined as revenue earned from gearboxes used in industrial power transmission, where torque and speed are adjusted to run equipment reliably across heavy-duty applications.
Scope exclusions: We exclude gearboxes that are sold as part of consumer appliances, passenger vehicle drivetrains, and other non-industrial transmission assemblies where the buying decision is not tied to industrial equipment cycles.
Segments Covered in This Report
- By Type
- Worm
- Helical
- Bevel-Helical
- Planetary
- Other Types
- By End-user
- Automotive and E-Mobility
- Energy
- Manufacturing and Machine Tools
- Mining and Metallurgy
- Water and Waste-water Treatment
- Other End-Users
- By Geography
- North America
- United States
- Canada
- Mexico
- Europe
- Germany
- United Kingdom
- France
- Italy
- Spain
- NORDIC Countries
- Russia
- Rest of Europe
- Asia-Pacific
- China
- India
- Japan
- South Korea
- ASEAN
- Rest of Asia-Pacific
- South America
- Brazil
- Argentina
- Colombia
- Rest of South America
- Middle East and Africa
- Saudi Arabia
- United Arab Emirates
- South Africa
- Egypt
- Rest of Middle East and Africa
- North America
Data Sources, Market Sizing, and Validation
Desk Research
Desk research starts by mapping where industrial gearboxes are actually demanded, and then aligning that demand to visible data series that can be checked year over year. We referenced public sources such as U.S. Census Bureau manufacturing data, Eurostat industrial production, UN Comtrade trade statistics, and International Energy Agency indicators for power and industry activity. Where industry context was needed, we also used association websites and standards bodies information, plus company annual reports, investor presentations, and earnings commentary to understand end-market exposure.
To reduce guesswork on company scale and regional footprint, we used a paid subscription for company financials and news screening, and a separate paid patent database to spot product and efficiency focus areas that influence pricing trends. The desk sources listed here are illustrative only, and many other public sources were reviewed to collect, validate, and clarify the data points used in the model.
Primary Interviews and Surveys
Primary work was used to pressure-test the desk assumptions, especially around replacement cycles, OEM versus aftermarket split, and how pricing moves with energy and metal costs. We spoke with a mix of gearbox suppliers, distributors, and industrial end users across major manufacturing hubs, so the model inputs reflect how buying volumes and lead times change in real projects. Follow-ups were done when desk signals and interview feedback did not align, which helped us tighten the final ranges.
Distribution of primary research fieldwork respondents
| Company type | Respondent position | Region |
|---|---|---|
| Top tier: 36% | CXOs: 15% | APAC: 37% |
| Mid tier: 46% | Functional/Unit leaders: 36% | EMEA: 36% |
| Smaller Players: 18% | Managers: 49% | Americas: 27% |
Market-Sizing & Forecasting
Sizing begins with a top-down build where industrial activity is translated into a gearbox demand pool, and then filtered by adoption and replacement needs by end-use. Practical inputs used in the model include industrial production trends, capex intensity in sectors like mining and energy, installed base aging for rotating equipment, share of geared versus direct-drive setups, and observed price bands by gearbox type and torque class. When market signals were uneven across regions, we used conservative ranges first, then narrowed them using interview feedback.
To keep totals realistic, we corroborated the top-down result with selective bottom-up approximations, such as sampled supplier revenue splits, channel checks on shipment momentum, and ASP multiplied by estimated unit volumes for a few high-use applications. Gaps that appear in smaller countries or niche end uses were handled through proxy indicators, like import patterns and plant expansion announcements, before being normalized back to the regional total. For forecasting, we ran scenario analysis tied to industrial output and energy and mining project cycles, with assumptions tuned to what respondents expect for order pipelines and replacement demand.
Data Validation & Update Cycle
Validation is done by checking whether the model behaves like the real market, so we compare outputs with independent signals such as industrial production movement, trade flows for relevant equipment categories, and disclosed order trends from major suppliers. Any sharp year-to-year step changes are flagged, and then reviewed by another analyst to confirm whether they are driven by a real event or a modeling artifact. When a variance cannot be explained, we re-contact selected interviewees and revisit the input ranges before final sign-off.
Reports are refreshed annually, and interim updates are made when material events occur, such as major policy shifts, large industrial investment cycles, or meaningful changes in commodity and energy pricing that affect capex. Before delivery, a final review pass is completed so clients receive the most current view tied back to the underlying assumptions.
Mordor Intelligence's Industrial Gearbox Market Size Compared With Other Published Estimates
Published market sizes for industrial gearboxes often vary because each publisher draws the market boundary differently and uses its own mix of activity indicators and pricing logic. Some estimates lean more on shipment-led views, while others lean more on broad industrial machinery spend, which can pull in adjacent power transmission items.
Key gaps usually come from what gets counted as an industrial gearbox sale (OEM-only versus OEM plus aftermarket), how multi-year projects are timed into annual revenue, and how price changes are treated across types like helical, planetary, and bevel helical. Differences also show up when currency conversion timing and the last update date are not aligned to the same reference year, since industrial capex conditions can move quickly by region.
Benchmark comparison
| Source | Market Size | Gaps in Research Methodology |
|---|---|---|
| Mordor Intelligence | USD 30.41 B (2025) | |
| Global Consultancy A | USD 31.90 B (2025) | This estimate appears to apply a broader industrial power transmission scope and a higher starting ASP set, which can lift the 2025 total even if unit demand assumptions are similar. |
| Industry Publisher B | USD 32.90 B (2025) | This figure likely includes a wider set of end-use applications and uses more optimistic pricing progression into the base year, which increases reported revenue versus a tighter definition. |
The spread across sources is mainly explained by how tightly the product scope is separated from adjacent transmission components, plus how OEM and aftermarket revenue are treated in the base year. By tying demand to industrial output and replacement-driven consumption, and keeping pricing checks anchored to interview-based ranges, the scope stays narrower and more repeatable, which is the approach applied by Mordor Intelligence.
Key Questions Answered in the Report
How large will the industrial gearbox market be by 2031?
It is expected to reach USD 38.49 billion, reflecting a 3.99% CAGR from 2026 to 2031.
Which gearbox type is growing the fastest?
Planetary units are projected to expand at 4.71% CAGR, driven by robot and precision-machine applications.
What end-use sector offers the strongest growth prospects?
The energy segment, including wind turbines and green-hydrogen compressors, is forecast to post the highest 4.92% CAGR to 2031.
Which region dominates demand for industrial gearboxes?
Asia-Pacific generated 43.63% of global revenue in 2025 and is poised to grow at 4.68% CAGR, maintaining regional leadership.
What is the main technology trend shaping new gearbox designs?
Integration of sensors and edge-compute modules that enable predictive maintenance and Industry 4.0 connectivity is redefining product roadmaps.
How are steel-price swings affecting manufacturers?
Volatile coil pricing shaved 2-3 percentage points off margins in 2024-2025 for firms without hedging, prompting greater use of additive manufacturing to reduce material waste.