
Industrial Gas Turbine Market Size and Share
Market Overview
| Study Period | 2021 - 2031 |
|---|---|
| Market Size (2026) | USD 10.35 Billion |
| Market Size (2031) | USD 14.14 Billion |
| Growth Rate (2026 - 2031) | 6.45 % |
| Fastest Growing Market | Asia Pacific |
| Largest Market | Asia Pacific |
| Market Concentration | High |
Major Players *Disclaimer: Major Players sorted in no particular order Image © Mordor Intelligence. Reuse requires attribution under CC BY 4.0. | |
Industrial Gas Turbine Market Analysis by Mordor Intelligence
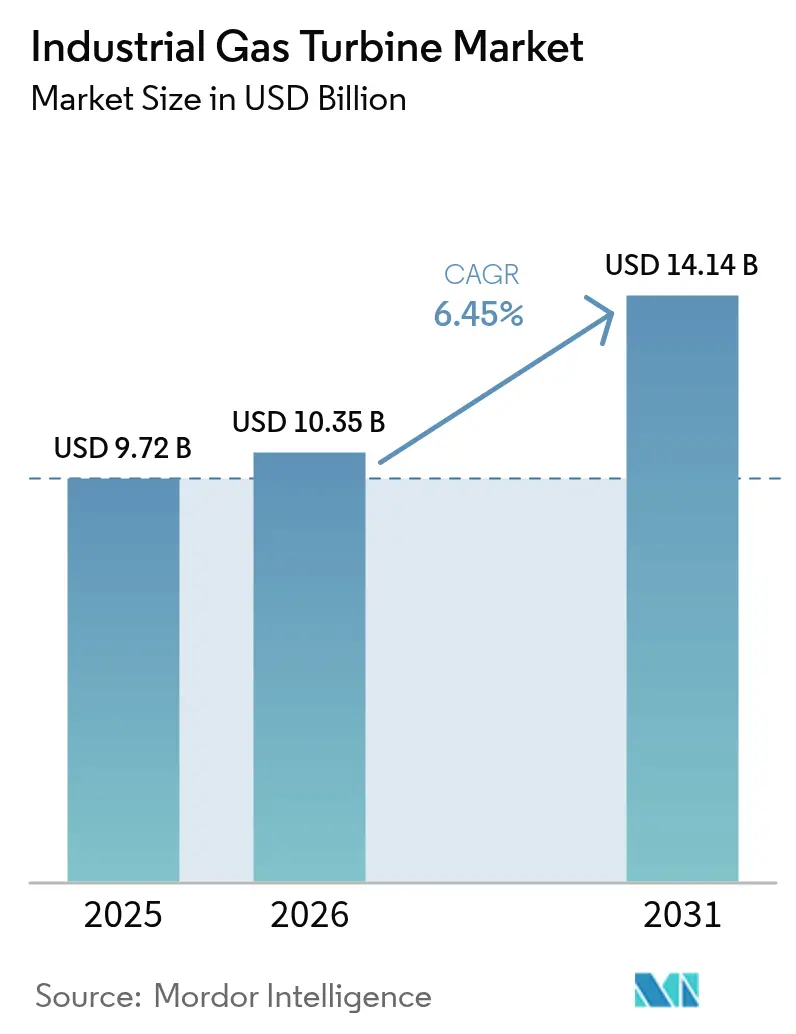
Industrial Gas Turbine Market size in 2026 is estimated at USD 10.35 billion, growing from 2025 value of USD 9.72 billion with 2031 projections showing USD 14.14 billion, growing at 6.45% CAGR over 2026-2031.
Rapid growth in electricity demand from digital infrastructure, the adoption of hydrogen-ready technology, and utilities’ push for lower-carbon baseload capacity continue to keep the industrial gas turbine market on an upward trajectory. Large-scale capacity additions, particularly in the Asia-Pacific region, align with surging demand for flexible backup generation that complements the rapid growth of renewables. Data-center combined heat and power (CHP) projects, above-300 MW turbines’ efficiency leadership, and mobile modular units for climate-resilient grids collectively reinforce market momentum. Meanwhile, OEMs are racing to mitigate forging and super-alloy constraints, expand their regional production footprints, and validate 100% hydrogen capability to secure long-term relevance.
Key Report Takeaways
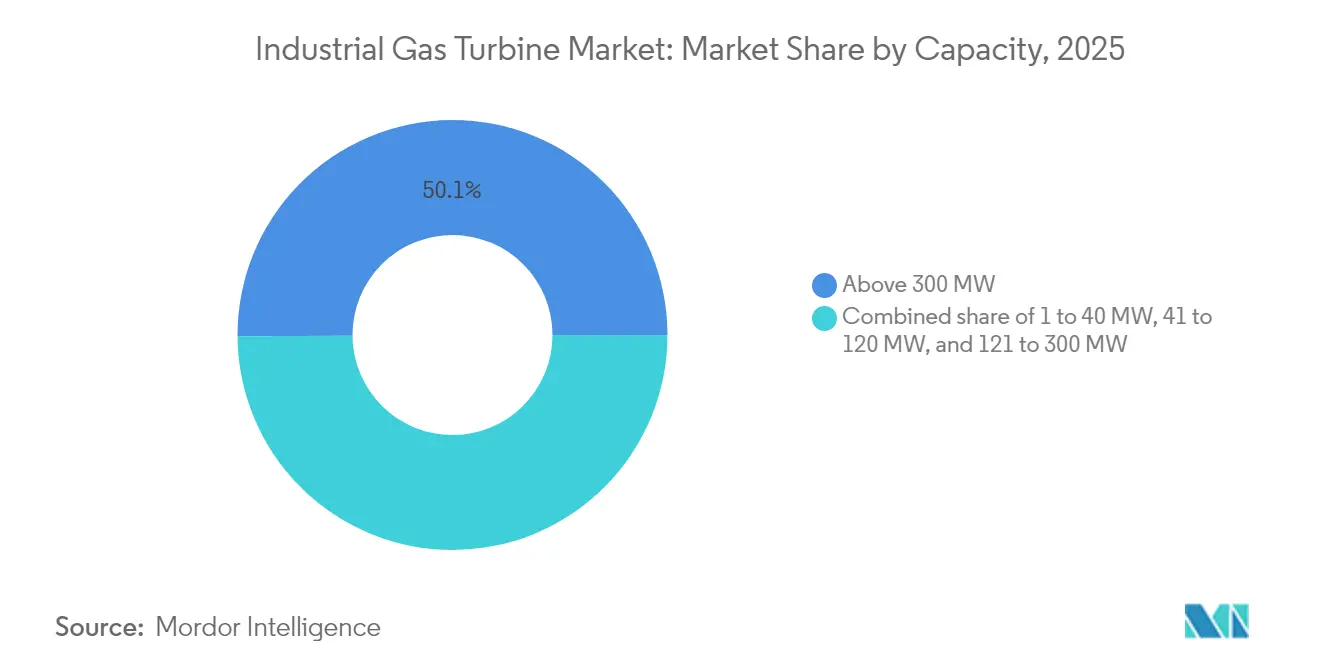
- By capacity, above-300 MW units led the industrial gas turbine market with 50.10% of the market share in 2025, while the 120–300 MW segment is projected to grow at a 9.42% CAGR through 2031.
- By frame type, heavy-duty machines accounted for 69.20% of 2025 revenue; aero-derivative units are projected to exhibit the highest CAGR of 8.2% through 2031.
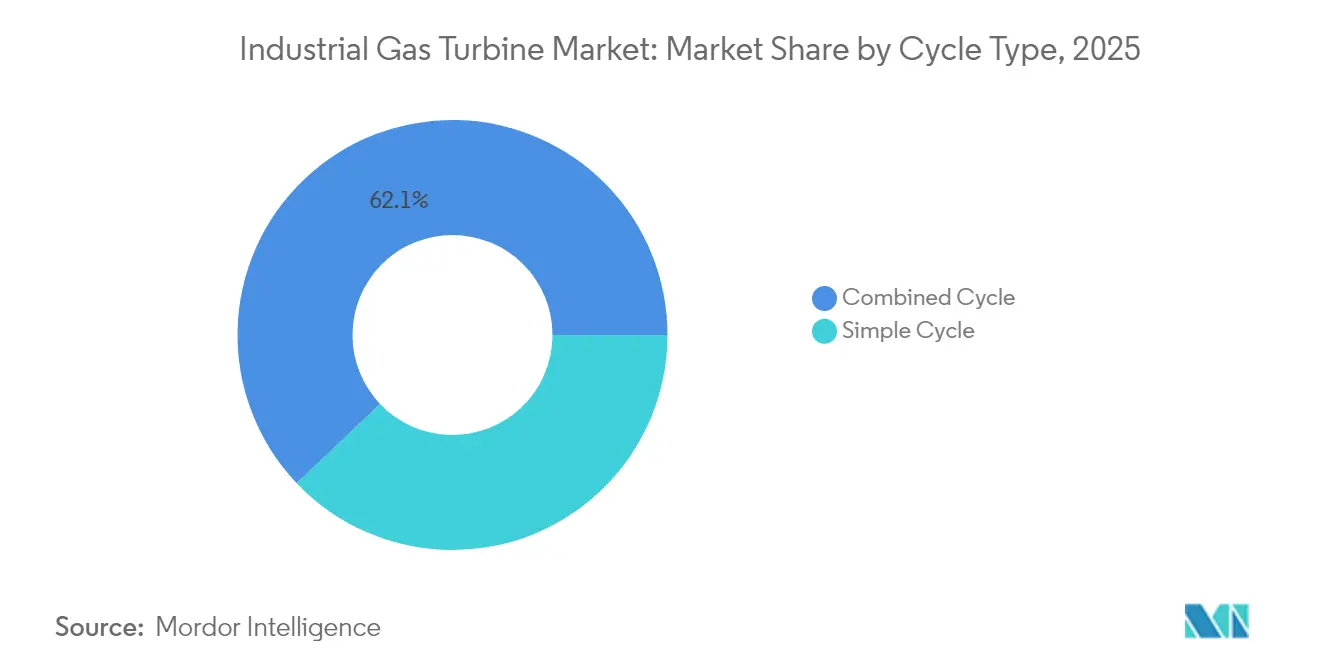
- By cycle, combined-cycle systems captured 62.10% of the industrial gas turbine market size in 2025 and are forecast to grow at a 7.25% CAGR between 2026 and 2031.
- By application, power utilities commanded 70.20% of the 2025 revenue, whereas industrial CHP is projected to advance at a 8.95% CAGR to 2031.
- By geography, Asia-Pacific accounted for 45.60% of global revenue in 2025 and is set to expand at a 6.75% CAGR through 2031.
Note: Market size and forecast figures in this report are generated using Mordor Intelligence’s proprietary estimation framework, updated with the latest available data and insights as of 2026.
Market Trends and Insights
Drivers Impact Analysis of Industrial Gas Turbine Market*
| Driver | (~) % Impact on CAGR Forecast | Geographic Relevance | Impact Timeline |
|---|---|---|---|
| Rising power demand in emerging economies | +1.80% | Asia-Pacific, Middle East, Africa | Medium term (2–4 years) |
| Coal-to-gas shift in utility generation mix | +1.50% | Global, concentration in Asia-Pacific and Eastern Europe | Long term (≥ 4 years) |
| Renewable-balancing flexibility needs | +1.20% | Global, especially Europe and North America | Short term (≤ 2 years) |
| Data-center CHP build-out surge | +1.00% | North America, Europe, Asia-Pacific | Short term (≤ 2 years) |
| Hydrogen-ready industrial retrofits | +0.80% | Europe, North America, Australia | Long term (≥ 4 years) |
| Mobile modular turbines for climate-resilient grids | +0.40% | Global, disaster-prone regions | Medium term (2–4 years) |
| Source: Mordor Intelligence | |||
Rising Power Demand in Emerging Economies
Nigeria’s 1,350 MW plant, Vietnam’s plan for 84 GW of LNG-based capacity by 2035, and Tanzania’s first combined-cycle facility illustrate how developing nations leapfrog to cleaner gas technology to meet industrialization-driven consumption spikes. Export-credit agencies and multilateral lenders, such as the U.S. International Development Finance Corporation, underpin project bankability, accelerating turbine orders across sub-Saharan Africa. Given their fast-ramp capability and lower particulate emissions compared to coal, regional policymakers view gas turbines as pragmatic complements to renewables.(1)
Coal-to-Gas Shift in Utility Generation Mix
Utilities replacing coal with high-efficiency combined-cycle plants report up to 70% CO₂ reductions and capital cost savings of 30% versus greenfield builds by reusing existing infrastructure. Asian projects such as Guangdong Huizhou deploy 9HA-class turbines capable of 10% hydrogen blends today, with roadmaps to 100%, aligning national decarbonization policies with grid reliability. Cumulative coal-to-gas conversions have already averted 500 million t of CO₂ since 2010, underscoring the transition’s climate significance.
Renewable-Balancing Flexibility Needs
Gas turbines’ sub-5-minute start-up windows provide critical ancillary services as wind and solar penetration climb. A 48 MW UK peaking plant achieves full output in 2.5 minutes, balancing intermittent renewables for 20,000 homes. New designs emphasize fast cycling and part-load efficiency, while hybrid configurations pair aeroderivative turbines with battery systems for multi-hour resilience.
Data-Center CHP Build-Out Surge
AI-driven data centers could require 1,000 TWh by 2030, comparable to Japan’s total electricity demand, and investors are turning to gas turbine-based CHP for reliable, efficient on-site power.(2) LM2500XPRESS packages replace fleets of diesel gensets, cut energy costs by up to 60%, and already operate on hydrogen blends. A USD 10 billion Pennsylvania campus will pair seven 7HA.02 turbines with carbon capture to supply hyperscale compute loads.
Restraints Impact Analysis of Industrial Gas Turbine Market*
| Restraint | (~) % Impact on CAGR Forecast | Geographic Relevance | Impact Timeline |
|---|---|---|---|
| Renewables’ LCOE under-cutting gas | -1.40% | Global, notably Europe and North America | Short term (≤ 2 years) |
| Natural-gas price volatility | -0.90% | Global, highest in import-dependent regions | Medium term (2–4 years) |
| Carbon-border tariffs on gas-based exports | -0.60% | Europe with global spillover | Long term (≥ 4 years) |
| Forging & super-alloy supply-chain bottlenecks | -0.80% | Global, tech-manufacturing hubs | Medium term (2–4 years) |
| Source: Mordor Intelligence | |||
Renewables’ LCOE Under-Cutting Gas
Solar PV costs have plummeted by 90% since 2010 to USD 0.044/kWh, and 81% of new renewables outperform fossil alternatives in price in 2023. Dispatchable value keeps combined-cycle plants competitive where grid services command a premium. Gas turbines, therefore, pivot from baseload to flexible peakers, demanding design upgrades for rapid cycling.
Natural-Gas Price Volatility
LNG spot prices swung 21% up then 29% down within Q4 2023, underscoring geopolitical risk. Forward curves indicate 2025 Asian LNG at USD 13/mmBtu, which is double India’s regulated price, prompting buyers to opt for long-term contracts and diversified fuels.(3) OEMs answer the uncertainty with dual-fuel capability and higher hydrogen blend limits.
*Our forecasts treat driver/restraint impacts as directional, not additive. The impact forecasts reflect baseline growth, mix effects, and variable interactions.
Industrial Gas Turbine Market Segment Analysis
By Capacity:
Utility-Scale Units Dominate While Mid-Range Turbines SurgeAbove-300 MW machines accounted for 50.10% of the industrial gas turbine market share in 2025, favored for their capital efficiency and readiness for carbon capture. A flagship 5,300 MW Thai complex using eight M701JAC units illustrates the scale benefits of these giants. In parallel, the 120-300 MW class, the fastest-growing segment at a 9.42% CAGR, caters to modular power schemes, microgrids, and distributed generation. Such projects align perfectly with climate-resilient grid strategies and staged investment models. Supply chain limitations constrain ultralarge frame production slots until 2031, driving customers toward the mid-range, where lead times are shorter and shipment logistics simpler.
OEMs continuously refine combustion systems for both classes, initially targeting 50% hydrogen blends and pathways to 100% by upgrading burners and control software. The mid-range units' industrial gas turbine market size is projected to expand significantly as governments incentivize the rapid deployment of low-carbon capacity.

By Frame Type:
Heavy-Duty Reliability Outweighs Aero-Derivative Agility—Yet Growth Favors the LatterHeavy-duty configurations secured 69.20% of 2025 revenue, a testament to their multidecade lifecycle in baseload service. Efficiency now exceeds 64% in combined-cycle mode with the latest HL platforms. Aero-derivative packages, which account for just 30.80% of revenue, are expected to expand at an 8.2% CAGR through 2031, driven by demand for 10-50 MW blocks that can cold-start in minutes. LM2500XPRESS units, for instance, shave construction schedules by 40% and accept 35% green hydrogen from day one. Heavy-duty vendors address this by modularizing auxiliary skids and shortening outage windows, thereby narrowing the total-cost-of-ownership gaps with the aero-fleet.
By Cycle:
Combined Cycle Efficiency Drives Market PreferenceCombined cycle units accounted for 62.10% of the industrial gas turbine market share in 2025 and are projected to record a 7.25% CAGR during 2026–2031, underscoring their clear cost-to-performance edge over simple-cycle alternatives. Their ability to push facility efficiencies beyond 60% by harvesting exhaust heat for steam generation cements their role in baseload and intermediate duty, especially where carbon regulations favor high thermal performance. Projects such as Saudi Arabia’s Taiba and Qassim complexes demonstrate how utilities can fast-track multi-gigawatt expansions while reducing CO₂ emissions by 60% compared to oil-fired plants. Simple-cycle packages remain relevant for peaking service, emergency backup, and markets that prize rapid dispatch at lower upfront cost.
Continuous upgrades to heat-recovery steam generators and tighter steam-turbine integration shrink installation windows and boost operating flexibility. China’s Zhoushan plant illustrates the trajectory: its 9HA.02 turbines began service on a 10% hydrogen blend with scope to reach 50%, proving combined-cycle assets can migrate toward cleaner fuels without sacrificing efficiency. Modular balance-of-plant skids and factory-finished HRSG sections compress construction schedules, a decisive benefit as grid operators rush to pair high-renewable penetration with firm capacity. As a result, the combined-cycle slice of the industrial gas turbine market size is expected to expand in absolute terms, even as simple-cycle orders remain steady in niche applications.
By Application:
Power Utilities Lead While Industrial CHP AcceleratesPower utilities dominated the sector, accounting for 70.20% of the industrial gas turbine market size in 2025, reflecting the continual expansion of the grid and the replacement of aging coal assets. Large integrated utilities value turbine durability, high efficiency, and compatibility with emerging carbon capture systems as they modernize their baseload fleets. In contrast, industrial combined heat and power (CHP) is the fastest riser, with a 8.95% CAGR through 2031, driven by energy-intensive manufacturers seeking efficiency gains and lower Scope 1 emissions. The switch from coal boilers to gas-turbine CHP at Tate & Lyle’s plant lifted overall efficiency above 80% while sharply reducing pollutants, showcasing the segment’s economic rationale.
Industrial CHP economics remain compelling: facilities capture 20–60% in energy-cost savings and trim demand charges by more than 40% compared to separate heat-and-power configurations. Data centers now form a high-growth subsegment, repurposing turbine exhaust for absorption chillers that support rack cooling. U.S. Environmental Protection Agency studies confirm that gas-turbine CHP can achieve an overall efficiency of 80% or higher, a metric prized by regulators and investors. In marine propulsion, Baker Hughes and Hanwha’s small ammonia-fueled turbine under development mirrors the wider market pivot toward cleaner fuels. Collectively, these trends position CHP and specialized industrial uses to claim a larger share of the industrial gas turbine market, even as the utility segment retains its volume leadership.
Geography Analysis
APAC Industrial Gas Turbine Market
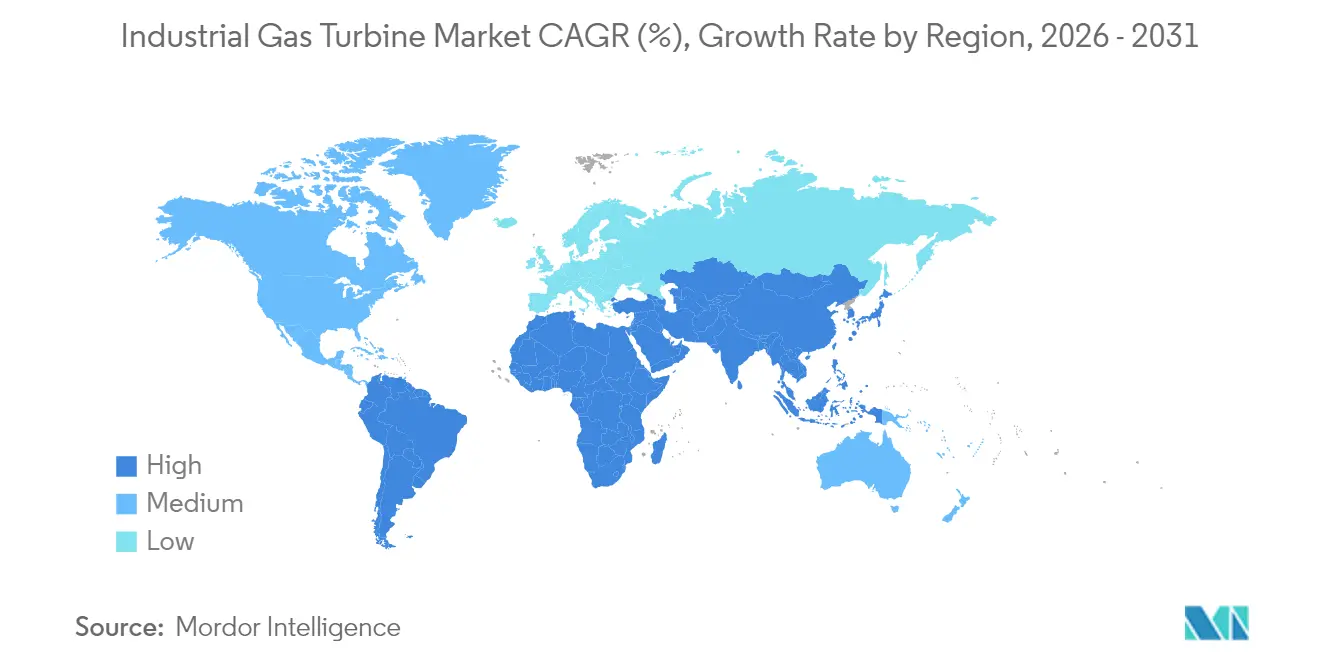
The Asia-Pacific region accounted for 45.60% of global revenue in 2025, driven by coal-to-gas transitions, relentless urbanization, and state-backed investment. China's hydrogen-ready Zhoushan project and Vietnam's 84 GW LNG roadmap exemplify policy commitment to swift decarbonization without compromising energy security. India's upgrading of gas pipeline infrastructure and Australia's peaking-plant mandates further reinforce regional appetite. The Asia-Pacific's industrial gas turbine market is the world's largest and is projected to grow at a 6.75% CAGR in the region.
The Americas and EMEA Industrial Gas Turbine Market
North America's mature fleet continues to expand through data center CHP and renewable projects. Duke Energy's booking of up to 11 American-made 7HA turbines speaks to robust domestic demand, heavy states. Europe's focus has shifted to hydrogen readiness and carbon-capture-enabled technologies, as seen in EnBW's Stuttgart-Münster installation. In the Middle East, Vision 2030 initiatives translate into multigigawatt tenders in Saudi Arabia and the UAE, where natural gas remains a strategic bridge fuel. Africa showcases several projects, such as Nigeria's 1,350 MW plant, which will supply 11% of the nation's demand. South America selectively adds high-efficiency combined-cycle stations, with Brazil emphasizing dispatchable capacity to firm its hydro-dominant grid.
Regulatory Landscape
Emissions regulation remains a primary compliance driver for new industrial gas turbine installations, particularly in jurisdictions where permitting depends on Best System of Emission Reduction (BSER) determinations. In the United States, the Environmental Protection Agency (EPA) finalized amendments in January 2026 to the New Source Performance Standards (NSPS) for stationary combustion turbines (40 CFR Part 60, Subpart KKKKa), updating NOx limits for turbines constructed, modified, or reconstructed after December 13, 2024. The rule differentiates requirements by utilization class and use case (including temporary units), which reinforces demand for combustion controls and selective catalytic reduction (SCR) on new high-utilization builds.
In Europe, environmental performance and disclosure obligations are tightening through digital reporting infrastructure that affects both operators and OEM service ecosystems. Regulation (EU) 2024/1244 sets updated rules for reporting environmental data from industrial installations through the Industrial Emissions Portal, pushing sites toward more structured monitoring and data management. Together, these changes raise the bar for permitting, performance testing, and ongoing reporting, and they increase the value of OEM-supported controls upgrades and long-term service arrangements that help keep emissions performance within regulated thresholds.
Competitive Landscape
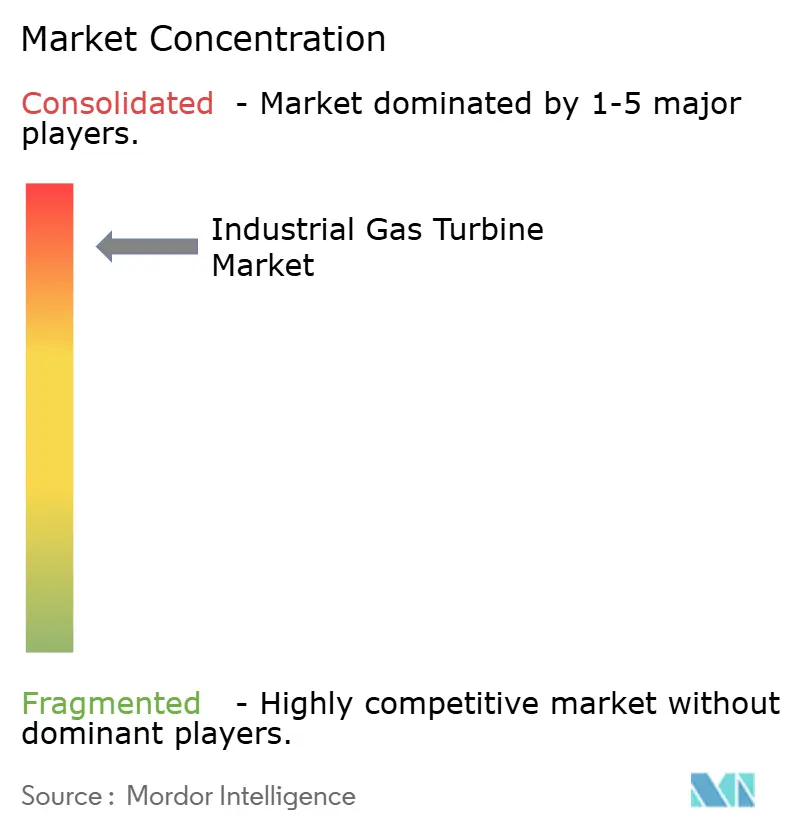
GE Vernova, Siemens Energy, and Mitsubishi Power collectively hold about 70% of the global industrial gas turbine market share, producing frames from 5 to 575 MW. Supply chain stress hiked new-build lead times to as much as five years, prompting GE Vernova’s USD 600 million Greenville expansion and Siemens Energy’s tooling reshoring for hot-gas-path components.(4) Strategic alliances are proliferating: Baker Hughes teams with Hanwha on small ammonia turbines, while IHI partners with GE Vernova on ammonia combustors, accelerating alternative-fuel roadmaps.
Aftermarket service, worth a cumulative USD 302 billion this decade, drives consolidation. One Equity Partners’ acquisition of EthosEnergy broadens turbine-overhaul capacity to meet swelling demand from fleets commissioned in the 2000s. Mobile solutions and data-center CHP represent white-space arenas where niche aero-derivative specialists compete fiercely with traditional utility-scale OEMs. Competitive differentiation is sharpening around validated 100% hydrogen firing, integrated digital twins, and carbon-capture-ready islanded blocks.
Industrial Gas Turbine Industry Leaders
-
Siemens AG
-
Mitsubishi Heavy Industries Ltd
-
Harbin Electric International Company Limited
-
Kawasaki Heavy Industries Ltd
-
General Electric Company
- *Disclaimer: Major Players sorted in no particular order
Industrial Gas Turbine Market Companies Covered in this Report
- GE Vernova (General Electric)
- Siemens Energy
- Mitsubishi Power
- Ansaldo Energia
- Harbin Electric
- Bharat Heavy Electricals
- Kawasaki Heavy Industries
- Solar Turbines (Caterpillar)
- MAN Energy Solutions
- MTU Aero / Vericor
- Baker Hughes
- Rolls-Royce Power Systems
- Doosan Enerbility
- Shanghai Electric
- Capstone Green Energy
- OPRA Turbines
- Triveni Turbines
- Alstom (GE Gas Power heritage)
- Elliott Group
- Centrax Industries
Market Opportunities and Future Outlook
One opportunity area sits at the overlap of rapid-load growth (especially digital infrastructure) and constrained turbine supply, where delivery slots, service coverage, and standardized, modularized solutions are becoming key commercial differentiators. OEM backlogs and announced production ramp-ups point to a market that rewards near-term manufacturability and bankable execution. In April 2026, GE Vernova reported a gas turbine backlog reaching 100 GW in Q1 2026 (up from 83 GW at end-2025), highlighting the availability premium for heavy-duty and aeroderivative frames, and the pull-through of long-term service agreements bundled with equipment. This dynamic also supports whitespace for EPCs and OEMs able to deliver factory-packaged balance-of-plant, faster commissioning pathways, and contracted availability for high-uptime users such as data center CHP.
Fuel-flexibility and decarbonization-enabling capability upgrades form a second opportunity lane as hydrogen readiness moves from roadmap language into field programs and first-of-a-kind operations. In the United States, ACES Delta and Mitsubishi Power plan to begin hydrogen blending and injection in Q2 2026 at the Utah project using M501JAC turbines, which creates a practical pull for retrofit kits, controls tuning, and emissions solutions designed to preserve fast-ramping performance. In China, a 30 MW-class pure hydrogen gas turbine (Mingyang Hydrogen, Jupiter-1) was commissioned into operation in Inner Mongolia in December 2025, indicating broader scope for hydrogen-capable combustion systems, validation services, and supply-chain localization around burners, hot-gas-path materials, and monitoring instrumentation.
Recent Industry Developments in Industrial Gas Turbine Market
- July 2026: Siemens Energy announced it will provide six F-class gas turbines, six generators, and 20-year service agreements for the Misfah and Duqm independent power producer projects in Oman (2.6 GW). The combined equipment-plus-service scope strengthens Siemens Energy\'s long-cycle revenue visibility while anchoring a large block of regional combined-cycle capacity buildout.
- May 2026: GE Vernova and ENKA marked the start of commercial operation of the 852 MW Kirklareli power plant in Turkije, which includes the country\'s first 9HA.02 gas turbine. The commissioning expands the reference base for HA-class units and reinforces the market shift toward high-efficiency combined-cycle additions tied to grid reliability and fuel-transition programs.
- May 2025: GE Vernova secured a multi-year contract in Saudi Arabia to supply heavy-duty gas turbines manufactured in Greenville, supporting Saudi Vision 2030. The agreement signals continued OEM activity in the Middle East and reinforces capacity-building across critical power infrastructure projects.
Industrial Gas Turbine Market Report Scope and Research Methodology
Market Definition and Coverage
This market covers revenues generated from industrial gas turbines used to convert fuel into mechanical power or electricity for industrial facilities and grid-linked power generation, including equipment sales across common capacity ranges and cycle configurations.
Scope exclusions: This sizing does not treat upstream fuel supply, EPC plant construction works, or long-term operations labor as part of turbine market revenue.
Segments Covered in This Report
- By Capacity
- 1 to 40 MW
- 41 to 120 MW
- 121 to 300 MW
- Above 300 MW
- By Frame Type
- Aero-derivative
- Heavy-duty
- By Cycle
- Simple Cycle
- Combined Cycle
- By Application
- Power Utilities
- Oil and Gas
- Industrial CHP
- Marine and Others
- By Geography
- North America
- United States
- Canada
- Mexico
- Europe
- Germany
- United Kingdom
- France
- Italy
- Spain
- Russia
- Rest of Europe
- Asia Pacific
- China
- India
- Japan
- South Korea
- ASEAN Countries
- Australia
- Rest of Asia Pacific
- South America
- Argentina
- Brazil
- Rest of South America
- Middle East and Africa
- Saudi Arabia
- United Arab Emirates
- South Africa
- Rest of Middle East and Africa
- North America
Data Sources, Market Sizing, and Validation
Desk Research
Desk research was used to set the factual backbone before we modeled demand and pricing. We leaned on public energy and macro data such as the International Energy Agency (IEA), U.S. Energy Information Administration (EIA), World Bank, and International Monetary Fund (IMF), which help explain power demand direction, industrial output, and fuel price movement.
We also used statistics and publications from sources such as the International Renewable Energy Agency (IRENA), UN Comtrade, and national energy ministries and regulators, mainly to sense-check trade flows, installed capacity additions, and policy-driven project pipelines. Company annual reports, investor presentations, and credible press releases were read to understand product positioning, delivery timelines, and regional exposure. A paid subscription for company financials and news was used selectively to cross-check revenue splits and event timing. These examples are not exhaustive, and many other public sources were reviewed for data collection, validation, and clarification.
Primary Interviews and Surveys
Primary conversations were run with industrial gas turbine OEM and component experts, EPC and project engineering teams, plant operators, and industrial end users. The goal was to anchor pricing, lead times, and utilization assumptions to what is being seen in real procurement and replacement schedules. Since this is a global market, we also checked regional differences in project cadence, service intensity, and currency impacts across APAC, EMEA, and the Americas before finalizing the model inputs.
Distribution of primary research fieldwork respondents
| Company type | Respondent position | Region |
|---|---|---|
| Top tier: 29% | CXOs: 13% | APAC: 46% |
| Mid tier: 53% | Functional/Unit leaders: 32% | EMEA: 36% |
| Smaller Players: 18% | Managers: 55% | Americas: 18% |
Market-Sizing & Forecasting
The core sizing starts with a top-down build where power additions and industrial demand signals are reconstructed into a realistic turbine demand pool by capacity class and cycle type, then translated into revenue using price bands. To keep the totals practical, we corroborated the output with selective bottom-up approximations such as sampled unit shipments by capacity range, typical contract ASPs, and channel checks from project announcements and operator replacements.
Key model inputs included annual gas-fired capacity additions and retirements, industrial electricity demand growth, order backlog and delivery lead times, average selling price progression by capacity bracket, and the mix shift between simple cycle and combined cycle installations. In places where unit counts were unclear, we used proxy indicators like country-level project pipelines and capacity utilization trends, and then narrowed the range through interview feedback.
For forecasting, scenario analysis was applied around fuel price direction, grid reliability needs, and industrial capex cycles, followed by smoothing on the final series so year-to-year swings match how turbine projects typically land in batches. Assumptions on ASP and mix were revisited during forecasting so the model does not overreact to a single year of large orders.
Data Validation & Update Cycle
Outputs were checked against independent signals such as regional capacity additions, known project awards, and typical replacement cycles, and then variances were investigated before the numbers were finalized. When a segment result looked off, we re-checked unit assumptions, re-tested price bands, and re-contacted selected experts to confirm whether the change was real or timing related.
A second analyst review is completed for calculation logic, scope consistency, and currency conversions, and only then is the final view signed off. Reports are refreshed annually, and interim updates are made when material events occur, such as large policy moves, major order announcements, or sharp FX changes. Before delivery, a final pass is done to ensure the latest public developments are reflected in the model.
Mordor Intelligence's Industrial Gas Turbine Market Size Compared With Other Published Estimates
Published market values for industrial gas turbines often do not match perfectly because the timing and the counting rules differ across studies, even when they use similar labels. The biggest drivers usually come from what is treated as equipment revenue versus adjacent services, the base year chosen, and how prices are converted into USD across a volatile FX period.
In this market, the spread is also influenced by how ASPs are moved forward from the base year. Orders are placed well before deliveries, and mix shifts can change the average ticket size quickly. A refresh-led model that rechecks currency conversion dates, validates order-to-delivery timing with current project activity, and recalibrates ASP bands after recent bid cycles explains why the USD 10.35 B (2026) figure differs, a discipline applied by Mordor Intelligence.
Benchmark comparison
| Source | Market Size | Gaps in Research Methodology |
|---|---|---|
| Mordor Intelligence | USD 10.35 B (2026) | |
| Global Consultancy A | USD 6.49 B (2024) | Uses an earlier base year and a different forecast window, and the lower level is consistent with a narrower captured demand pool and less uplift from mix-driven ASP changes seen in recent ordering cycles. |
| Industry Research Desk B | USD 9.62 B (2025) | Reports a near-term value that can sit below a 2026 figure if the study assumes slower ASP progression, applies conservative delivery conversion for backlog, or uses a different USD conversion timing for multi-currency contracts. |
Taken together, the comparison shows that year selection and refresh timing can move the headline number as much as any single demand assumption. Our approach stays traceable because unit signals, cycle mix, and price bands are checked against current project reality before the final total is locked.
Key Questions Answered in the Report
How big is the Industrial Gas Turbine Market?
The Industrial Gas Turbine Market size is expected to reach USD 10.35 billion in 2026 and grow at a CAGR of 6.45% to reach USD 14.14 billion by 2031.
What is the current size of the industrial gas turbine market?
The industrial gas turbine market size stood at USD 10.35 billion in 2026 and is on track to hit USD 14.14 billion by 2031.
Which region leads the industrial gas turbine market?
Asia-Pacific dominates with 45.60% revenue share in 2025, propelled by coal-to-gas transitions and robust infrastructure investments.
Why are data centers adopting gas turbine CHP systems?
Gas turbine CHP delivers up to 60% energy cost savings and high reliability, meeting stringent uptime needs while enabling future hydrogen fuel use.
How fast can mobile gas turbines be deployed?
TM2500 units can be installed in as few as 11 days, supplying 20–35 MW blocks for emergency or temporary grid support.
What share do combined-cycle turbines hold?
Combined-cycle configurations accounted for 62.10% of industrial gas turbine market share in 2025 thanks to efficiencies above 60%.