
Market Overview
| Study Period | 2020 - 2031 |
|---|---|
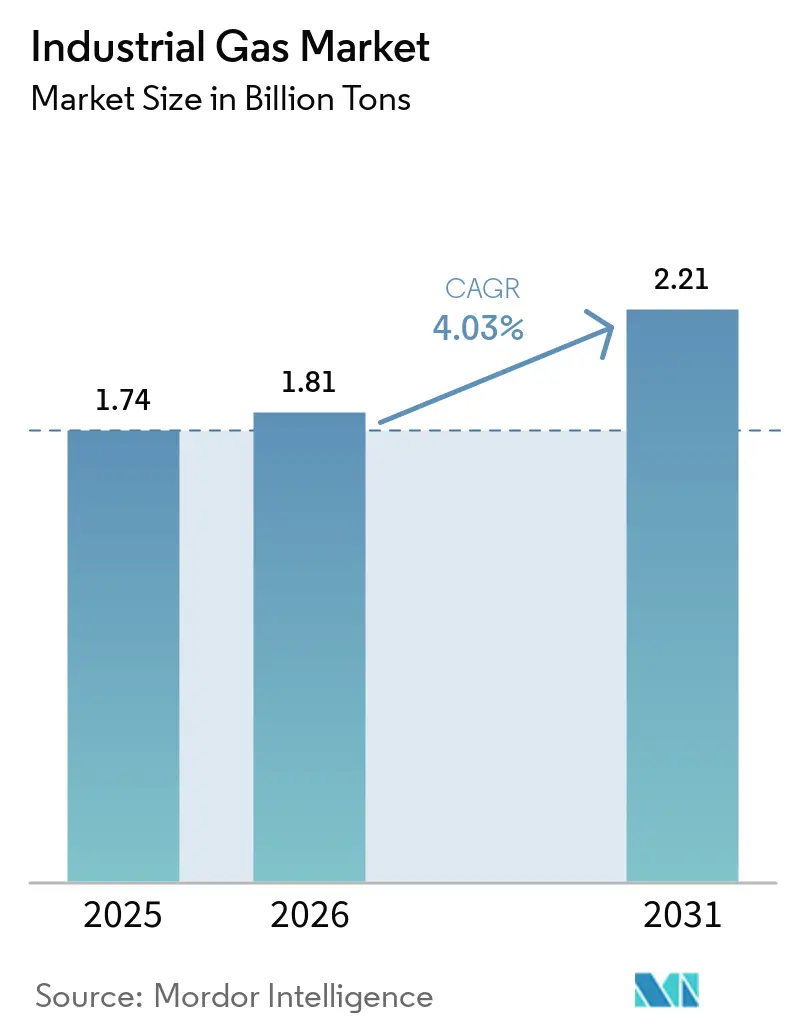
| Market Volume (2026) | 1.81 Billion tons |
| Market Volume (2031) | 2.21 Billion tons |
| Growth Rate (2026 - 2031) | 4.03 % |
| Fastest Growing Market | Asia Pacific |
| Largest Market | Asia Pacific |
| Market Concentration | High |
Major Players *Disclaimer: Major Players sorted in no particular order Image © Mordor Intelligence. Reuse requires attribution under CC BY 4.0. | |
Industrial Gas Market Analysis by Mordor Intelligence
The Industrial Gas Market size is expected to grow from 1.74 billion tons in 2025 to 1.81 billion tons in 2026 and is forecast to reach 2.21 billion tons by 2031 at 4.03% CAGR over 2026-2031. Healthy demand from steel, semiconductor, and chemical producers underpins this growth, while product innovation around green-hydrogen, high-purity oxygen, and food-grade carbon dioxide keeps value creation ahead of volume expansion. Producers are reinforcing on-site supply models to reduce logistics exposure, and large energy users are signing multi-decade supply contracts that lock in power costs. Regionalization of semiconductor fabrication is shifting high-purity nitrogen and argon flows toward the United States and Europe, even as Asia retains overall volume leadership. At the same time, helium recovery projects, carbon capture ventures, and small-footprint air-separation units are attracting fresh capital from both incumbents and infrastructure investors.
Key Report Takeaways
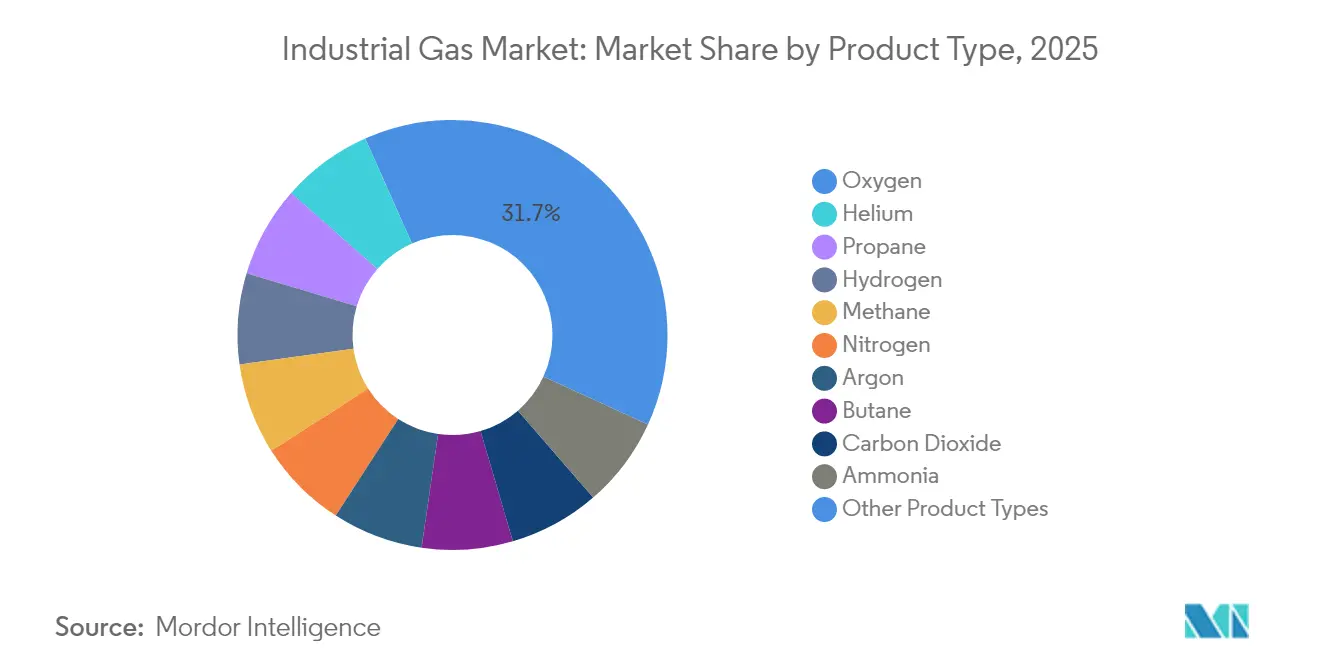
- By product type, oxygen led with 31.65% revenue share in 2025, while nitrogen is on track for a 4.38% CAGR through 2031.
- By mode of supply, the packaged/cylinder segment commanded a 36.78% share in 2025; on-site (tonnage) generation is projected to expand at a 4.29% CAGR through 2031.
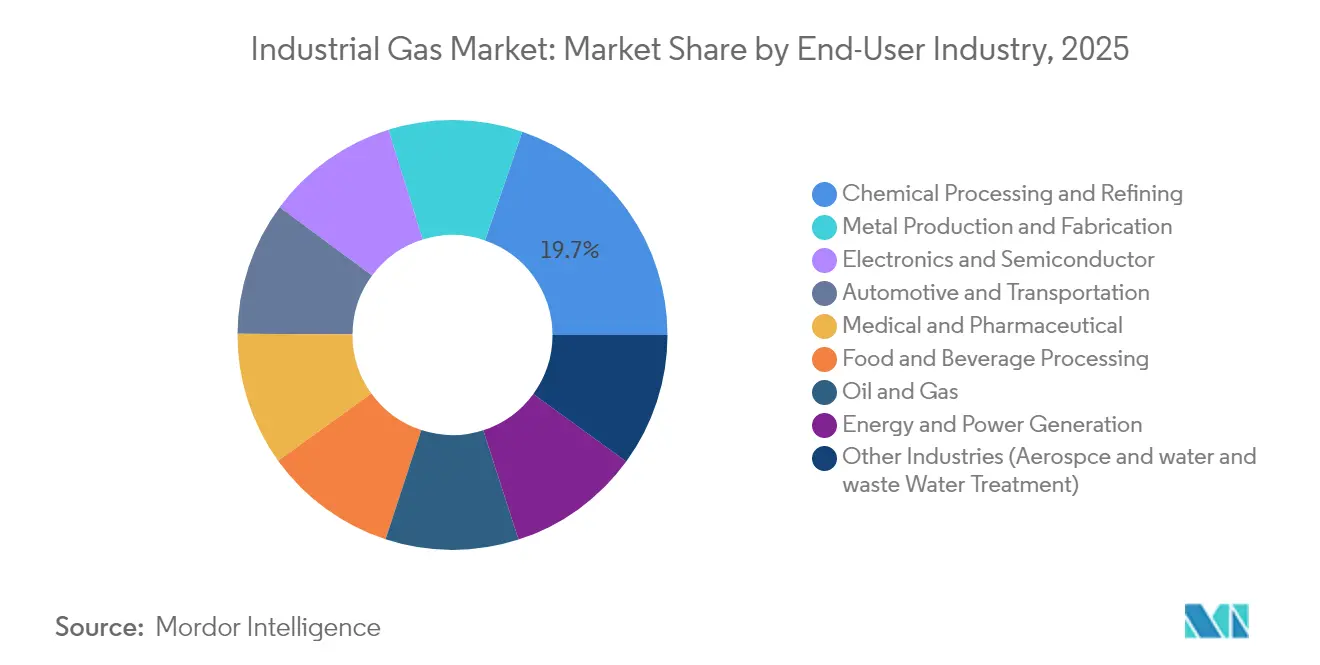
- By end-user industry, chemical processing and refining accounted for 19.74% of the industrial gases market share in 2025, while food and beverage processing are advancing at a 5.05% CAGR to 2031.
- By geography, Asia-Pacific held a 42.55% stake in 2025 and is set to grow at a 4.96% CAGR between 2026-2031.
Note: Market size and forecast figures in this report are generated using Mordor Intelligence’s proprietary estimation framework, updated with the latest available data and insights as of 2026.
Market Trends and Insights
Drivers Impact Analysis of Industrial Gas Market*
| Driver | (~) % Impact on CAGR Forecast | Geographic Relevance | Impact Timeline |
|---|---|---|---|
| Rapid Industrialization in Emerging Economies | +0.90% | Asia, Middle East | Medium term (2-4 years) |
| Green-Hydrogen Push Driving On-Site Electrolysis Contracts in EU & Australia | +1.10% | European Union, Australia, Gulf | Long term (≥ 4 years) |
| Oxygen Uptake from Low-Carbon DRI Steel Plants in US & MENA | +0.70% | United States, MENA | Medium term (2-4 years) |
| CO₂ Capture & Re-Use Projects in EU Breweries & Soda Plants | +0.40% | European Union | Short term (≤ 2 years) |
| Helium Supply-Security Platforms Expanding in North America | +0.30% | North America | Short term (≤ 2 years) |
| Source: Mordor Intelligence | |||
Rapid Industrialization in Emerging Economies
Robust manufacturing expansion across Asia, especially in China and India, is lifting base-load demand for volume gases such as oxygen and nitrogen. Western India alone houses a large concentration of steel mills, petrochemical clusters, and fertilizer complexes that collectively anchor localized air-separation capacity. Regional authorities are pressing ahead with Make-in-India incentives, encouraging investment in electronics assembly, solar-cell production, and electric-vehicle supply chains that use high-purity nitrogen and argon. Parallel infrastructure projects—from metro rail to greenfield refineries—are extending distributed demand pockets that favor packaged and microbulk deliveries. The U.S. Energy Information Administration projects Asian natural-gas consumption will triple by 2050, with 80% channelled into industry, a proxy for the scale of process-gas requirements[1].
Green-Hydrogen Push Driving On-Site Electrolysis Contracts
Decarbonization targets are accelerating the adoption of low-carbon hydrogen, prompting chemical, steel, and heavy-transport operators to lock in long-term supply agreements. In partnership with ACWA Power and NEOM, Air Products is developing a USD 8.5 billion renewable-powered electrolysis plant in Saudi Arabia that will supply 650,000 t/y of green ammonia feedstock. Similar contracts across the European Union, Australia, and the United States are under construction, collectively exceeding 1.1 million t/y of planned output. These projects boost demand for associated gases such as nitrogen (for inerting) and oxygen (as a by-product), and they reinforce on-site generation as the preferred delivery model, reducing trucking emissions and power losses.
Oxygen Uptake from Low-Carbon DRI Steel Plants
Steelmakers are shifting from blast furnaces to natural-gas-based Direct Reduced Iron processes that use oxygen-enhanced combustion to cut CO₂ intensity. Linde signed 59 long-term agreements in 2024 to build and operate 64 small on-site nitrogen and oxygen plants, many dedicated to metal producers adopting DRI routes. The company’s ECOVAR modular ASU offers quick installation and energy-efficient vacuum pressure swing adsorption back-ups, lowering the total cost of ownership for mills. The International Energy Agency estimates that each million tons of DRI capacity can displace 1.4 million tons of CO₂ versus conventional blast-furnace steel, reinforcing policy support for oxygen-rich processes.
CO₂ Capture & Re-Use Projects in EU Breweries & Soda Plants
European breweries are installing closed-loop systems that capture CO₂ from fermentation, re-compress it, and reuse it for beverage carbonation. These skid-mounted units, supplied by Air Liquide and Linde, stabilize supply during merchant-CO₂ shortages and cut Scope 1 emissions. A leading German brewer reported a 45% drop in purchased CO₂ volumes after switching to in-house capture, freeing up merchant capacity for food-processing and healthcare end-markets. Similar projects are underway at soda bottling plants in Italy and Denmark, illustrating how food-grade industrial gases can gain circularity while meeting stringent EU purity regulations.
Restraints Impact Analysis of Industrial Gas Market*
| Restraint | (~) % Impact on CAGR Forecast | Geographic Relevance | Impact Timeline |
|---|---|---|---|
| High Capital Investment and Operational Costs | -0.80% | Global | Long term (≥ 4 years) |
| Stringent Safety and Environmental Regulations | -0.50% | Global | Medium term (2-4 years) |
| Volatility in Raw Material and Energy Prices | -0.40% | Global | Short term (≤ 2 years) |
| Source: Mordor Intelligence | |||
Helium Supply-Security Platforms Expanding in North America
Tight global helium balances continue to disrupt MRI equipment uptime, semiconductor fabrication, and aerospace inerting. The Cliffside Helium System in Texas, a strategic storage complex, remains under receivership yet sustains a minimum allocation for critical users. Quantum Technology Corp. started Western Canada’s first new helium refinery in four decades, adding small but important regional redundancy. Nonetheless, helium prices rose sharply in late 2024, pressuring procurement budgets and encouraging end-users to invest in recovery, purification, and recycling skids. This volatility underpins cautious CAPEX planning for greenfield fabs and acts as a near-term drag on overall consumption growth.
High Capital Investment and Operational Costs
Air-separation plants and hydrogen steam-methane reformers are power-intensive and cost between USD 200–350 million for a single large-scale unit producing up to 5,000 t/d of oxygen, consuming as much electricity as 72,000 homes[2]. Deregulated power markets expose operators to spot price spikes that can erode margins or force pass-through surcharges onto customers. As a result, only a handful of global majors possess the balance sheet strength and technical expertise to design, construct, and maintain these units, reinforcing high entry barriers. Smaller players often prefer distribution partnerships or merchant-bulk sourcing rather than owning production assets, constraining market fragmentation in the long run.
*Our forecasts treat driver/restraint impacts as directional, not additive. The impact forecasts reflect baseline growth, mix effects, and variable interactions.
Industrial Gas Market Segment Analysis
By Product Type:
Oxygen Strengthens Lead in Steel, Healthcare, and ChemicalsOxygen retained a commanding 31.65% share of the industrial gases market size in 2025 and continues to outpace overall volume growth as steelmakers migrate to DRI furnaces and hospitals expand high-flow ventilator capacity. During 2024, Linde and Air Liquide commissioned more than 20 vacuum pressure swing adsorption units dedicated to medical oxygen, reflecting post-pandemic baseline demand. In parallel, research at Nagoya University demonstrated an adsorptive-dissolution membrane capable of separating oxygen from argon at lower energy intensity, pointing toward future cost savings in ultra-high-purity applications.
Nitrogen is driven by semiconductor inerting, laser-cutting, and modified-atmosphere packaging for premium food lines. The segment benefits from a balanced mix of delivery modes: packaged cylinders for metal-fabrication shops, merchant liquid for electronics clean rooms, and on-site generators at cold-storage hubs. Carbon dioxide volume slipped in 2024 because of feedstock disruptions at ethanol plants; however, in-house capture at breweries cushioned beverage producers against outright shortages.

By Mode of Supply:
Packaged/Cylinder Retains Leadership, On-Site SurgesThe packaged/cylinder channel held 36.78% of the industrial gases market share in 2025 as small-batch users across welding, laboratories, and healthcare sought flexible, immediate supply. Airgas manages roughly 40,000 bulk deliveries each month in the United States using telemetry-enabled ordering that trims empty miles and ensures safety compliance. While cylinders prevail for intermittent consumption, the MicroBulk segment—including Chart Industries’ Orca delivery trailers—offers a step-up solution for users with 20–150,000 SCF monthly needs, reducing cylinder handling risks.
On-site generation recorded the most pronounced project momentum in 2024, evidenced by Linde’s 59-unit award slate, many under 300 t/d capacity. Semiconductor fabs prefer on-site nitrogen purification to safeguard ultra-high-purity specifications, and steel mini-mills opt for modular ASUs to match incremental output. Merchant bulk liquid, while ceding share to on-site setups, remains indispensable for mid-scale clients such as regional hospitals and chemical parks where redundancy and code compliance dictate remote production. Segmented logistics planning that blends on-site backbones with backup trailers is becoming the norm, raising switching costs for customers and securing long-term offtake for producers.
By End-User Industry:
Chemical Processing Dominates, Electronics OutpacesChemical processing and refining consumed 19.74% of the industrial gases market size in 2025, anchored by hydrogen for hydro-treating, nitrogen for purge safety, and oxygen for ethylene oxide synthesis. U.S. refiners sourced 68% of their hydrogen from external suppliers in 2024, up from 53% a decade earlier, indicating a secular outsourcing trend that enlarges merchant gas pools. Volatility in crude-sulfur content and stricter fuel sulfur caps keep hydro-processing throughput high, locking in consistent hydrogen uplift.
Electronics and semiconductor fabrication exhibited the steepest demand curve, thanks to reshor-ing incentives and record wafer-fab announcements in the United States, Germany, and Japan. Ultra-clean nitrogen, argon, and hydrogen fluoride are essential for photoresist stripping and chamber cleaning, with purity thresholds measured in parts-per-trillion. Industrial gases industry players offer on-site gas cabinets, redundancy storage, and advanced leak detection to support fabs where downtime can cost USD 2 million per hour. Food and beverage end-markets stayed resilient, leveraging cryogenic freezing with liquid nitrogen and CO₂ to preserve texture and taste. Healthcare demand grew steadily as hospitals upgraded oxygen manifolds and specialty gas pharmacopoeias, further diversifying the customer mix.
Geography Analysis
APAC Industrial Gas Market
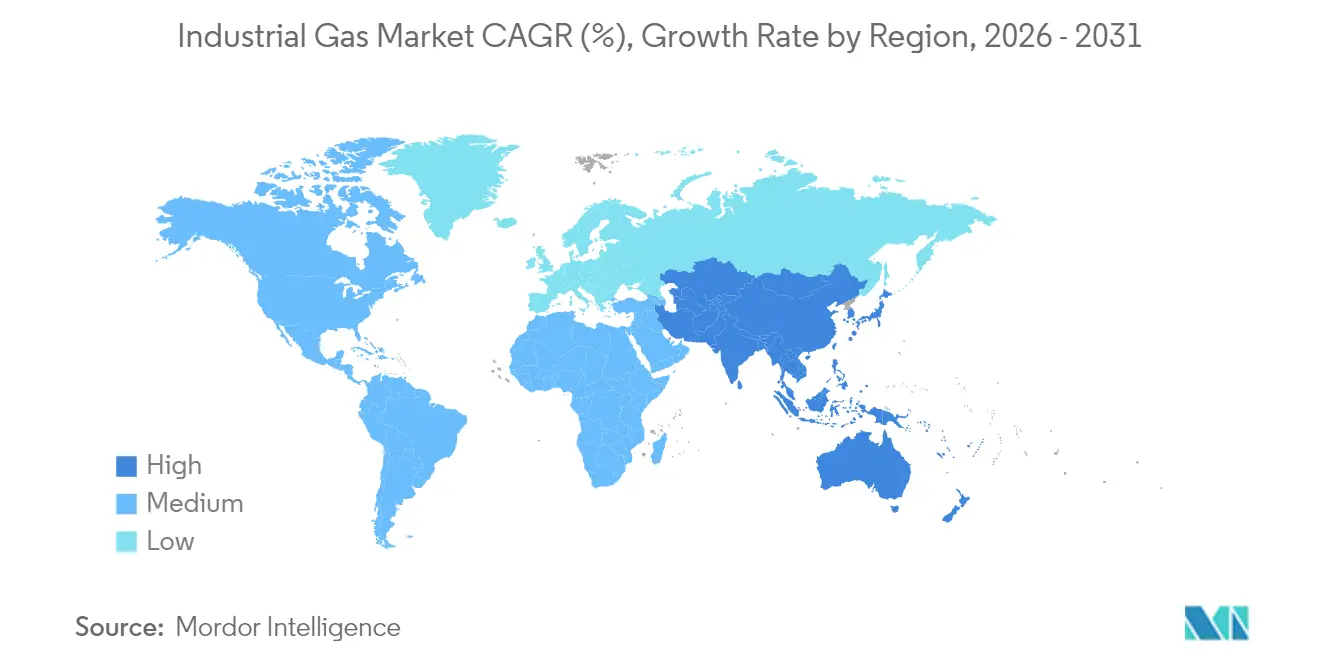
Asia accounted for a dominant 42.55% share of the industrial gases market size in 2025, driven by strong petrochemical, ferrous metallurgy, and electronics clusters. China’s integrated steel capacity and India’s robust infrastructure spending jointly supported more than 600 t/d of new ASU capacity additions last year. Regional governments are promoting carbon capture pilots and green-hydrogen export corridors, aligning industrial gas flows with net-zero roadmaps. The competitive terrain features joint ventures between global majors and domestic firms that localize production while retaining world-scale engineering standards.
North America Industrial Gas Market
North America, characterized by mature pipelines supplying Gulf Coast refineries and adaptable merchant-liquid networks serving the Midwest and Northeast, demonstrates significant volume in the market. Purchases of hydrogen by U.S. refiners rose 29% between 2012 and 2022, illustrating a gradual shift from captive reformers to outsourced supply. Ongoing inflation-reduction incentives for clean-energy projects are catalyzing low-carbon ammonia, sustainable aviation fuel, and CO₂ sequestration ventures, each requiring dedicated industrial gas inputs. Canada is emerging as a niche helium hub, adding redundancy to a market long dominated by the U.S. Bureau of Land Management’s storage system.
Europe Industrial Gas Market
Europe remains a value-added epicenter, focusing on green-hydrogen corridors and food-grade carbon capture. Air Liquide, Linde, and others are synchronizing renewable power purchase agreements with proton-exchange membrane electrolyzers to support maritime shipping and long-haul trucking decarbonization. Stricter F-gas regulation and methane thresholds are nudging refrigeration OEMs toward natural refrigerants, further diversifying gas portfolios in the region.
Regulatory Landscape
Industrial gases operate under overlapping safety, climate, and emissions-reporting regimes that influence production route selection (on-site vs. merchant), equipment choices, and compliance overhead. In the European Union, Regulation (EU) 2024/573 on fluorinated greenhouse gases (in effect since March 2024) tightens quota and phase-down requirements for high-GWP F-gases used in selected specialty and refrigeration-linked applications, which reinforces demand for alternative chemistries and tighter containment practices across the gases ecosystem.
Environmental reporting and administrative requirements continue to evolve. The EU Industrial Emissions Portal framework established by Regulation (EU) 2024/1244 updates how industrial environmental data is collected and disclosed. The European Commission also issued Implementing Regulation (EU) 2026/1444 (published July 2026), which repeals legacy 2007 leakage-checking requirements in favor of updated leak-prevention methodologies. In the United States, the EPA finalized a rule on February 27, 2026 extending the Greenhouse Gas Reporting Program (GHGRP) deadline for reporting year 2025 to October 30, 2026, showing how compliance timing can shift even when core obligations remain unchanged.
Value Chain Analysis
The industrial gases value chain starts with feedstocks and utilities (ambient air for ASUs, and natural gas and electricity for hydrogen and synthesis routes), then moves through large-scale production (cryogenic air separation, SMR, electrolysis, and purification and liquefaction), storage, and distribution. Delivery runs from packaged cylinders and microbulk through distributors, to merchant bulk liquid via cryogenic tankers and railcars, to on-site (tonnage) supply via dedicated plants and customer-integrated pipelines. Given that ASUs and hydrogen units are power-intensive and capital-heavy, long-term offtake contracts, vendor-managed inventory models, telemetry, and redundancy planning are central commercial mechanisms linking producers, logistics providers, and end users.
Midstream logistics and geopolitics remain key friction points for high-purity and scarce gases. Reported disruption signals include a March 2026 statement from Jindal Stainless citing production impacts from an industrial gas supply crunch tied to West Asian logistics disruptions. Supply-chain reporting also points to shipment diversions and multi-day delays for ultra-pure specialty gas cargoes related to passage conditions near the Strait of Hormuz. These dynamics are pushing regionalization of supply, with more on-site generation for critical users such as semiconductors and metals, and they are driving further investment in recovery and recycling for helium and specialty gases. They also increase reliance on local distributors and filling networks to buffer last-mile volatility.
Competitive Landscape
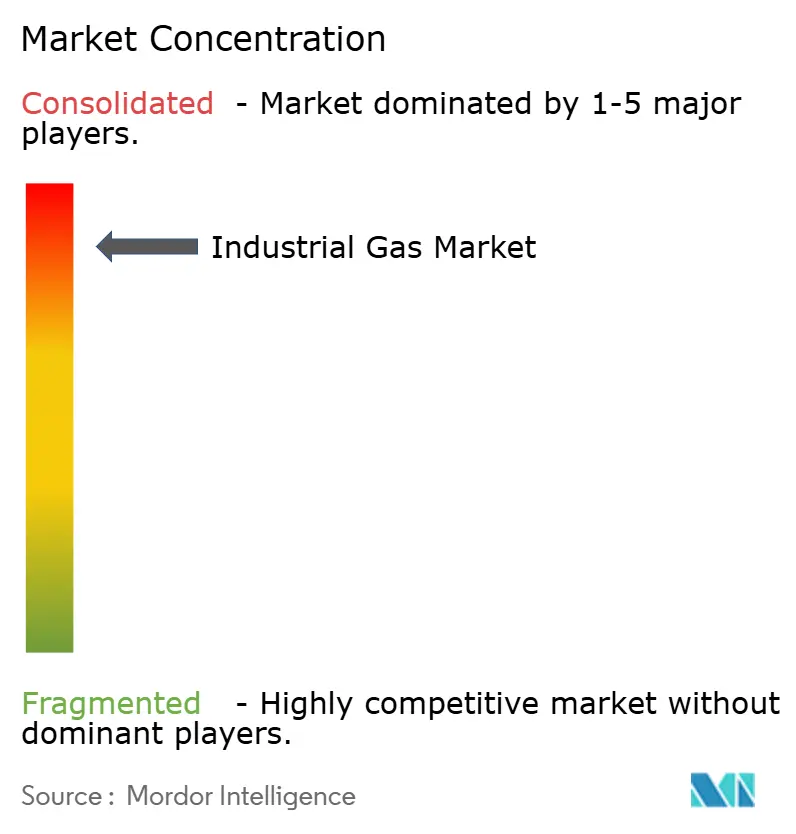
The industrial gases market is highly consolidated. Linde reported USD 33 billion of sales and carried a record USD 10.4 billion project backlog, underscoring its capacity to self-fund multi-year decarbonization contracts. Air Liquide reaffirmed targets to cut carbon intensity by 30% by 2025 and achieve carbon neutrality by 2050, signaling a shift toward green-hydrogen, biomethane, and high-efficiency ASUs. Air Products doubled down on multi-gigawatt electrolysis projects in Saudi Arabia and Texas, betting that first-mover scale will unlock favorable long-run power tariffs.
Mid-tier players are carving regional niches by pairing localized cylinder distribution with merchant-bulk imports. These companies often adopt asset-light, build-own-operate models that conserve capital yet offer contractual stickiness. Technology partnerships are deepening across the value chain. Air Liquide’s turbo-Brayton technology for LNG boil-off management secured nearly 70 units of order intake by February 2025, validating cryogenic innovation in maritime transport. Proprietary membrane, adsorption, and liquefaction patents create high switching costs for customers and sustain return on invested capital for leading producers.
Industrial Gas Industry Leaders
-
Linde plc
-
Air Liquide
-
Air Products and Chemicals Inc.
-
Nippon Sanso Holdings Corporation
-
Messer SE & Co. KGaA
- *Disclaimer: Major Players sorted in no particular order
Industrial Gas Market Companies Covered in this Report
- Air Liquide
- Air Products and Chemicals Inc.
- Air Water Inc.
- Asia Technical Gas Co Pte Ltd.
- BASF SE
- Bhuruka Gases Ltd.
- Ellenbarrie Industrial Gases Limited
- Gasco
- Goyal MG gases pvt.ltd
- Gruppo SIAD
- Gulf Cryo
- Iwatani Corporation
- Linde plc
- Messer SE & Co. KGaA
- Nippon Sanso Holdings Corporation
- Oxair
- PT Samator Indo Gas Tbk
- Resonac Holdings Corporation
- Sapio Group
- SOL Group
- Southern Industrial Gas Sdn Bhd
- Yingde Gas Shanghai
Market Opportunities and Future Outlook
Semiconductor manufacturing build-outs and advanced packaging lines are expanding the addressable space for ultra-high-purity nitrogen, argon, and related electronic gases, supporting demand for co-located production units and long-duration supply contracts. The effect is visible in 2026 capital commitments by Air Liquide tied to semiconductor customers, including high-purity nitrogen investments for SK hynix in South Korea (Cheongju) and new production units in Indiana for SK hynix in the United States, along with its Japan investment in Hiroshima to support a leading semiconductor manufacturer. Across these projects, buyers are raising expectations around purification, monitoring, and continuity-of-supply architectures (including redundancy storage, on-site generation, and specialized distribution), which creates whitespace for specialty purification skids and integrated on-site service models.
Decarbonization programs in steel, chemicals, and food-grade CO2 are also creating opportunities that connect molecules, energy, and carbon management. Air Liquide announced an agreement exceeding USD 350 million (April 2026) to supply oxygen, nitrogen, and argon to the HYUNDAI-POSCO Louisiana LLC steel project, reinforcing demand for large ASU capacity aligned to lower-carbon steel pathways. In chemicals, Air Liquide also announced a new POX unit investment at Oxea in Bay City, Texas (July 2026), supporting continued momentum in customer-tied hydrogen and synthesis-gas infrastructure. At the same time, merchant CO2 volatility and EU beverage-sector circularity initiatives are backing adoption of fermentation CO2 capture and reuse systems, shifting part of the value pool toward capture, purification, and food-grade compliance services rather than only incremental merchant volumes.
Recent Industry Developments in Industrial Gas Market
- July 2026: Messer announced strategic acquisitions to expand its industrial gases footprint in Southeast Asia, including the acquisition of WKS Group (Singapore and Malaysia) and Wipco (Malaysia), and an agreement to acquire Kobewel (Malaysia). The move strengthens Messer's regional distribution, cylinder operations, and customer access in fast-growing end markets, supporting a broader platform for merchant and packaged gas expansion.
- February 2025: Linde reported a fifth consecutive year of record wins in small on-site projects for nitrogen and oxygen supply, stating it signed 59 long-term agreements in 2024 to build, own, and operate 64 plants at customer sites. The scale of this award slate reinforces the shift toward decentralized, customer-integrated supply models and raises competitive barriers around engineering capability and project execution.
- January 2024: Air Liquide expanded supply of low-carbon medical gases to hospitals across Europe and Brazil. The rollout supports healthcare customers tightening procurement criteria around emissions and traceability, and it extends Air Liquide's differentiated offer beyond commodity supply into documented low-carbon product and logistics solutions.
Industrial Gas Market Report Scope and Research Methodology
Market Definition and Coverage
For this study, the industrial gas market covers the supply of major industrial and specialty gases to end users across manufacturing, energy, chemicals, metals, electronics, food processing, and healthcare. We count sales delivered through packaged cylinders, merchant bulk liquids, and on-site generation.
Scope exclusions: We exclude end-use equipment and services, such as cylinder hardware, storage tanks, vaporizers, pipelines, and engineering and maintenance work.
Segments Covered in This Report
- By Product Type
- Nitrogen
- Oxygen
- Carbon Dioxide
- Hydrogen
- Helium
- Argon
- Ammonia
- Methane
- Propane
- Butane
- Other Product Types
- By Mode of Supply
- Packaged/Cylinder
- Merchant Bulk Liquid
- On-Site (Tonnage) Generation
- By End-user Industry
- Chemical Processing and Refining
- Electronics and Semiconductor
- Food and Beverage Processing
- Oil and Gas
- Metal Production and Fabrication
- Medical and Pharmaceutical
- Automotive and Transportation
- Energy and Power Generation
- Other Industries (Aerospace and water and waste Water Treatment)
- By Geography
- Asia-Pacific
- China
- India
- Japan
- South Korea
- ASEAN
- Australia
- New Zealand
- Rest of Asia-Pacific
- North America
- United States
- Canada
- Mexico
- Europe
- Germany
- United Kingdom
- France
- Italy
- Nordics
- Rest of Europe
- South America
- Brazil
- Argentina
- Rest of South America
- Middle East and Africa
- Saudi Arabia
- United Arab Emirates
- Turkey
- South Africa
- Nigeria
- Rest of Middle East and Africa
- Asia-Pacific
Data Sources, Market Sizing, and Validation
Desk Research
Desk research was used to set key inputs on production, trade flows, and end-use activity that drives gas consumption. Public sources such as the US Energy Information Administration, US Geological Survey, International Energy Agency, UN Comtrade, and the World Steel Association were referenced to build consistent demand signals for energy, metals, and industrial output.
We also reviewed company annual reports and investor presentations, press coverage, and association publications to understand supply modes, pricing direction, and capacity additions. Where needed, paid subscriptions were used for company financials and intelligence, patent lookups, and shipment-level import and export checks, so assumptions could be stress-tested against observable flows. These examples are indicative only, and many other sources were also used for data collection, validation, and clarification.
Primary Interviews and Surveys
Primary work focused on validating which gases and supply modes are most demanded by each end-user group, and how contract terms and purity requirements shape effective pricing. We spoke with stakeholders across producers, distributors, EPC-linked contacts, and large industrial buyers across APAC, EMEA, and the Americas, then used follow-up outreach to resolve gaps found in secondary reads.
Distribution of primary research fieldwork respondents
| Company type | Respondent position | Region |
|---|---|---|
| Top tier: 31% | CXOs: 15% | APAC: 46% |
| Mid tier: 54% | Functional/Unit leaders: 31% | EMEA: 29% |
| Smaller Players: 15% | Managers: 54% | Americas: 25% |
Market-Sizing & Forecasting
Sizing started with a top-down build where industrial output indicators, metals production, refinery activity, power generation trends, and electronics manufacturing signals were translated into gas demand pools by region. Those pools were then adjusted using typical supply-mode splits.
To keep the model grounded, we used selective bottom-up approximations as checks, such as sampled volume-by-mode estimates tied to observed capacity additions and a price-per-unit logic for key gases.
Inputs tracked (illustrative) include steel output and metal fabrication activity for oxygen and argon use, refinery throughput and hydrogen intensity, semiconductor and electronics production for high-purity gases, and food processing volumes for carbon dioxide and nitrogen demand. When data was thin for a country or a smaller application, proxy indicators were applied and then corrected using expert feedback, so the final totals did not overreact to one data series.
Forecasts were developed using scenario analysis supported by near-term project pipelines and medium-term macro signals. We then smoothed year-to-year movements so they reflect typical contract renewals and capacity ramp-up timing. The CAGR path was finally reviewed against supply constraints, announced plant start-ups, and expected changes in end-user mix.
Data Validation & Update Cycle
Estimates were triangulated across multiple signals so no single assumption drove the outcome by itself. Variance checks were run at gas type, supply mode, and region level. Outliers were flagged, reviewed by a second analyst, and followed by targeted re-contact with interviewees when a figure moved beyond a reasonable range.
The report is refreshed annually, and interim updates are made when material events occur, such as large capacity additions, major policy changes affecting energy and emissions, or sharp feedstock price shifts. Before delivery, a final pass is completed to ensure the latest public data points and confirmed industry inputs are reflected in the model.
Mordor Intelligence's Industrial Gas Market Size Compared Against Other Published Estimates
Published market sizes for industrial gases often do not match because the scope line is drawn differently, and because value versus volume measurement is handled in different ways. Differences also show up when price assumptions are applied unevenly across regions and supply modes, especially when long-term contracts are mixed with spot and merchant pricing.
The main gap comes from value versus volume treatment and how on-site supply is priced. In this approach, Mordor Intelligence anchors the market on a volume-led demand build and then applies mode-specific pricing logic, rather than using a single blended price curve across all gases and delivery formats.
Benchmark comparison
| Source | Market Size | Gaps in Research Methodology |
|---|---|---|
| Mordor Intelligence | USD 0.00 B (2026) | |
| Global Consultancy A | USD 110.81 B (2024) | Uses a revenue base year with limited clarity on how on-site contracts are converted into comparable annual value, which can shift totals when contract pricing is averaged across regions and gas purity grades. |
| Industry Research Group B | USD 119.11 B (2025) | Reports value estimates with broad gas coverage, but scope notes do not clearly separate industrial versus medical demand lines and can mix delivery modes, which affects the implied price-per-unit used for aggregation. |
Overall, the spread mainly reflects whether the estimate is built from physical demand and then priced, or whether it starts from revenue pools that may blend contracts, purity levels, and delivery formats. By keeping inputs traceable to end-use activity and then checking totals against supply-mode realities, the final figure stays repeatable and easier to audit year over year.
Key Questions Answered in the Report
What is the current industrial gases market size and projected growth?
The market stands at 1.81 billion tons in 2026 and is expected to reach 2.21 billion tons by 2031, growing at a 4.03 % CAGR.
Which product leads the industrial gases industry?
Oxygen leads with a 31.65% market share because of its extensive use in steelmaking, healthcare, and chemical processing.
Why is on-site generation gaining traction?
On-site plants lower logistics costs, enhance supply security, and align with decarbonisation objectives for energy-intensive users.
How are green-hydrogen projects impacting the market?
They are creating demand for electrolyser-based hydrogen and associated oxygen streams, prompting suppliers to develop integrated low-carbon solutions.
Which region holds the largest industrial gases market share?
Asia leads with a 42.55% share, supported by rapid industrialisation, infrastructure development, and expanding manufacturing capacity.