
Industrial Cooking Fire Protection Systems Market Size and Share
Market Overview
| Study Period | 2020 - 2031 |
|---|---|
| Market Size (2026) | USD 39.28 Billion |
| Market Size (2031) | USD 51.88 Billion |
| Growth Rate (2026 - 2031) | 5.73 % |
| Fastest Growing Market | Asia Pacific |
| Largest Market | North America |
| Market Concentration | Medium |
Major Players *Disclaimer: Major Players sorted in no particular order Image © Mordor Intelligence. Reuse requires attribution under CC BY 4.0. | |
Industrial Cooking Fire Protection Systems Market Analysis by Mordor Intelligence
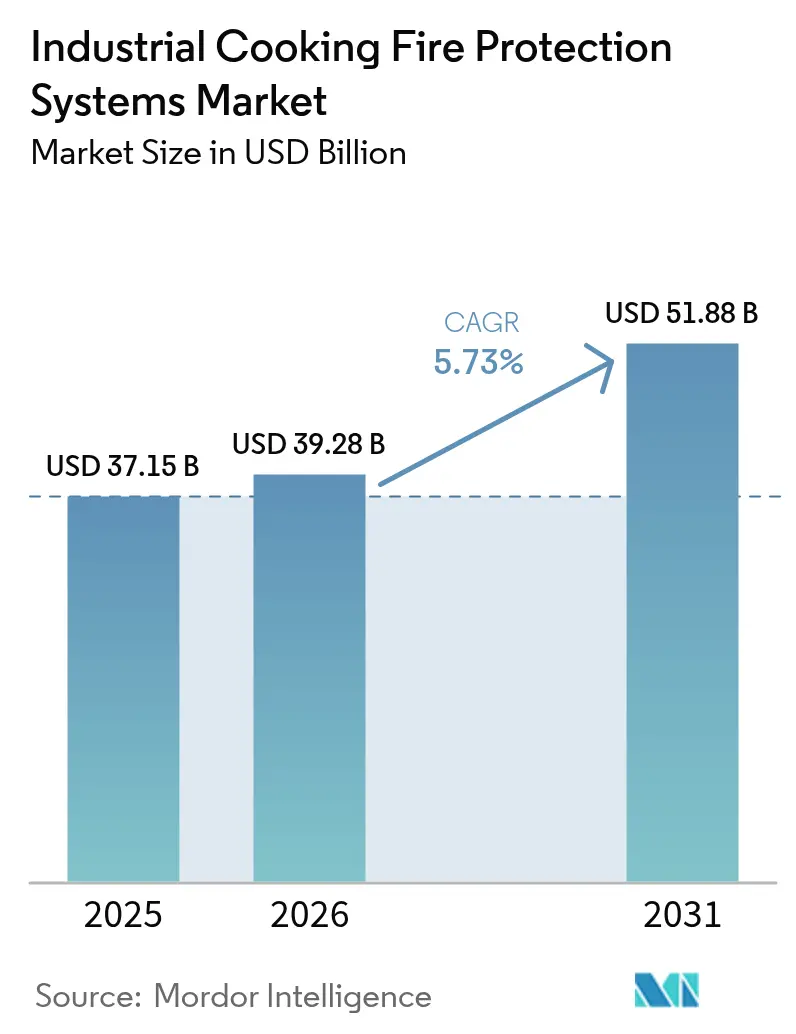
The industrial cooking fire protection systems market size was valued at USD 37.15 billion in 2025 and estimated to grow from USD 39.28 billion in 2026 to reach USD 51.88 billion by 2031, at a CAGR of 5.73% during the forecast period (2026-2031). This expansion is rooted in the strict enforcement of NFPA 96 and UL 300, rapid roll-outs of quick-service restaurants (QSRs) and hotel kitchens, and a wave of smart detection–suppression innovations.[1]Elevated grease-fire risks in high-temperature plant-oil frying, paired with growing insurance incentives for compliant retrofits, are compelling both new builds and legacy operations to upgrade. Wet-chemical agents continue to dominate because of proven grease-fire effectiveness, yet water-mist technologies are gaining momentum as regulators phase out PFAS-based foam.[2]North America, backed by extensive QSR footprints and an entrenched service network, retains market leadership, while Asia-Pacific delivers the fastest growth on the back of rapid urbanization and restaurant proliferation. Suppliers that integrate IoT sensors, predictive analytics and cloud dashboards are securing premium margins by shifting value from simple compliance to operational uptime and data-driven safety.
Key Report Takeaways
- By product type, fire detection systems led with 57.82% revenue share in 2025, whereas fire management systems are projected to post the fastest 6.05% CAGR to 2031.
- By suppression agent, wet-chemical solutions captured 61.12% of industrial cooking fire protection systems market share in 2025; water-mist systems are forecast to grow at 6.95% CAGR through 2031.
- By end-use industry, restaurants and hotels commanded 44.63% share of the industrial cooking fire protection systems market size in 2025, while food-processing plants register the highest 6.46% CAGR to 2031.
- By connectivity, wired platforms held 69.85% share in 2025, whereas wireless/cloud-connected systems are increasing at an 7.9% CAGR on stronger IoT adoption.
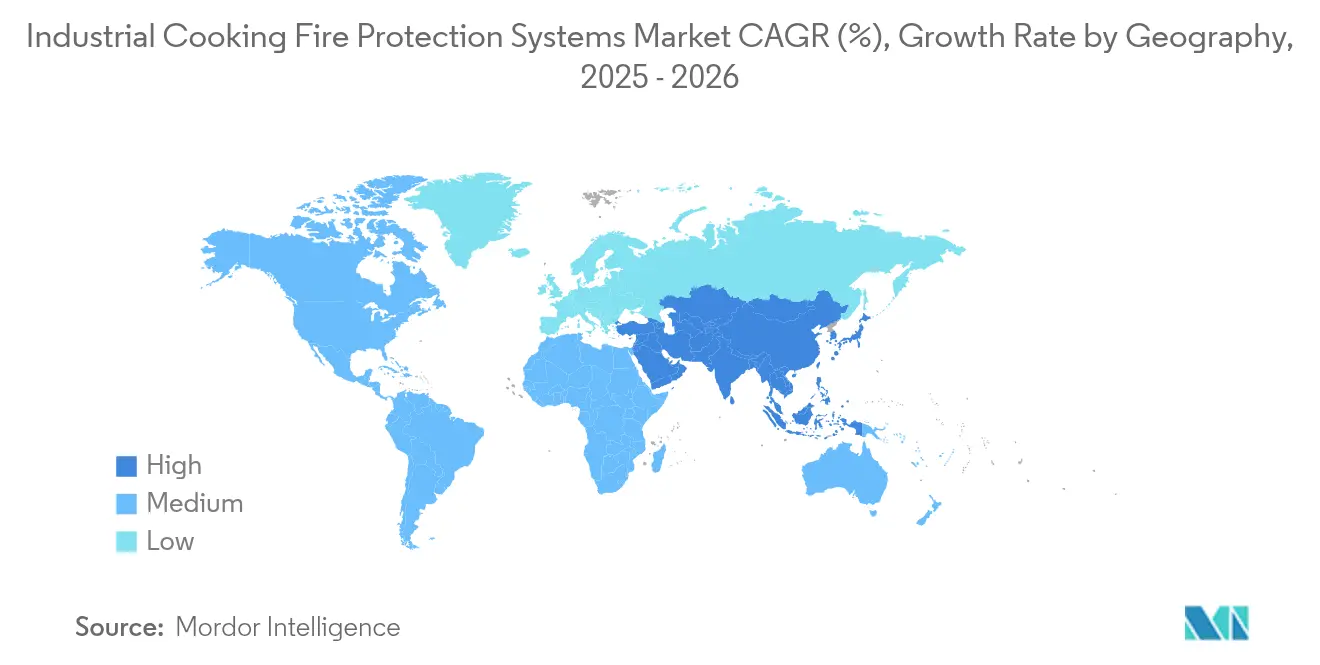
- By geography, North America dominated with 32.78% share in 2025; Asia-Pacific is advancing at 6.18% CAGR through 2031.
Note: Market size and forecast figures in this report are generated using Mordor Intelligence’s proprietary estimation framework, updated with the latest available data and insights as of 2026.
Market Trends and Insights
Drivers Impact Analysis of Industrial Cooking Fire Protection Systems Market*
| Driver | (~) % Impact on CAGR Forecast | Geographic Relevance | Impact Timeline |
|---|---|---|---|
| Stringent global kitchen-safety mandates | +1.2% | Global; most stringent in North America & EU | Medium term (2-4 years) |
| Accelerated hotel and QSR build-outs | +0.8% | Asia-Pacific core; MEA spill-over | Short term (≤ 2 years) |
| Smart, IoT-enabled platforms | +1.1% | North America & EU early adopters; Asia-Pacific catching up | Long term (≥ 4 years) |
| Insurance premium rebates | +0.9% | Global with regional variation | Medium term (2-4 years) |
| ESG push for PFAS-free agents | +0.7% | EU leads; North America & Asia-Pacific scale | Long term (≥ 4 years) |
| Rising fire risk from high-temperature plant-oil frying | +0.6% | Global; concentrated in QSR & food processing | Short term (≤ 2 years) |
| Source: Mordor Intelligence | |||
Stringent Global Kitchen-Safety Mandates (NFPA 96, UL 300)
Reinforced enforcement of NFPA 96 duct and hood provisions and UL 300 performance tests has shifted upgrades from optional to compulsory. The International Fire Code’s Section 904.13 prescribes automatic extinguishing equipment for cooking operations, prompting full retrofits of aging grease-fire systems, particularly those predating 1998 UL 300 certification.[3]Compliance is no longer limited to brick-and-mortar kitchens; food trucks, catering trailers and university cafeterias are now within jurisdiction, creating thousands of incremental installations. Local authorities in Washington State now require NICET-qualified technicians, raising professional barriers and ensuring correct commissioning. Insurance carriers tie policy renewals to evidence of UL-300 records, generating recurring service revenue. Combined, these factors underpin a structural uptick in demand for certified detection and suppression gear across every region.
Accelerated Hotel and QSR Build-Outs
Yum China’s operation of 12,947 restaurant units exemplifies the new-build surge that is reshaping the industrial cooking fire protection systems market.[4] Hotel chains recovering from pandemic lows are simultaneously renovating back-of-house kitchens, embedding fire suppression at design phase rather than as retrofit. Asia-Pacific sites often open in clusters, creating procurement waves that strain supply of UL-300-listed nozzles and valves. Global QSR brands pursue template kitchens with identical protection technologies, so a supplier that wins one master franchise can attain hundreds of repeat units. This consolidation steers deal flow toward scale-capable OEMs, marginalizing smaller regional players and accelerating the shift toward global standards.
Smart, IoT-Enabled Detection and Suppression Platforms
Artificial-intelligence algorithms paired with multi-sensor arrays raise grease-fire detection accuracy beyond 95%, cutting incident response time 72% relative to legacy thermal sensors. Connected panels stream temperature, vapor and particulate data into building-management dashboards, letting facility managers adjust airflow, reduce energy draw and pre-empt flashover. Honeywell’s AI-enabled detectors minimize nuisance trips while pushing firmware patches over the air, addressing a chronic pain-point for QSR operators. Wireless cloud linkage also furnishes proof-of-maintenance logs that insurers increasingly demand. Consequently, smart systems command 15-20% higher ASPs yet still deliver payback through downtime avoidance and insurance discounts, bolstering premium segment revenue.
Insurance Premium Rebates for Compliant Retrofits
Underwriters are refining actuarial models to recognize loss-prevention gains from modern suppression systems. Restaurants presenting documented UL-300 compliance now claim premium reductions of 5–12%, and additional credits for kitchens monitored via IoT dashboards. The savings multiply across large QSR fleets, further justifying capital spend on upgrades. Insurers are piloting tiered pricing that rewards predictive maintenance data feeds, nudging operators toward cloud-connected solutions. This financial lever transforms safety investment from cost center to profit enabler, accelerating replacement cycles in both mature and emerging markets.
Restraints Impact Analysis of Industrial Cooking Fire Protection Systems Market*
| Restraint | (~) % Impact on CAGR Forecast | Geographic Relevance | Impact Timeline |
|---|---|---|---|
| High CAPEX for upgrading legacy hoods & ducts | -0.4% | Global; most acute in North America & EU | Medium term (2-4 years) |
| False-alarm downtime & nuisance discharges | -0.2% | Global; high-volume kitchens most affected | Short term (≤ 2 years) |
| PFAS phase-out disrupting agent supply | -0.3% | EU lead; North America following | Long term (≥ 4 years) |
| Shortage of UL 300-certified installers | -0.3% | North America & EU expanding to Asia-Pacific | Medium term (2-4 years) |
| Source: Mordor Intelligence | |||
High CAPEX for Upgrading Legacy Hoods and Ducts
Replacing older ventilation runs to fit modern nozzle footprints can top USD 100,000 per site, a figure that excludes structural reinforcing and electrical re-routing. Many small operators defer projects, stretching compliance grace periods and stalling some retrofit opportunities. Historic inner-city properties present layout conflicts that raise installation hours and crane rental costs. These budget pressures slow conversion of entrenched yet obsolete systems in mature markets, dampening upside despite regulatory push.
False-Alarm Downtime and Nuisance Discharges
Every unintended suppression release forces full clean-down, food disposal and hours-long closure, costing high-volume QSRs thousands in lost sales. The balance between sensitivity and resilience remains delicate; aerosolized cooking vapors can still trigger cheaper photo-electric detectors. Past nuisance incidents have made some franchisees hesitant to adopt more advanced sensors, fearing reputational damage and food waste. Vendors must therefore demonstrate concrete reductions in false-alarm rates to overcome lingering skepticism.
*Our forecasts treat driver/restraint impacts as directional, not additive. The impact forecasts reflect baseline growth, mix effects, and variable interactions.
Industrial Cooking Fire Protection Systems Market Segment Analysis
By Product Type:
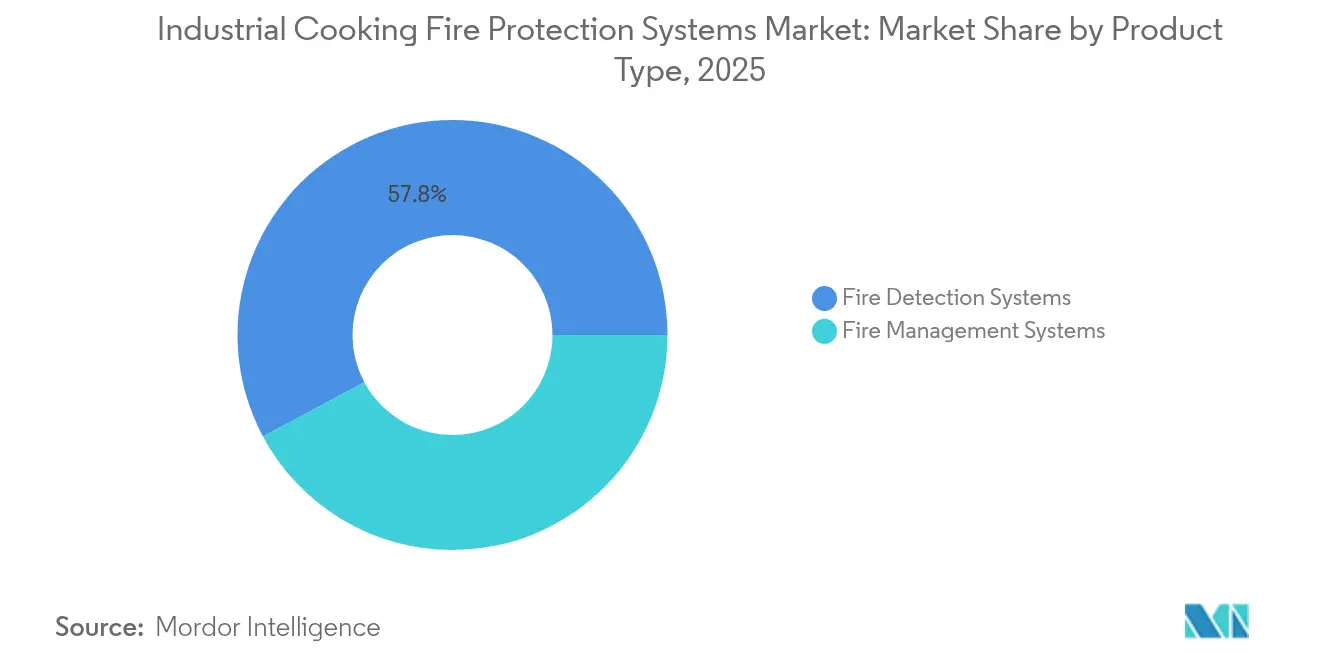
Detection Systems Retain Lead as Suppression AcceleratesDetection systems generated the largest slice of the industrial cooking fire protection systems market at 57.82% in 2025, cementing their role as the foundational layer of kitchen safety. Integrating thermal, optical and air-sampling sensors curtails latency while reducing spray activations, maintaining uptime for foodservice operators. Simultaneously, suppression platforms are set to log a 6.05% CAGR through 2031 as regulators insist on active agent discharge and full-hood coverage. An increasingly popular integrated design folds both detection and nozzle arrays into a single control panel, curbing maintenance visits and yielding unified compliance documentation. Johnson Controls’ Ansul R-102-newly EN 17446-certified-embodies this approach, securing additional European tender win.
The convergence trend is reshaping buyer expectations: operators now benchmark quotes on life-cycle support, firmware updates and data analytics rather than equipment alone. This pull is nudging OEM roadmaps toward modular architectures that accommodate smart sensors, alternative agents and cloud APIs. As integrated kits permeate small-format kitchens and ghost kitchens, detection-only replacements will increasingly taper, pivoting revenue growth to next-generation hybrid offerings

By Suppression Agent:
Water-Mist Disrupts Wet-Chemical DominanceWet-chemical formulas still account for 61.12% of the industrial cooking fire protection systems market share due to long-standing UL 300 testing success against vegetable-oil fires. Yet water-mist technologies are climbing at a projected 6.95% CAGR as operators seek fluorine-free solutions amid PFAS restrictions. High-pressure atomization creates micro-droplets that cool flames, displace oxygen and limit thermal radiation, delivering rapid knock-down with minimal residue. Siemens deepened its water-mist capabilities via the Danfoss Fire Safety acquisition, ensuring a PFAS-free roadmap for multinational clients.
Dry-chemical and inert-gas agents keep niche appeal where sensitive electronics or enclosed machinery demand zero water exposure. However, PH-neutral water-mist additives are narrowing performance gaps, making them viable for mixed-hazard kitchens. As environmental framing shifts procurement criteria, agent selection now extends beyond suppression metrics to sustainability audit points, reinforcing the momentum behind water-mist roll-outs.
By End-Use Industry:
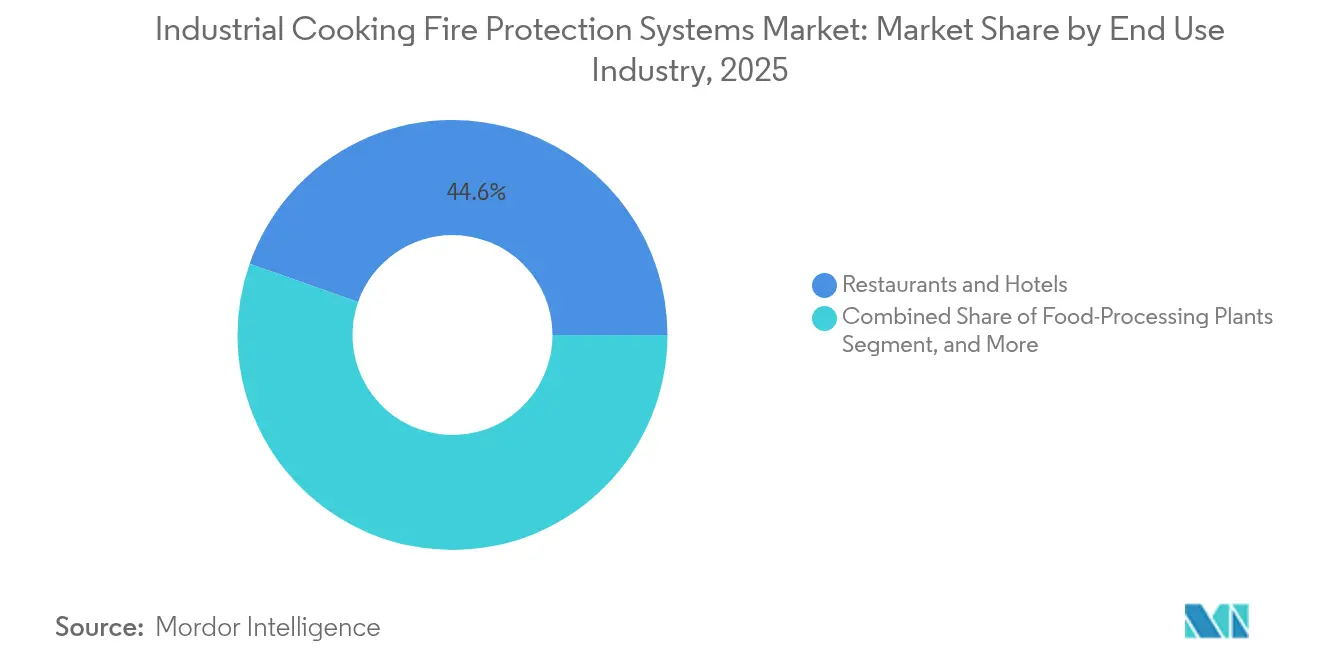
Food Processing Surges Past Traditional Restaurant CoreRestaurants and hotels contributed 44.63% to 2025 revenue, mirroring the historical focus of commercial safety codes. Large chains continue multi-site retrofits, but incremental restaurant growth alone will not sustain double-digit volume gains. Instead, industrial food-processing plants are set to pace the field with a 6.46% CAGR through 2031 as automation pushes fryers and ovens to 24-hour cycles and higher flash-point oils. These environments demand extended-coverage agent flows and high-capacity cylinder banks, spurring bespoke engineering contracts.
Institutional kitchens-spanning hospitals, universities and correctional facilities-add steady baseline demand, driven by stringent duty-of-care liabilities. Meanwhile, cloud-kitchen aggregators adopt space-efficient hood packages and centralized fire panels that link multiple tenant kiosks, carving out a fast-growing sub-segment. As a result, suppliers adept at scaling from single-line restaurants to 5,000 l/h industrial fryers will capture outsized wallet share.
By Connectivity:
Wireless Platforms Challenge Wired DominanceHard-wired architectures kept 69.85% share in 2025 by virtue of decades-proven reliability and lower upfront costs. However, wireless and cloud-connected variants are tracking the highest 7.9% CAGR. Battery-backed mesh sensors slash installation downtime, especially in retrofit scenarios where cutting walls or ceilings is prohibitive. Continuous diagnostics flow to mobile dashboards, empowering managers to pre-empt pressurization loss or nozzle obstruction. Cloud APIs also allow insurers to verify inspection logs automatically, unlocking premium discounts.
Durability improvements—five-year sealed lithium packs and robust 868/915 MHz protocols—have erased historical objections around power and interference. Consequently, franchisees planning multi-unit roll-outs now weigh wireless first, even in new builds, to future-proof sites for data integrations spanning HVAC, refrigeration and energy analytics. This shift signals a long-term migration in value from copper cabling to software subscriptions bundled with hardware.
Geography Analysis
North America Industrial Cooking Fire Protection Systems Market
North America led the industrial cooking fire protection systems market with 32.78% share in 2025 on the back of mature codes, rigorous inspection regimes and dense QSR networks. United States outlets rely on extensive distributor coverage for quarterly maintenance, while Canada pilots PFAS-free pilots that presage continent-wide transitions. Growth to 2031 hinges on replacing legacy wet-chemical skids with IoT-ready, fluorine-free platforms and on integrating hood protection into broader smart-building suites.
APAC Industrial Cooking Fire Protection Systems Market
Asia-Pacific is on track for the fastest 6.18% CAGR, powered by the unrelenting rollout of branded QSR chains and upscale hotels in Tier 2 and Tier 3 cities across China and India. National building-code tightening and insurers’ insistence on UL-300 equivalence push operators toward certified hardware. Japan’s reliance on performance-based design stimulates demand for compact water-mist systems compatible with narrow kitchen footprints, boosting penetration of high-pressure solutions.
Europe Industrial Cooking Fire Protection Systems Market
Europe shows steady, regulation-driven expansion. Early adoption of PFAS bans accelerates agent reformulations, positioning European OEMs as trailblazers in sustainable suppression chemistry. Germany’s export-oriented food machinery plants and the United Kingdom’s bustling takeaway sector both require hybrid detection-suppression packages to counter elevated fry-oil flash points. Southern Europe’s tourism rebound revives hotel retrofits, presenting catch-up potential for fire-safety modernization.
Value Chain Analysis
The value chain starts with standards and certification bodies that set system design and test requirements, notably NFPA 96 and NFPA 17A, alongside UL 300 performance testing that supports listing for pre-engineered commercial cooking suppression systems. Upstream inputs include wet-chemical agent concentrates and cylinders, metallic piping and fittings, nozzles and discharge hardware, fusible links, detection devices, and mechanical or electrical control assemblies, with agent formulation and control panel build and verification acting as key manufacturing nodes.
Downstream, OEMs such as Johnson Controls (ANSUL/PIRANHA) and Amerex route products through authorized distributors to contractors who engineer, install, and commission systems to manufacturer manuals and local amendments, then monetize recurring inspection, maintenance, and recharge work. Bottlenecks typically come from UL 300 re-certification cycles when components change, and from localized permitting and technician qualification requirements, for example county or city fire department guidance aligned to NFPA 17A, which can extend retrofit and new-build timelines for multi-site restaurant and institutional kitchen rollouts.
Competitive Landscape
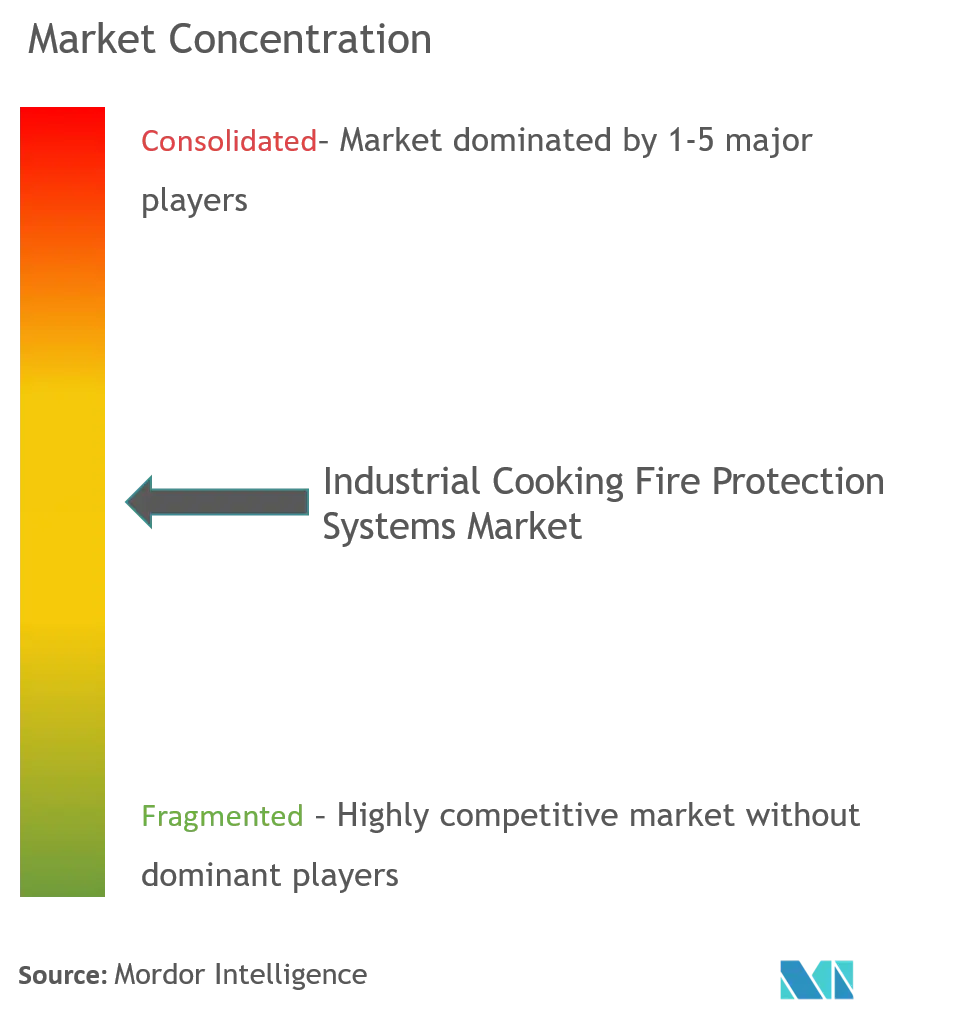
The industrial cooking fire protection systems market is moderately fragmented but tilting toward consolidation as large conglomerates acquire specialist technologies. Johnson Controls leverages its Tyco/Ansul brand depth to offer fully integrated detection, suppression and service bundles, anchoring multi-year framework deals with global QSR chains. Honeywell embeds kitchen modules inside its broader building-management ecosystem, crossing over cybersecurity, HVAC and occupant-safety data to offer holistic operational views.
Siemens’ USD 1.2 billion Danfoss Fire Safety takeover in December 2024 exemplifies the race for green suppression IP and enhances its Smart Infrastructure playbook Siemens. Private-equity-backed roll-ups-such as RapidFire Safety’s 2025 acquisition of Christopherson Fire Protection-aggregate regional installers into national platforms able to meet NICET staffing directives and tighter service-level agreements. Competitive differentiation is now less about nozzle metallurgy and more about API openness, analytics dashboards and zero-PFAS credentials.
Pricing power remains with vendors who bundle annual inspection and cloud monitoring, locking clients into multiyear service annuities. Smaller regional manufacturers still win on cost in emerging markets but face mounting certification hurdles and customer preference for suppliers that can furnish proof-of-performance data across continents.
Industrial Cooking Fire Protection Systems Industry Leaders
-
Ansul Incorporated
-
API Group Inc.
-
Emerson Electric Company
-
Johnson Controls International plc
-
Gentex Corporation
- *Disclaimer: Major Players sorted in no particular order
Industrial Cooking Fire Protection Systems Market Companies Covered in this Report
- Johnson Controls plc (Tyco/Ansul)
- Honeywell International Inc.
- Siemens AG
- API Group Corp.
- Minimax Viking GmbH
- Emerson Electric Co.
- Gentex Corporation
- Halma plc (Apollo Fire)
- Hochiki Corporation
- Robert Bosch GmbH (Bosch Security)
- NAFFCO FZE
- Kidde Fenwal Inc.
- Amerex Corporation
- Viking Group Inc.
- Buckeye Fire Equipment Co.
- Nitin Fire Protection Industries Ltd.
- Saval BV
- Gielle Industries
- Fireboy-Xintex LLC
- Fike Corporation
Read Analysis of Industrial Cooking Fire Protection Systems Companies
Market Opportunities and Future Outlook
The clearest opportunity sits in retrofit-heavy kitchens where compliance and documentation needs are rising, while operators also want fewer nuisance discharges and less downtime. Demand concentrates around integrated packages that connect detection, hood and duct protection, and fuel shut-off with serviceable maintenance logs aligned to NFPA 96 and NFPA 17A expectations, supporting insurer- and authority-driven inspection readiness across restaurants, hotels, institutions, and food-processing lines.
Digitization and service bundling also create room for differentiation, particularly for owners managing multi-site fleets who want remote health monitoring rather than periodic, manual checks. Vendor activity reinforces this direction, including Johnson Controls relaunching its Connected Sprinkler service with IoT and predictive analytics (June 2025), which suggests connected monitoring is being carried across broader fire protection portfolios. At the same time, PFAS-related chemistry shifts and procurement scrutiny are pushing suppliers to expand fluorine-free roadmaps, favoring platforms that can accommodate alternative agents, including water-mist approaches referenced in the report context, without forcing full ventilation rework on every retrofit.
Recent Industry Developments in Industrial Cooking Fire Protection Systems Market
- July 2026: APi Group completed the acquisition of WTech Fire Group in Europe. The deal expands APi Group's installed-base access across sprinkler, suppression, and detection, strengthening its ability to offer recurring inspection and service programs alongside equipment. It also adds scale in geographies where multi-site foodservice and institutional operators often standardize vendors.
- June 2026: APi Group completed the acquisition of Onyx-Fire Protection Services, a Canadian provider focused on inspection-first fire and life safety services. This expands APi Group's service footprint and increases exposure to recurring maintenance cycles that are central to commercial cooking system compliance regimes. The added technician capacity can shorten response times for inspections, repairs, and recharge events.
- August 2025: Johnson Controls launched the ANSUL Inert Gas System 300 (IGS-300) for suppression in sensitive environments such as data centers and petrochemical facilities. While not kitchen-specific, it signals continued ANSUL portfolio investment in engineered suppression and system design capabilities that can spill over into adjacent suppression platforms. The launch supports cross-selling through shared channels that already deliver detection, control panels, and service to commercial facilities.
Industrial Cooking Fire Protection Systems Market Report Scope and Research Methodology
Market Definition and Coverage
For this study, the industrial cooking fire protection systems market covers fixed fire detection and suppression solutions designed for commercial kitchens and industrial food processing cooking lines, including the system hardware plus the installation and service value captured at the system level.
Scope exclusions: Portable fire extinguishers and general retail safety products that are not part of a fixed kitchen protection system are excluded.
Segments Covered in This Report
- By Product Type
- Fire Detection Systems
- Flame Detectors
- Smoke Detectors
- Heat Detectors
- Fire Management/Suppression Systems
- Wet Chemical Systems
- Dry Chemical Systems
- Water-Mist Systems
- Foam Systems
- Fire Detection Systems
- By Suppression Agent
- Wet Chemical
- Dry Chemical
- Water-Mist
- Inert Gas/CO?
- By End-Use Industry
- Restaurants and Hotels
- Food-Processing Plants
- Institutional Kitchens (Hospitals, Schools, Prisons)
- Catering and Cloud-Kitchen Facilities
- By Connectivity
- Wired Systems
- Wireless/Cloud-Connected Systems
- By Geography
- North America
- United States
- Canada
- Mexico
- South America
- Brazil
- Argentina
- Rest of South America
- Europe
- Germany
- United Kingdom
- France
- Russia
- Rest of Europe
- Asia-Pacific
- China
- Japan
- India
- Australia
- Rest of Asia-Pacific
- Middle East and Africa
- GCC
- Turkey
- South Africa
- Rest of Middle East and Africa
- North America
Data Sources, Market Sizing, and Validation
Desk Research
Desk research was used to set clear counting rules and to anchor the model to real-world safety codes and installation patterns. We reviewed public standards and guidance such as NFPA (especially NFPA 96), OSHA resources, and UL certification references (such as UL 300), since these directly influence what types of systems get specified and accepted.
To size demand drivers, we used public macro and sector indicators where available, including government statistics on food manufacturing and foodservice activity, customs and trade releases for relevant equipment categories, and safety incident reporting and prevention publications from fire service and public agencies. Company filings, investor presentations, association websites, and reputable trade press helped validate typical system configurations, service attachment, and pricing movement. In addition, paid database subscriptions were used in a limited way for company financials and news checks, patent lookups for suppression agents and detection components, and import or export shipment-level signals where classification allowed. The sources named above are illustrative rather than exhaustive, and additional public and paid references were also used for data collection, cross-checking, and clarification.
Primary Interviews and Surveys
Primary work focused on confirming what gets installed in commercial kitchens and industrial cooking lines, and how replacement cycles and service contracts behave across geographies. We spoke with a mix of system manufacturers, distributors, installers, kitchen ventilation specialists, and facility safety managers, and we used this input to validate assumptions on code-driven retrofits, system pricing, and regional adoption differences across APAC, EMEA, and the Americas.
Distribution of primary research fieldwork respondents
| Company type | Respondent position | Region |
|---|---|---|
| Top tier: 31% | CXOs: 16% | APAC: 43% |
| Mid tier: 49% | Functional/Unit leaders: 25% | EMEA: 30% |
| Smaller Players: 20% | Managers: 59% | Americas: 27% |
Market-Sizing & Forecasting
Sizing starts with a top-down build that reconstructs the addressable installed base by using code coverage, meaning kitchens and cooking lines that typically must meet NFPA 96-type requirements, and then applying adoption and replacement rates to reach annual demand. After that demand pool is set, value is estimated using system-level pricing that reflects system type, hood and duct complexity, and the mix of new installations versus retrofits.
To keep the math practical, we used a small set of market fingerprints as inputs, including commercial kitchen and food processing site additions, retrofit intensity linked to inspection cycles, the share of UL 300 compliant wet-chemical systems in grease applications, service contract attachment rates, and observed price movement for detection panels, nozzles, and agent refills. Results were corroborated with selective bottom-up approximations, including sampled installer quotes, distributor channel checks, and supplier revenue splits, which were then used to adjust totals when large gaps appeared. Where direct inputs were thin, gaps were handled by using proxy ratios from similar code-driven fire protection installs, followed by follow-up validation in primary discussions.
For forecasting, scenario analysis was used so growth can flex with the pace of foodservice outlet expansion, enforcement strictness, and retrofit waves, and then the chosen case was aligned to what primary experts saw as most likely. A light time-series smoothing step was also applied to stable drivers, such as replacement cycles and service share, so the year-to-year curve stays consistent with real purchase behavior.
Data Validation & Update Cycle
Validation was done through multiple checks, where outputs were compared against independent signals like code adoption activity, installation backlogs discussed by channel participants, and the direction of pricing for suppression agents and key hardware. When outliers showed up, the assumptions behind adoption, service share, or pricing were reviewed again, and follow-up outreach was triggered if the variance could not be explained by a known regional or regulatory factor.
Before sign-off, the numbers go through a multi-step analyst review so calculation logic, units, and currency conversion timing remain consistent across regions. Reports refresh annually, with interim updates when a material event changes demand or pricing, such as code shifts, suppression chemistry restrictions, or sharp swings in new kitchen project activity. Before delivery, a fresh final pass is completed so clients receive the latest view that can be supported with repeatable steps and clear inputs.
Mordor Intelligence's Industrial Cooking Fire Protection Systems Market Estimate Compared With Other Published Estimates
Published market values for this space can diverge because different publishers do not always count the same system elements, and base years and price updates are also handled differently. The benchmark table helps show how shifts in what is included, and how service value is treated, can change the total even when the growth story reads similarly.
The table shows a spread that mostly comes from whether the estimate sticks to fixed, kitchen-specific protection installed with hoods and exhausts, or whether it blends in broader fire safety spending tied to whole buildings. The table also points to a timing gap, where Mordor Intelligence's model is refreshed with the latest base-year price and mix assumptions for UL 300 compliant wet-chemical systems and associated installation activity, instead of carrying older base-year structures forward.
Benchmark comparison
| Source | Market Size | Gaps in Research Methodology |
|---|---|---|
| Mordor Intelligence | USD 37.15 B (2025) | |
| Trade Journal A | USD 2.83 B (2025) | Uses a narrower definition centered on cooking-line protection for food manufacturing and often excludes a large share of commercial kitchen installs, which reduces the addressable demand pool and the service value captured. |
| Global Consultancy B | USD 34.30 B (2021) | Anchors the series to an older base year and applies a growth curve through 2031 that may not be rechecked against current retrofit intensity, and it can also recognize service and maintenance value differently in the total. |
Overall, the differences are best explained by scope choices, base-year timing, and how installation and service value are recognized in the total. We keep the model traceable to code-linked installation activity, replacement cycles, and system-level pricing checks, which makes the outcome easier to reproduce and explain on a client call.
Key Questions Answered in the Report
What is the current size of the industrial cooking fire protection systems market?
The market reached USD 37.15 billion in 2025 and is projected to hit USD 51.88 billion by 2031 on a 5.73% CAGR.
Which product type holds the largest share?
Fire detection systems remain the largest segment, accounting for 57.82% of 2025 revenue.
Why are water-mist systems growing faster than wet-chemical agents?
Regulators are phasing out PFAS in foams, and water-mist delivers comparable suppression with superior environmental credentials, driving a 6.95% CAGR.
Which region is expanding the quickest?
Asia-Pacific is the fastest-growing region at 6.18% CAGR as urbanization fuels new restaurant and hotel kitchens.
How are IoT solutions changing kitchen fire protection?
Cloud-connected sensors provide real-time diagnostics and maintenance alerts, cutting false-alarm downtime and qualifying operators for insurance rebates.
What impact do NFPA 96 and UL 300 mandates have on market demand?
Strict enforcement forces retrofits and new installations, adding roughly 1.2% to the forecast CAGR and expanding recurring service revenue.