
Market Overview
| Study Period | 2021 - 2031 |
|---|---|
| Market Size (2026) | USD 9.19 Billion |
| Market Size (2031) | USD 12.59 Billion |
| Growth Rate (2026 - 2031) | 6.49 % |
| Fastest Growing Market | Asia Pacific |
| Largest Market | North America |
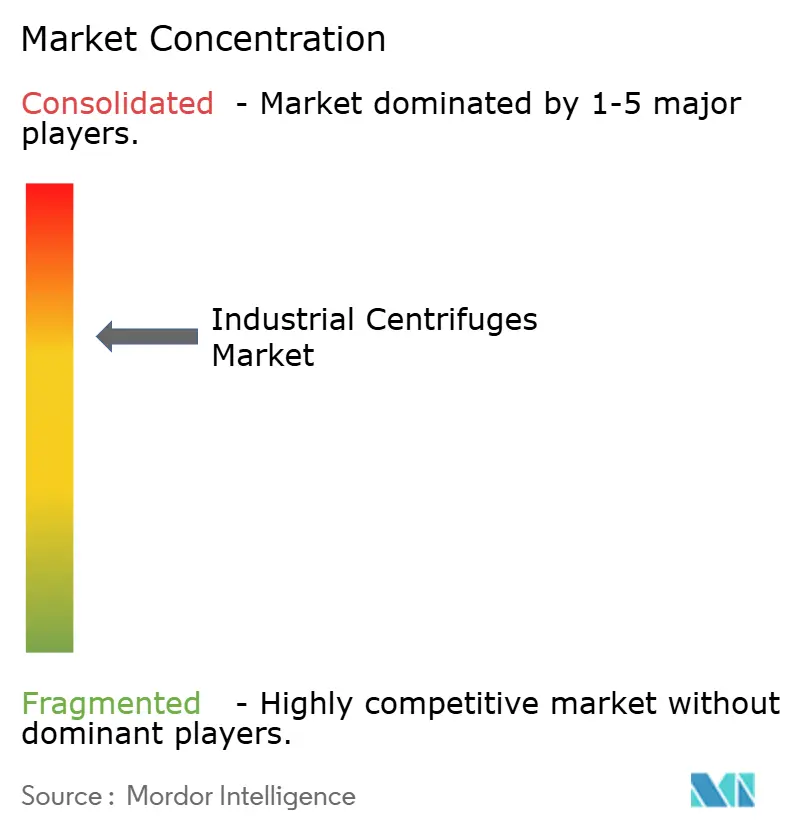
| Market Concentration | Medium |
Major Players *Disclaimer: Major Players sorted in no particular order Image © Mordor Intelligence. Reuse requires attribution under CC BY 4.0. | |
Industrial Centrifuges Market Analysis by Mordor Intelligence
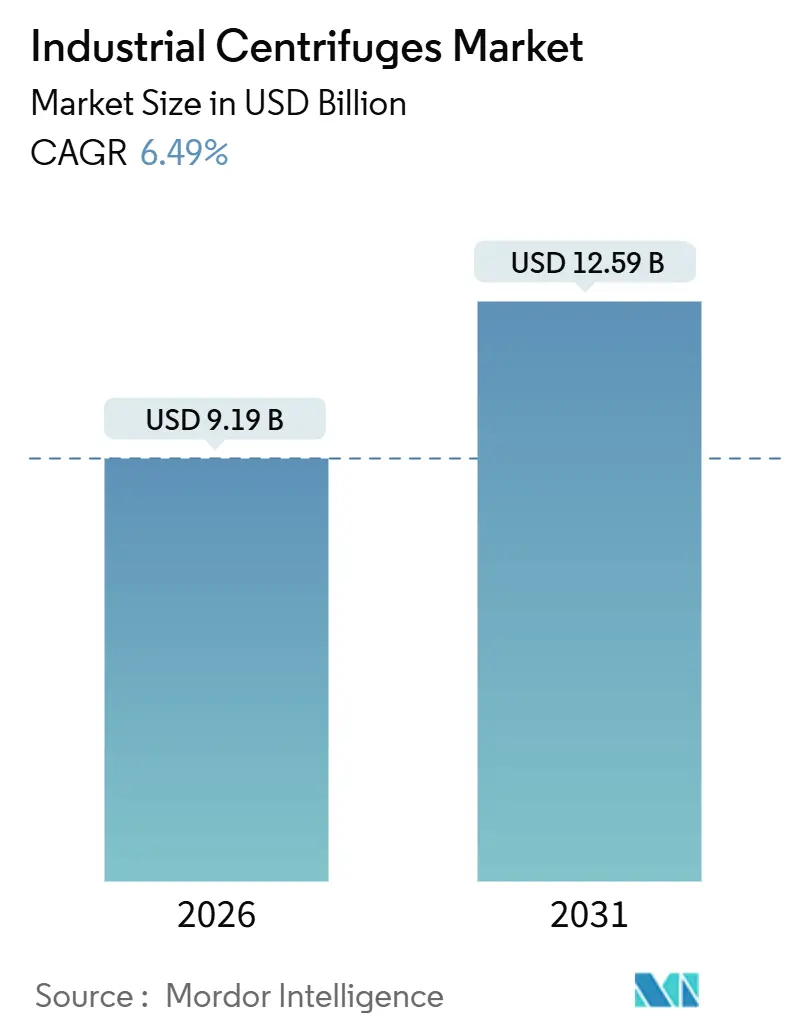
The Industrial Centrifuges Market size is estimated at USD 9.19 billion in 2026, and is expected to reach USD 12.59 billion by 2031, at a CAGR of 6.49% during the forecast period (2026-2031).
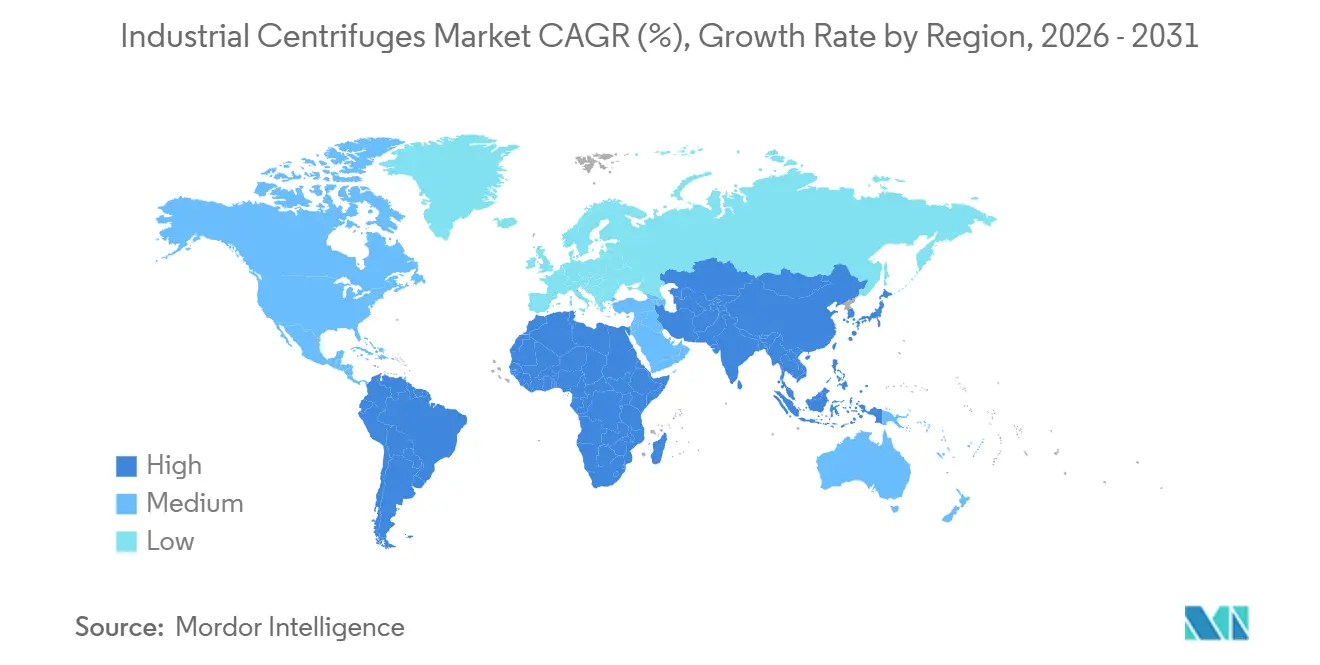
Solid growth stems from stricter wastewater-discharge rules, pharmaceutical and biotech capacity additions, and a rapid build-out of lithium-ion battery-recycling lines, all of which are pushing operators toward higher-throughput, higher-purity separations.[1] Sedimentation units maintained leadership, yet filtering variants are scaling quickly as drug-makers and specialty-chemical producers tighten purity targets. Vertical designs are gaining share in cleanrooms where every square meter of floor area carries a premium. Continuous-mode machines dominate high-volume commodities, but batch equipment is steadily rising in regulated multiproduct suites. Regionally, North America benefits from federal infrastructure and reshoring programs, while Asia-Pacific accelerates on the back of Zero Liquid Discharge mandates and pharmaceutical export growth.[2]
Key Report Takeaways
- By type, sedimentation centrifuges captured 56.6% of the industrial centrifuge market share in 2025. Filtering centrifuges are forecast to expand at a 7.2% CAGR from 2026 to 2031.
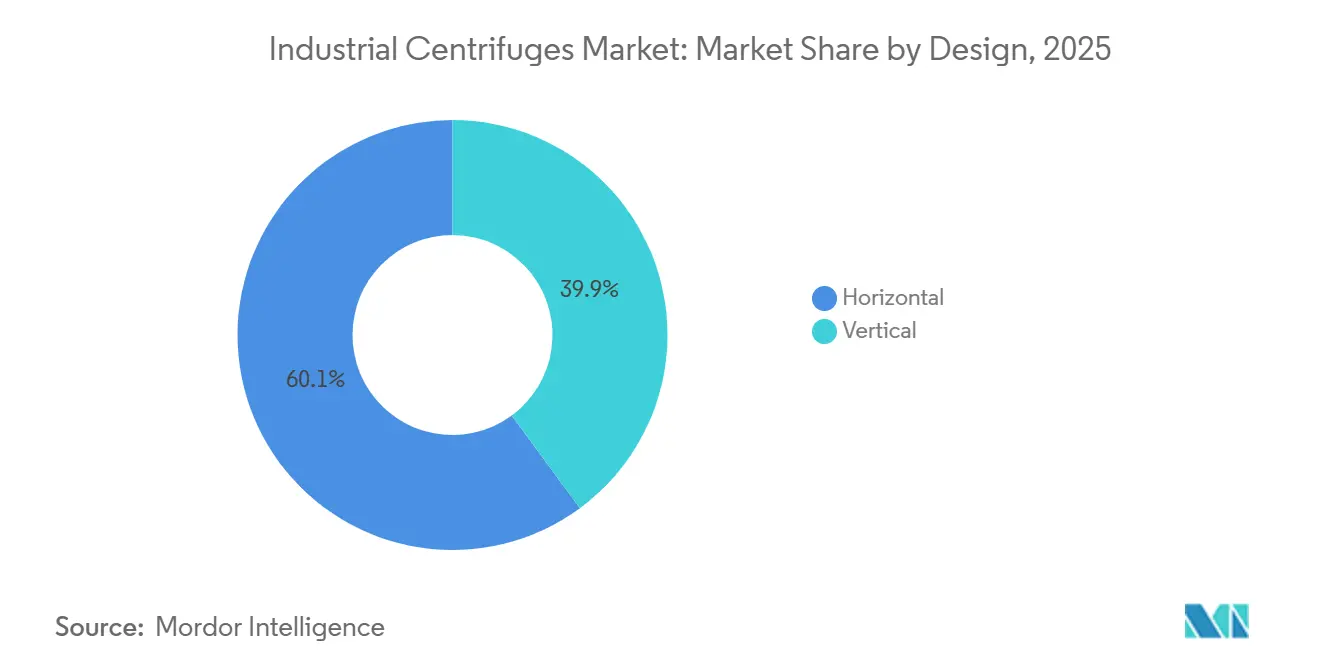
- By design, horizontal machines led with 60.1% revenue share in 2025. Vertical configurations are projected to grow at a 7.6% CAGR through 2031.
- By operation mode, continuous centrifuges held a 66.3% share in 2025. Batch units are advancing at a 7.8% CAGR between 2026 and 2031.
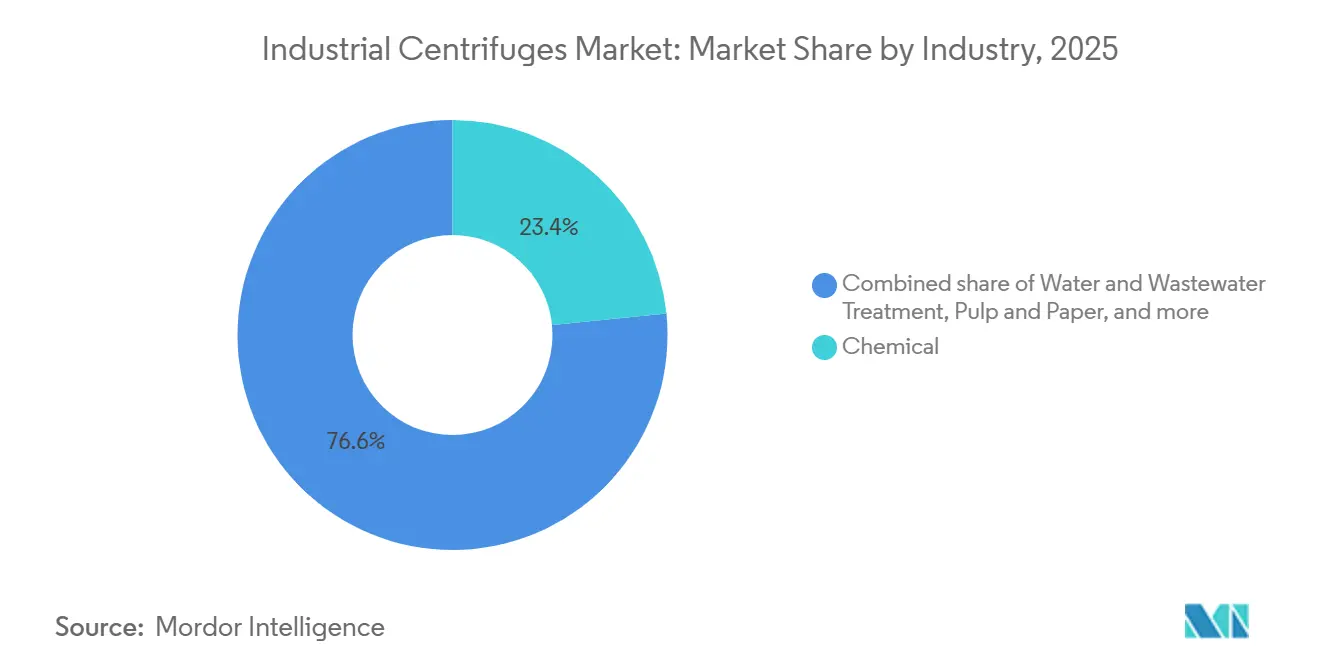
- By industry, chemical processing commanded a 23.4% share of the industrial centrifuge market size in 2025. Water and wastewater treatment is expected to post the fastest 8.3% CAGR to 2031.
- By geography, North America led with 36.7% revenue share in 2025. Asia-Pacific is anticipated to grow at a 7.5% CAGR through the forecast horizon.
Note: Market size and forecast figures in this report are generated using Mordor Intelligence’s proprietary estimation framework, updated with the latest available data and insights as of January 2026.
Market Trends and Insights
Drivers Impact Analysis of Industrial Centrifuges Market*
| Driver | (~) % Impact on CAGR Forecast | Geographic Relevance | Impact Timeline |
|---|---|---|---|
| Stringent wastewater regulations | +1.2% | Global (North America, EU, China) | Medium term (2-4 years) |
| Capacity expansion in pharma & biotech | +1.4% | North America, Europe, India, Singapore | Short term (≤2 years) |
| Demand from food & beverage clarification | +0.8% | Europe, North America | Long term (≥4 years) |
| Industrial wastewater-reuse mandates | +1.1% | APAC core, Middle East, South America | Medium term (2-4 years) |
| Surge in Li-ion battery-recycling lines | +1.3% | North America, Europe, China, South Korea | Short term (≤2 years) |
| Scale-up of algae-based biofuel plants | +0.6% | North America, select APAC markets | Long term (≥4 years) |
| Source: Mordor Intelligence | |||
Stringent Wastewater Regulations
EPA’s 40 CFR Part 437 limits are forcing centralized waste-treatment operators to adopt decanter centrifuges that yield drier cake and lower disposal volumes. China’s updated Water Pollution Prevention and Control Law drives Zero Liquid Discharge installations in chemical parks, favoring compact vertical designs able to handle saline brines. In the EU, Industrial Emissions Directive updates require pulp-and-paper mills to cut suspended solids, spurring retrofits with disc-stack separators that achieve turbidity below 10 NTU. Brownfield space constraints give vertical machines an edge, while compliance deadlines stretching to 2028 anchor multi-year aftermarket demand.
Capacity Expansion in Pharma & Biotech
AGC Biologics doubled its Copenhagen capacity in 2025 and installed automated disc-stack separators that trim harvest cycle time by 40%.[3] Grifols’ FDA-approved plasma line in North Carolina employs tubular-bowl centrifuges to reach 98% immunoglobulin purity.[4] Modular cleanrooms and single-use bioreactors fuel demand for skid-mounted vertical centrifuges, allowing contract manufacturers to switch campaigns within 72 hours. Biosimilar ramp-ups in India and South Korea extend growth, as filtering centrifuges deliver tighter particle-size control critical for bioavailability.
Demand from F&B Clarification
Juice and beverage processors are trading settling tanks for hermetic disc-stack separators that support cold-pressed, extended-shelf-life SKUs. European dairy cooperatives installed more than 150 clarifiers in 2024-2025 to hit bacterial-count rules under Regulation (EC) No 853/2004. Craft breweries recover yeast with compact horizontal decanters, cutting wastewater costs by 60% and creating resale biomass streams. Plant-based drink makers deploy three-phase decanters to separate oil, proteins, and water in one step, although membranes are gaining share where gentle handling outweighs throughput.
Industrial Wastewater-Reuse Mandates
China targets 30% industrial water reuse by 2025, prompting Jiangsu and Shandong chemical parks to install decanters ahead of reverse-osmosis polishing. The UAE’s law on industrial recycling pushes petrochemical complexes toward disc-stack separators for oil-water splits. India’s revised textile standards cap total dissolved solids at 2,100 mg/L, driving dye houses to adopt pusher centrifuges for salt recovery. Continuous-mode systems suit 24/7 plants, yet batch machines gain ground in smaller facilities that process by campaign.
Restraints Impact Analysis of Industrial Centrifuges Market*
| Restraint | (~) % Impact on CAGR Forecast | Geographic Relevance | Impact Timeline |
|---|---|---|---|
| High capital expenditure | −0.9% | Global, acute in South America and MEA | Short term (≤2 years) |
| Elevated operating & energy cost | −0.7% | Europe, North America, select APAC markets | Medium term (2-4 years) |
| Competition from membrane technology | −0.5% | Global, focused in F&B and pharma | Long term (≥4 years) |
| Shortage of skilled centrifuge operators | −0.4% | North America, Europe, spill-over to APAC | Medium term (2-4 years) |
| Source: Mordor Intelligence | |||
High Capital Expenditure
A mining-tailings decanter can cost more than USD 2 million, and installation adds up to 40% on top, pressuring operators in South America and Southeast Asia to delay purchases. European suppliers now offer pay-per-tonne contracts that shift capex onto the OEM, but uptake remains low outside pharma. Custom bowl materials push lead times past 12 months, stretching project-finance windows.
Elevated Operating & Energy Cost
Disc-stack separators in European dairy plants run 15-20 kW nonstop, yielding annual electricity outlays of USD 15,000-25,000 per unit at 2026 tariffs. Variable-frequency drives can trim load 20-30%, yet retrofits cost up to USD 80,000. In abrasive mining duties, bearing swaps and bowl resurfacing lift opex by USD 30,000-50,000 a year, nudging some users toward membranes where solids content is modest.
*Our forecasts treat driver/restraint impacts as directional, not additive. The impact forecasts reflect baseline growth, mix effects, and variable interactions.
Industrial Centrifuges Market Segment Analysis
By Type:
Filtering Variants Gain on Purity DemandsSedimentation equipment retained 56.6% of the industrial centrifuge market share in 2025, thanks to entrenched use in mining, municipal sludge, and edible oil refining. Continuous decanters in copper-tailings ponds treat 100 m³/h and yield cake at 22% solids, while clarifiers in dairy achieve turbidity under 1 NTU. Filtering machines are forecast to grow 7.2% annually, capturing API crystallization, lithium-carbonate refining, and specialty-chemical purification. Basket units suit small-batch drug intermediates, whereas pusher designs run continuous adipic-acid crystals. Peeler centrifuges in battery-grade lithium facilities automate cake discharge and shield operators from caustic spray. As ISO 14644 cleanroom rules tighten, vertical filtering models that integrate clean-in-place features are becoming the standard in Grade C and D suites.
Both categories will coexist: sedimentation variants dominate where throughput, robustness, and low opex rule; filtering types win where purity, wash efficiency, and cake dryness directly influence product value. These divergent requirements underpin a balanced demand outlook and ensure no single technology displaces the other over the forecast window.
By Design:
Vertical Configurations Capture Cleanroom ShareHorizontal layouts held 60.1% of the industrial centrifuge market in 2025, driven by mining, wastewater, and shipboard installations where floor space is abundant and low center-of-gravity designs curb vibration. Decanters process 24/7 with minimal oversight, and horizontal disc-stack models in marine fuel-oil purification prevent sludge accumulation. Vertical machines, however, are set to compound 7.6% a year, propelled by cleanroom economics that price space at USD 5,000-10,000 per square meter. AGC Biologics’ Copenhagen site realized a 40% footprint saving by selecting vertical disc stacks, enabling two extra bioreactor trains within the same envelope. Vertical peeler centrifuges boost solvent containment, mitigating explosion hazards in flammable-solvent API plants. Battery-recycling lines favor vertical decanters because overhead conveyors feed slurry directly into top-mounted inlets.
The industrial centrifuge market will likely see convergence as suppliers refine hybrid geometries, tilted bowls, or modular frames that blend the space and maintenance advantages of both forms, smoothing adoption barriers across end-use sectors.

By Operation Mode:
Batch Flexibility Offsets Continuous EfficiencyContinuous centrifuges owned a 66.3% share in 2025, leveraging nonstop operation in bulk foods, base chemicals, and mining. Decanters in municipal biosolids log 8,000-10,000 hours yearly, with automated sludge discharge keeping uptime above 95%. Batch machines, projected to climb 7.8% CAGR, cater to multiproduct drug plants and specialty-chemical campaigns. Basket and peeler units permit rapid switchover and cleaning validation within six hours, crucial under FDA 21 CFR Part 211 and EU GMP Annex 1. Grifols processes donor pools individually via batch tubular-bowl designs that sustain lot traceability. In battery-recycling pilots, batch filtering centrifuges handle assorted chemistries, enabling parameter tweaks between campaigns to maximize yield.
With personalized medicine, cell-therapy, and bespoke specialty-chemical streams gaining share, the industrial centrifuge market will continue to balance continuous throughput gains with batch-driven flexibility, each commanding loyalty in its respective niche.
By Industry:
Water Treatment Outpaces Chemical IncumbencyChemical processing remained top at 23.4% revenue share in 2025, underpinning solvent recovery, polymer dewatering, and catalyst recycling. Decanters in polyvinyl-chloride resin streams reduce downstream drying energy by 40%, while disc stacks reclaim palladium catalysts in fine-chem plants. Water and wastewater treatment is expected to record the highest 8.3% CAGR, thanks to 40 CFR Part 437 and China’s Zero Liquid Discharge mandates that force mechanical dewatering before disposal or reuse. Municipal utilities in North America are swapping belt presses for decanters, cutting polymer use by 30% and producing dryer cake for land application. Textile mills in India retrofit disc stacks to hit solids limits below 30 mg/L, avoiding hefty discharge penalties.
Pharma and biotech strides mirror capacity expansions; F&B applications widen with craft-brew yeast recovery and plant-based protein clarification. Mining, pulp-and-paper, and power generation represent steady albeit cyclical demand based on commodity pricing and environmental upgrades.
Geography Analysis
North America Industrial Centrifuges Market
North America secured 36.7% of 2025 revenue, buoyed by federal infrastructure funds, battery gigafactory buildouts, and near-shoring of critical pharma actives. Li-Cycle’s Rochester and BASF’s planned South Carolina sites alone will need roughly 20 industrial centrifuges for black-mass and precursor processing. Alberta’s oil-sands producers invest USD 500 million annually in tailings decanters to satisfy reclamation rules, while Mexico’s API hubs add hermetic disc stacks to comply with FDA and EMA standards.
APAC Industrial Centrifuges Market
Asia-Pacific is projected to log a 7.5% CAGR, the fastest global clip. China’s chemical parks deployed more than 300 new decanters across 2024-2025 to meet Zero Liquid Discharge obligations. India’s Hyderabad-Ahmedabad pharma corridor adopts vertical disc stacks for biosimilar lines targeting Western export markets. Japan and South Korea retrofit municipal and industrial wastewater plants with energy-saving vertical separators, and ASEAN nations scale palm-oil and rubber centrifuge capacity amid sustainability incentives.
EMEA and South America Industrial Centrifuges Market
Europe retains a sizeable share as the Industrial Emissions Directive tightens limits and the revised Urban Wastewater Treatment Directive imposes nutrient caps, compelling clarifier upgrades in municipal facilities. Energy-intensive regions like Germany favor bowl designs with regenerative braking to offset high electricity tariffs. South America sees sporadic yet high-value orders in Chilean copper and Brazilian lithium mines, while MEA water-reuse projects in the UAE and Saudi Arabia rely on disc-stack separators for desalination brine. Africa’s mining belts prefer refurbished units due to foreign-exchange hurdles, keeping sales volumes low but aftermarket services active.
Regulatory Landscape
Industrial centrifuge OEMs and end users work within a layered compliance environment spanning machinery safety, electrical safety, and site-specific hazardous-area rules. In the European Union, Machinery Regulation (EU) 2023/1230 replaces the Machinery Directive 2006/42/EC and becomes mandatory from January 20, 2027, tightening essential health and safety requirements and extending expectations around software-enabled safety functions, including provisions that touch AI-enabled functions and cybersecurity. Alongside this, centrifuge safety expectations are shaped by harmonized standards such as EN 12547:2014 (Centrifuges, common safety requirements), flagged for revision as of July 1, 2026, which can drive documentation updates and re-validation for EU market access.
Outside the EU, design choices are increasingly influenced by efficiency and component-level rules that affect centrifuge packages through motors and drives. In the United States, the Department of Energy energy conservation program under 10 CFR Part 431 continues to tighten efficiency baselines for commercial and industrial equipment, including recent final rules affecting expanded-scope electric motors (effective April 2025, with compliance timelines extending to January 2029) and other rotating equipment categories. These timelines can pull suppliers into earlier redesign cycles for motor-drive selections, while users in regulated settings (including pharmaceutical GMP suites and wastewater treatment plants) continue to specify validated safety and performance characteristics aligned with applicable national codes and procurement standards.
Competitive Landscape
The top five suppliers, Alfa Laval, GEA, Andritz, Flottweg, and Mitsubishi Kakoki, control an estimated 45-50% of global revenue, indicating moderate concentration. European incumbents differentiate through integrated automation, predictive maintenance, and global service footprints that cut unplanned downtime up to 30%. Chinese and Indian challengers offer 15-25% lower capital costs and shorter lead times, winning orders in price-sensitive municipal projects and emerging markets. Alfa Laval’s latest disc-stack line lowers energy use by 20% and embeds IoT sensors for vibration, bearing temperature, and solids load monitoring, enabling service interventions before failure. GEA’s retrofit program with a European dairy cooperative adds variable-frequency drives to 50 clarifiers, guaranteeing 25% power savings. Andritz niches into mining with tungsten-carbide-coated bowls that survive abrasive slurries for 5,000 hours, while Mitsubishi Kakoki positions peeler centrifuges for solvent-rich API crystallization, complete with ATEX Zone 1 compliance.
Competitive intensity will sharpen around battery recycling, algae biofuels, and pharmaceutical single-use suites, where domain know-how rather than price dictates vendor selection. Patent activity focuses on hermetic sealing, ceramic-composite bowls, and AI-driven separation algorithms, suggesting that software and materials will define the next wave of differentiation.
Industrial Centrifuges Industry Leaders
-
Alfa Laval AB
-
GEA Group AG
-
Andritz AG
-
Flottweg SE
-
Mitsubishi Kakoki Kaisha, Ltd.
- *Disclaimer: Major Players sorted in no particular order
Industrial Centrifuges Market Companies Covered in this Report
- Alfa Laval AB
- Flottweg SE
- Multotec (Pty) Ltd
- Mitsubishi Kakoki Kaisha Ltd
- Pieralisi MAIP S.p.A
- IHI Rotating Machinery
- Hiller Separation & Process
- Flsmidth (Escher Wyss)
- Andritz AG
- Ferrum Ltd
- Thomas Broadbent & Sons Ltd
- Centrisys Corp.
- G-Tech Separation
- FLSmidth & Co. A/S
- Hutchison-Hayes Separation
- GEA Group AG
- MSE Hiller
- HAUS Centrifuge Technologies
- Siebtechnik Tema
- SPX FLOW (Seital)
- Suez Water Technologies
- Andritz-Frautech
Market Opportunities and Future Outlook
Energy and resource efficiency retrofits are a near-term whitespace, especially where operators face high electricity tariffs and rising OPEX for continuous separation. This pull-through is visible in heavy-industry wastewater and refinery applications, where GEA commissioned petroMaster CF 5000 decanter centrifuges with Varipond C at a South American refinery in July 2026, using adjustable pond-depth control and nitrogen blanketing as levers for lower energy use and safer handling of oily streams. Similar efficiency-led packages, including variable-frequency drives and automation retrofits, map to the report scope and support demand for upgrade kits, controls, and service programs alongside new-build centrifuge sales.
Manufacturing footprint expansion and localized service capacity offer a second opportunity lane, particularly as lead times and skilled-operator availability remain constraints. Centrisys/CNP opened a new 70,000-square-foot facility in Kenosha, Wisconsin in July 2025, expanding large-scale production, repair, and pilot-testing capacity, while industrial operators continue to convert pilots into capital projects in by-product recovery. Tharaldson Ethanol moved from trial to full project implementation using Alfa Laval Prodec Oil Plus centrifuge technology in May 2026 to improve corn oil recovery and protein coproduct outcomes, reinforcing how centrifuges help monetize side streams in biofuels and fermentation-linked value chains. These examples align with the report drivers around wastewater compliance, higher-purity separations in regulated production, and upgrades to installed bases through automation, containment, and energy-saving features.
Recent Industry Developments in Industrial Centrifuges Market
- July 2026: GEA deployed two petroMaster CF 5000 decanter centrifuges at a South American refinery for oily wastewater treatment, integrating Varipond C and nitrogen blanketing for hazardous-area operation. The installation highlights the shift toward energy-optimized decanter configurations and tighter safety engineering in refining and petrochemical wastewater streams. It also reinforces demand for high-capacity continuous centrifuges paired with advanced control systems.
- December 2025: ANDRITZ commissioned a biological sludge drying plant at Eldorado Brasil Celulose in Tres Lagoas, Brazil, incorporating ANDRITZ sludge dewatering centrifuges. The project ties centrifuge demand to pulp-and-paper sustainability and wastewater management investments. It also expands reference installations for integrated dewatering and downstream sludge handling solutions.
- March 2024: GEA introduced Varipond C, a system for decanter centrifuges that enables real-time adjustment of the separation zone and pond depth across CF-series models. This technology direction supports users seeking to optimize throughput, energy use, and product quality without changing the core machine. It supports the retrofit and upgrade pathway for installed decanter bases in wastewater, chemicals, and processing industries.
Industrial Centrifuges Market Report Scope and Research Methodology
Market Definition and Coverage
This market covers industrial centrifuges sold for separating solids and liquids, or separating two liquids, in industrial processing and treatment settings. We size the market on equipment revenues linked to industrial separation applications across major end-use industries.
Scope exclusions: We exclude lab centrifuges, medical or blood centrifuges, and consumer-grade devices that are not bought for industrial processing duties.
Segments Covered in This Report
- By Type
- Sedimentation
- Clarifier/Thickener
- Decanter
- Disc-stack
- Hydrocyclone
- Other Sedimentation
- Filtering
- Basket
- Scroll-screen
- Peeler
- Pusher
- Other Filtering
- Sedimentation
- By Design
- Horizontal
- Vertical
- By Operation Mode
- Batch
- Continuous
- By Industry
- Food and Beverages
- Pharmaceutical and Biotech
- Water and Wastewater Treatment
- Chemical
- Metals and Mining
- Power Generation
- Pulp and Paper
- Other Industries
- By Geography
- North America
- United States
- Canada
- Mexico
- Europe
- Germany
- United Kingdom
- France
- Italy
- Spain
- NORDIC Countries
- Russia
- Rest of Europe
- Asia-Pacific
- China
- India
- Japan
- South Korea
- ASEAN Countries
- Australia and New Zealand
- Rest of Asia-Pacific
- South America
- Brazil
- Argentina
- Chile
- Colombia
- Rest of South America
- Middle East and Africa
- United Arab Emirates
- Saudi Arabia
- Egypt
- South Africa
- Nigeria
- Rest of Middle East and Africa
- North America
Data Sources, Market Sizing, and Validation
Desk Research
Desk research starts with public data that helps us understand where separation equipment demand is coming from and how fast end markets are expanding. Sources such as the US EPA, Eurostat, the World Bank, UN Comtrade, and the International Energy Agency were used to ground inputs like wastewater investment direction, industrial output signals, and trade movements for machinery categories related to separation equipment.
We also reviewed company annual reports, investor presentations, and product catalogs to map typical centrifuge designs, use cases, and replacement cycles that buyers follow. Patent databases were used to track technology movement in decanters, disc stack systems, and automation features, which supports realistic adoption curves. Select paid subscriptions for company financials and news were used to clarify revenue disclosures and major order announcements. These desk sources are illustrative, and additional public references were consulted for data collection, cross-checking, and clarification.
Primary Interviews and Surveys
Primary work centered on interviews and short surveys with equipment manufacturers, channel partners, EPC and plant engineering teams, and end users in sectors like water and wastewater, chemicals, food processing, metals and mining, and pharma. Because this is a global market, we covered APAC, EMEA, and the Americas to validate and adjust assumptions on utilization, lead times, and typical pricing by design and duty.
Distribution of primary research fieldwork respondents
| Company type | Respondent position | Region |
|---|---|---|
| Top tier: 27% | CXOs: 16% | APAC: 37% |
| Mid tier: 54% | Functional/Unit leaders: 27% | EMEA: 37% |
| Smaller Players: 19% | Managers: 57% | Americas: 26% |
Market-Sizing & Forecasting
Sizing is built using a top-down approach where industrial activity and treatment demand are reconstructed into an addressable equipment pool, then filtered through centrifuge penetration and replacement needs. To keep totals realistic, we corroborate the results with selective bottom-up approximations such as sampled unit volumes by centrifuge design, typical ASP ranges by capacity and materials of construction, and channel checks on project ordering patterns.
Key model inputs include wastewater and sludge handling activity, process industry capacity additions, mining and mineral processing activity, and the mix shift between sedimentation and filtering duties. We also track design preference (horizontal versus vertical) and operation mode (batch versus continuous) because these factors change unit economics and purchase frequency. Forecasts are produced using scenario analysis supported by short trend lines on industrial production and municipal treatment investments, then refined using primary feedback on lead times, utilization, and pricing progression. When a bottom-up view is incomplete for smaller countries, we handle gaps by applying validated intensity factors to industrial output and population served by treatment infrastructure, followed by a reasonableness check against trade and installed base signals.
Data Validation & Update Cycle
Validation is done through multiple checks that compare model outputs against independent signals, such as industrial production direction, wastewater treatment expansion indicators, and machinery trade movement in relevant categories. Outliers are reviewed, assumptions are revisited, and follow-up calls are triggered when pricing, duty mix, or regional growth looks inconsistent with what stakeholders report.
Before sign-off, the model goes through multi-step internal reviews so calculation logic, units, and currency conversions stay consistent across regions. Reports are refreshed annually, and interim updates are made when material events occur, such as major regulatory shifts or large capacity announcements. Right before delivery, an analyst completes a fresh pass to ensure clients receive the latest updated view.
Mordor Intelligence's Industrial Centrifuges Market Size Measured Against Other Published Estimates
Published market sizes for industrial centrifuges often do not match because each publisher makes different choices on what is counted, which year is treated as the starting point, and how pricing changes are carried through the forecast. We also see differences when some studies lean more on shipment value proxies, and others lean more on end-market demand signals.
A common gap comes from bundling adjacent equipment and service revenues into the same headline value, which can lift the number even if unit demand is unchanged. Some estimates also anchor to an earlier base year and then apply a smooth CAGR that does not fully reflect recent shifts in wastewater investment timing, process industry capex cycles, and duty mix between sedimentation and filtering applications. External totals can therefore land higher or lower depending on how ASP inflation, currency timing, and regional weighting are handled.
Benchmark comparison
| Source | Market Size | Gaps in Research Methodology |
|---|---|---|
| Mordor Intelligence | USD 9.19 B (2026) | |
| Trade Journal A | USD 7.30 B (2022) | Uses an earlier base year and a slower growth profile, and the published figure is often presented as a broad global total without the same level of cross-checking against design-level pricing and end-use replacement behavior. |
| Industry Analytics B | USD 8.20 B (2025) | Covers industrial centrifuges plus centrifugal separation equipment, which typically expands scope beyond core centrifuge systems, and it can blend equipment categories that buyers budget separately. |
The table shows that timing and scope choices explain most of the spread. Some sources start from an older year or fold in wider centrifugal separation categories, and then apply a single growth rate across regions. In contrast, Mordor Intelligence counts industrial centrifuge revenues only when the equipment is purchased for industrial separation duties, and the totals are repeatedly checked against end-market activity, duty mix, and practical price bands.
Key Questions Answered in the Report
What is the projected value for the industrial centrifuges market through 2031?
The market is expected to reach USD 12.59 billion from USD 9.19 billion in 2026, expanding at a 6.49% CAGR between 2026 and 2031.
Which centrifuge type is growing fastest?
Filtering centrifuges are forecast to grow 7.2% annually, propelled by pharmaceutical API crystallization and battery-material purification.
Why are vertical centrifuges gaining traction?
Vertical designs save up to 40% floor space, a key benefit in cleanrooms where space costs USD 5,000-10,000 per m² per year.
Which end-use segment should see the highest growth?
Water and wastewater treatment is projected to post an 8.3% CAGR, driven by stricter discharge regulations in major economies.
What is the main competitive advantage of leading suppliers?
Market leaders differentiate through integrated automation and predictive-maintenance platforms that cut unplanned downtime by as much as 30%.
How do energy costs affect centrifuge adoption?
High electricity tariffs, especially in Europe, make operating disc-stack units expensive; variable-frequency drives can lower energy draw by up to 30%.