
Market Overview
| Study Period | 2021 - 2031 |
|---|---|
| Market Size (2026) | USD 41.93 Billion |
| Market Size (2031) | USD 93.71 Billion |
| Growth Rate (2026 - 2031) | 17.45 % |
| Fastest Growing Market | Asia-Pacific |
| Largest Market | Asia-Pacific |
| Market Concentration | Medium |
Major Players *Disclaimer: Major Players sorted in no particular order Image © Mordor Intelligence. Reuse requires attribution under CC BY 4.0. | |
Industrial Battery Market Analysis by Mordor Intelligence
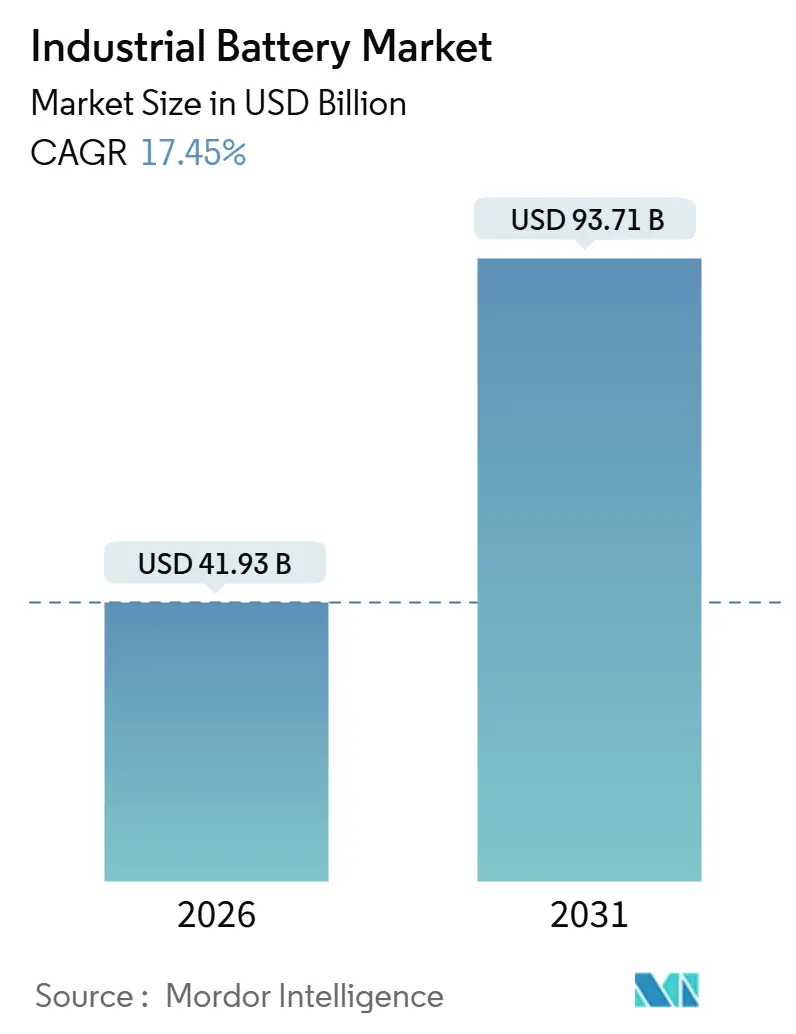
The Industrial Battery Market size is estimated at USD 41.93 billion in 2026, and is expected to reach USD 93.71 billion by 2031, at a CAGR of 17.45% during the forecast period (2026-2031).
Rapid price erosion in lithium-ion cells, clean-energy subsidies in North America and Europe, and renewable-paired storage mandates in Asia-Pacific are steering capital away from combustion-based backup toward electrochemical storage across grid, telecom, data-center, and logistics operations. Telecom tower operators, hyperscale data-center owners, and warehouse integrators are now modeling decade-long replacement cycles that favor lithium-ion’s long service life, even as fire-risk insurance costs and critical-mineral volatility temper short-term margins.
Key Report Takeaways
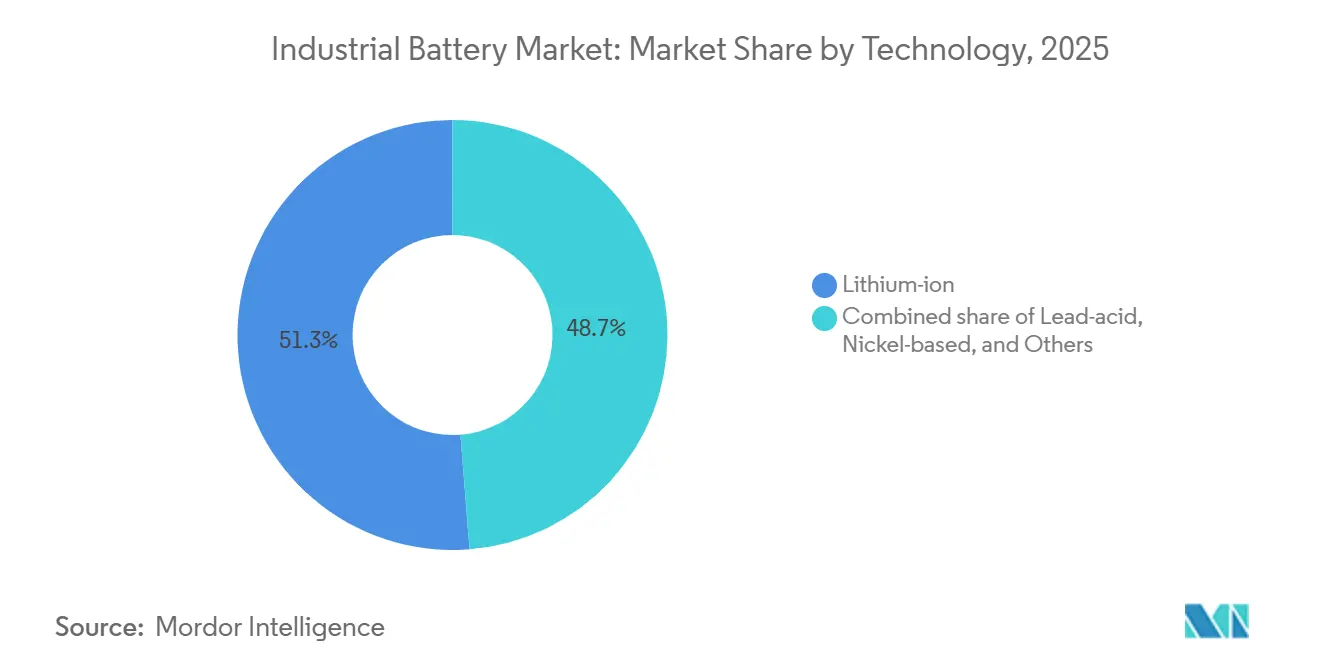
- By technology, lithium-ion captured 51.26% of the industrial battery market share in 2025 and is projected to expand at an 18.56% CAGR through 2031.
- By application, forklift and motive-power systems accounted for a 31.65% share of the industrial battery market size in 2025 and are advancing at an 18.65% CAGR through 2031.
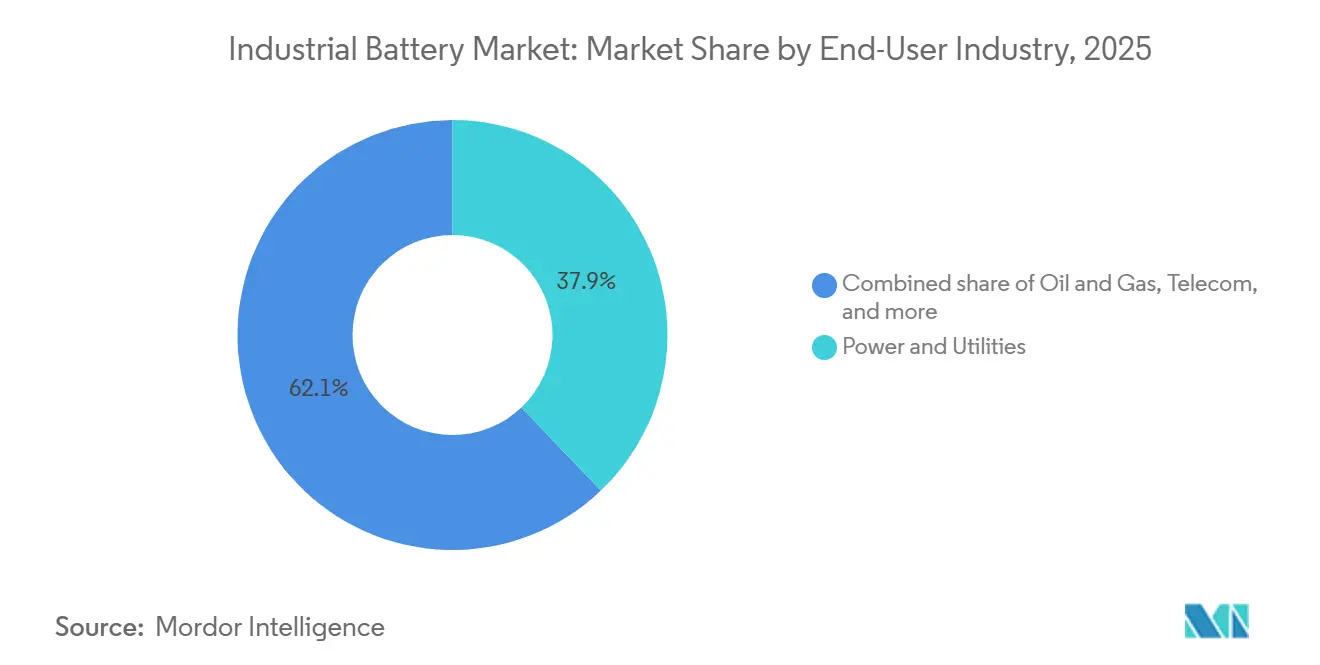
- By end-user, power and utilities led with 37.88% spending in 2025; manufacturing and warehousing record the fastest forecast CAGR at 18.65% through 2031.
- By geography, Asia-Pacific commanded 49.92% revenue in 2025 and is expected to grow at a 19.53% CAGR through 2031.
Note: Market size and forecast figures in this report are generated using Mordor Intelligence’s proprietary estimation framework, updated with the latest available data and insights as of January 2026.
Market Trends and Insights
Drivers Impact Analysis of Industrial Battery Market*
| Driver | (~) % Impact on CAGR Forecast | Geographic Relevance | Impact Timeline |
|---|---|---|---|
| Declining lithium-ion battery cost curve | +3.2% | Global, with steepest drops in China and accelerating in North America post-IRA | Medium term (2-4 years) |
| Renewable-powered ESS build-outs | +4.1% | APAC core (China, India), spillover to North America and Europe | Long term (≥ 4 years) |
| Warehouse automation & AGVs surge | +2.8% | North America, Europe, APAC manufacturing hubs (China, Japan, South Korea) | Short term (≤ 2 years) |
| DC micro-grids in data centers | +1.9% | North America (hyperscale clusters), Europe, emerging in APAC | Medium term (2-4 years) |
| Telecom tower storage mandates | +2.3% | APAC (India, Southeast Asia, Africa), with regulatory push in emerging markets | Short term (≤ 2 years) |
| OEM-driven 2nd-life leasing models | +1.5% | Europe (EU Battery Regulation compliance), North America, early adoption in China | Long term (≥ 4 years) |
| Source: Mordor Intelligence | |||


Declining Lithium-Ion Battery Cost Curve
Pack prices slid to USD 115 per kWh in 2024, the sharpest drop since 2017, and major banks forecast sub-USD 80 per kWh by late 2026 as cell-to-pack integration cuts overhead. Chinese LFP cells traded at USD 50-53 per kWh in early 2024, forcing Western rivals to localize or cede margin. Utility-scale four-hour systems are now modeled to reach USD 147-243 per kWh by 2035, eroding lead-acid’s total-cost supremacy in telecom backup. Buyers increasingly align budgets to ten-year life-cycle analyses, tilting orders toward lithium-ion despite residual thermal-runaway concerns.
Renewable-Powered ESS Build-Outs
Grid-scale battery additions rose 38% year-over-year to October 2025 and are set to add 94 GW/247 GWh in 2025 alone, jumping to 220 GW/972 GWh by 2035 as intermittent solar and wind portfolios require firming capacity. The United States plans 18.2 GW of storage in 2025, benefiting from investment-tax credits and state mandates.[1]“Energy Storage Trends 2025,” U.S. Energy Information Administration, eia.gov China’s provincial rules force new renewables to pair 10-20% storage, creating near-term demand, although capped arbitrage margins cloud profitability. India targets 4 GWh of standalone storage by 2026 to stabilize high-renewable grids. Europe’s frequency-regulation premiums remain attractive for batteries, though interconnector growth could compress spreads after 2028.
Warehouse Automation & AGVs Surge
Automated guided vehicle (AGV) shipments topped 60,000 units in 2024, with lithium-ion powering more than 70% of new models due to opportunity-charging that halves downtime versus lead-acid.[2]“Warehouse Automation Report,” Material Handling Institute, mhi.org E-commerce hubs reclaim floor space by retiring battery-swap rooms, and sustainability pledges penalize lead-acid’s hazardous-waste profile. Forklift OEMs now position lithium-ion as the default on Class I and II trucks, reversing pre-2020 price hierarchies. The acceleration in warehouse electrification is unfolding faster than aggregate material-handling equipment revenue growth, tightening delivery lead-times for cell makers.
DC Micro-Grids in Data Centres
Hyperscale operators are piloting 48-V lithium-ion racks embedded in server rows, trimming conversion losses by up to 15% and delivering sub-millisecond failover. Google and Microsoft prototypes remove centralized UPS rooms, freeing real estate for compute expansion. AI workloads push megawatt-level peaks, making high-density batteries critical to avoid demand-charge penalties. Regulatory standards lag, with IEC DC-microgrid rules still in draft, injecting liability uncertainty that tempers mass rollout.
Restraints Impact Analysis of Industrial Battery Market*
| Restraint | (~) % Impact on CAGR Forecast | Geographic Relevance | Impact Timeline |
|---|---|---|---|
| Critical-mineral price volatility | -2.4% | Global, with acute exposure in regions dependent on Chinese intermediates (North America, Europe) | Short term (≤ 2 years) |
| Rising BESS fire-risk insurance costs | -1.6% | North America, Europe, South Korea (post-incident tightening); emerging in APAC | Medium term (2-4 years) |
| Lead-acid pollution regulations | -0.9% | Europe (EU Battery Regulation), China (emissions standards), India (Battery Waste Management Rules) | Medium term (2-4 years) |
| Solid-state tech "wait-and-see" effect | -1.2% | Global, particularly affecting long-term capital commitments in North America, Europe, and Japan | Long term (≥ 4 years) |
| Source: Mordor Intelligence | |||
Critical-Mineral Price Volatility
Lithium carbonate plunged 75% from its 2022 peak, then tightened again in 2025 as inventory destocking met robust demand, unsettling contract negotiations and cash-flow planning.[3]“Critical Minerals Market Review,” International Energy Agency, iea.org China processes more than 90% of anode materials and 85% of cathodes, amplifying geopolitical exposure for Western buyers. Supply bottlenecks in purified phosphoric acid and high-purity manganese sulfate can double input costs within a quarter, prompting buyers to shorten procurement cycles and raise working-capital buffers. U.S. strategic stockpiles address security rather than price, and may constrict spot availability.
Lead-Acid Pollution Regulations
Incidents at Moss Landing, California, and Korean utility sites triggered premium hikes of 20-50% and forced adoption of extra suppression gear, adding USD 20-50 per kWh to capex.[4]“Battery Fires and Insurance,” UL Solutions, ul.com UL 9540A propagation tests now extend commissioning 3-6 months, and South Korea has mandated real-time thermal monitoring. Developers prefer LFP chemistries for lower thermal risk but sacrifice energy density where land costs dominate.
*Our forecasts treat driver/restraint impacts as directional, not additive. The impact forecasts reflect baseline growth, mix effects, and variable interactions.
Industrial Battery Market Segment Analysis
By Technology:
Lithium-Ion Dominance Reshapes Chemistry MixLithium-ion held 51.26% revenue in 2025 and is projected to compound at 18.56% to 2031, solidifying its leadership in the industrial battery market. Lead-acid’s legacy telecom and starter-lighting niches shrink as buyers weigh total cost over calendar life. Nickel-based chemistries stay relevant in aerospace and rail, yet flat volumes reflect lithium-ion’s broadened temperature range.
Emerging sodium-ion cells promise 20-30% cost savings versus LFP by swapping abundant sodium for scarce lithium, while vanadium redox flow batteries gain traction for six-hour-plus discharge durations. Solid-state prototypes remain three-to-five-times costlier than lithium-ion, prompting most industrial buyers to monitor rather than commit. Recycling mandates accelerate lead-acid’s retreat in Europe, redirecting investment to higher-margin lithium-based lines.


By Application:
Industrial Automation Drives GrowthForklifts and motive-power systems captured 31.65% of the industrial battery market revenue in 2025 and are forecast to expand at 18.65% through 2031. Opportunity-charged lithium-ion packs eliminate midday swaps and free floor space, providing rapid payback for 24/7 warehouses.
Telecom backup upgrades accelerate after India’s mandate for four-hour autonomy, and data-center rack batteries gain popularity as space-saving alternatives to centralized UPS rooms. Grid-scale storage posts the fastest absolute gigawatt-hour growth, though profitability hinges on arbitrage spreads that grid operators can compress via demand response. Marine and rail auxiliaries remain a smaller base but show double-digit growth as maritime ports move toward zero-emission targets.
By End-User Industry:
Utilities Lead, Manufacturing AcceleratesPower and utilities accounted for 37.88% of 2025 spend and will grow at 18.21% through 2031, supported by record renewable additions and supportive tax credits. Manufacturing and warehousing trail in share yet mirror the growth trajectory as e-commerce behemoths retrofit fleets.
Oil and gas operators apply batteries to offshore platforms and remote wells to trim diesel reliance. Telecom carriers face rising power loads from 5G upgrades, favoring energy-dense lithium-ion banks. Transportation depots for buses and port cranes edge toward parity, helped by stricter carbon rules at major gateways.
Geography Analysis
APAC Industrial Battery Market
Asia-Pacific dominated the industrial battery market with 49.92% revenue in 2025 and will grow at 19.53% through 2031. China’s 85% share of global cell output and mandatory 10-20% storage pairing for new renewables spur demand, while India’s USD 2.4 billion Production-Linked Incentive lures 50 GWh of domestic capacity. South Korea’s LG Energy Solution and Samsung SDI exceed 520 GWh of combined capacity, exporting to North America and Europe. Japan remains focused on high-nickel cells for automotive and niche industrial uses.
North America Industrial Battery Market
North America benefits from a USD 35 per kWh production credit and 30+ gigafactory announcements since 2022, targeting 1 TWh of capacity by 2030. Canada’s mineral endowment positions it as a Western alternative, although refining lags extraction. Mexico attracts assembly investments but faces permitting bottlenecks.
Europe Industrial Battery Market
Europe’s Critical Raw Materials Act seeks 10% domestic sourcing and 40% local processing by 2030, supporting Northvolt, ACC, and CATL’s European lines. Germany, France, and the U.K. lead in frequency-regulation storage, though expanded interconnectors may pressure margins after 2028. Nordic hydropower attracts energy-intensive cathode synthesis, yet yield challenges slow ramp-ups.
MEA and South America Industrial Battery Market
South America and the Middle East-Africa remain nascent, with Brazil and the U.A.E. piloting utility-scale projects, but limited manufacturing keeps scale small relative to Asia-Pacific and North America.


Regulatory Landscape
The industrial battery regulatory environment is tightening around lifecycle transparency and safety, with Europe leading the change. The EU Battery Regulation (EU) 2023/1542 introduced phased requirements for industrial batteries above 2 kWh, including carbon footprint declarations from February 2025, labelling obligations from 2026, and QR-code enabled digital access from 2027. Commission Implementing Regulation (EU) 2025/2289, issued in Nov 2025, also established standardized Member State reporting formats for collection and recycling performance, reinforcing data readiness expectations for manufacturers and compliance schemes.
In the United States, policy emphasis remains split between safety assurance and supply-chain localization through incentives rather than prescriptive passports. In March 2026, the U.S. Department of Energy issued a USD 500 million Notice of Funding Opportunity under IIJA Sections 40207(b) and (c) to support domestic critical mineral and battery material manufacturing, recycling, and processing facilities, complementing existing IRA credits such as 45X and 48C that underpin industrial battery investments. As a result, global suppliers increasingly run dual compliance playbooks that align EU documentation and traceability needs while positioning North American projects to qualify for federal manufacturing and recycling support.
Competitive Landscape
The industrial battery market features moderate concentration: the top five cell makers, CATL, BYD, LG Energy Solution, Panasonic Energy, and Samsung SDI, control roughly 70% of global capacity. Chinese leaders wield 20-30% cost advantages through vertical integration from raw materials to packs, pressuring Western peers to localize or cede margin. Patent filings in solid-state electrolytes and silicon anodes rose 40% between 2023 and 2025, yet commercial timelines remain opaque, so buyers prioritize incremental lithium-ion gains.
Second-life programs emerge as a white-space: retired EV packs retain 70-80% capacity and sell into stationary projects at deep discounts, though warranty standards remain thin. Sodium-ion and flow-battery challengers court long-duration niches, but entrenched lithium-ion scale raises entry barriers. Regulation plays a pivotal role: IEC 62619 harmonizes safety certification across applications, yet diverging regional fire-safety protocols fragment product rollouts. Players with multi-chemistry portfolios and localized supply chains stand best positioned to navigate cost, policy, and technology shifts.
Industrial Battery Industry Leaders
EnerSys
East Penn Manufacturing
GS Yuasa Corporation
Exide Industries
Saft Groupe SA
- *Disclaimer: Major Players sorted in no particular order

Industrial Battery Market Companies Covered in this Report
- EnerSys
- East Penn Manufacturing
- Exide Industries
- GS Yuasa Corp.
- Saft Groupe SA
- Amara Raja Batteries
- Panasonic Energy
- CATL
- BYD Co. Ltd.
- LG Energy Solution
- Samsung SDI
- Johnson Controls
- Leoch Int'l
- JYC Battery
- Narada Power
- Crown Battery
- Hoppecke Batteries
- NorthStar Battery
- Trojan Battery
- Vision Group

Market Opportunities and Future Outlook
Utility-scale and behind-the-meter storage deployments are broadening demand for industrial batteries across grid operators, data centers, and industrial sites, while procurement increasingly favors bankable supply supported by local manufacturing footprints. Two recent signals of this shift include BYD securing an 11.275 GWh battery storage supply contract for Masdar's round-the-clock project in Abu Dhabi (July 2026), and LG Energy Solution and GM beginning mass production of LFP batteries for energy storage systems at their Tennessee joint venture facility (July 2026). These awards and ramp-ups support faster project execution for grid-scale ESS and industrial backup applications, where delivery lead time, warranty structure, and safety validation shape vendor selection.
A second opportunity area is chemistry diversification and localization as buyers try to balance cost, safety, and resilience given critical-mineral and fire-risk constraints. Sodium-ion is moving beyond pilot interest toward industrialization, with Peak Energy selecting Sacramento, California for a 4 GWh per year sodium-ion grid storage factory (July 2026). Europe and India are also targeting the ramp-up gap in domestic capacity, including the European Commission's Battery Booster Facility (June 2026), Eni and Seri Industrial starting construction of a gigafactory in Brindisi, Italy with a plan linked to 16 GWh annual capacity by 2030 (July 2026), and an MoU in Tamil Nadu for a large BESS manufacturing plant in Tirunelveli (July 2026). Together, these moves create room for integrators and OEMs to package cells, power electronics, software, and compliance documentation into repeatable industrial offerings for warehouses, telecom backup, and data-center power architectures.
Recent Industry Developments in Industrial Battery Market
- July 2026: Exide Technologies expanded its Marathon portfolio with the Marathon Pure Energy and Marathon Pure Energy FT TPPL AGM battery ranges and started production at its Portugal facility. The update strengthens Exide's European supply position for critical backup power applications where lead-acid variants still compete on cost, operating temperature tolerance, and established service networks. It also supports faster fulfillment for data center, telecom, and industrial standby projects that prioritize regional sourcing.
- July 2026: Eni and Seri Industrial started construction of a gigafactory in Brindisi, Italy with a plan linked to 16 GWh annual capacity by 2030. This collaboration highlights Europe’s emphasis on localized battery manufacturing to support downstream storage and grid resilience, indicating a step change in regional supply scale.
- May 2026: EnerSys launched the AlphaCell 4.0HP+ Thin Plate Pure Lead battery designed to improve replacement interval stability in outdoor communications networks. By updating TPPL performance for edge and telecom sites, EnerSys reinforces its position in applications where temperature swings and maintenance access affect total cost of ownership. The release complements lithium-focused offerings by keeping advanced lead-acid competitive in specific industrial backup duty cycles.


Industrial Battery Market Report Scope and Research Methodology
Market Definition and Coverage
The industrial battery market is defined as revenue earned from batteries designed mainly for industrial duty cycles, where they provide backup power or motive power in equipment and stationary systems across industries.
Scope exclusions: Consumer portable batteries and batteries used mainly for passenger EV propulsion are excluded from this market sizing.
Segments Covered in This Report
- By Technology
- Lithium-ion
- Lead-acid
- Nickel-based
- Others (incl. Flow Battery, Sodium-ion)
- By Application
- Forklift and Motive Power
- Telecom Backup
- UPS/Data Centres
- Grid-Scale ESS
- Others (incl Automated Guided Vehicles, Rail and Marine)
- By End-User Industry
- Power and Utilities
- Oil and Gas
- Manufacturing and Warehousing
- Telecom
- Others (incl Transportation and Logistics)
- By Geography
- North America
- United States
- Canada
- Mexico
- Europe
- Germany
- France
- United Kingdom
- Italy
- Spain
- Nordic Countries
- Russia
- Rest of Europe
- Asia-Pacific
- China
- Japan
- India
- South Korea
- ASEAN Countries
- Rest of Asia-Pacific
- South America
- Brazil
- Argentina
- Rest of South America
- Middle East and Africa
- United Arab Emirates
- Saudi Arabia
- South Africa
- Rest of Middle East and Africa
- North America
Data Sources, Market Sizing, and Validation
Desk Research
Desk work starts by fixing the market perimeter and gathering measurable signals that link to industrial battery demand and supply. We rely on public sources such as IEA energy storage statistics, US Energy Information Administration data series, World Bank and OECD macro indicators, USITC and UN Comtrade trade codes, and relevant IEC/IEEE standards notes that clarify use cases and performance requirements.
On top of that, we review company annual reports, investor presentations, earnings transcripts, and credible industry press to track capacity additions, plant utilization commentary, and price movements by chemistry. A paid subscription for company financials and intelligence is also used to normalize revenue splits when segment disclosures are inconsistent. The desk source list is illustrative only, and many other public references were used for data collection, validation, and clarification.
Primary Interviews and Surveys
Primary work is used to pressure test the desk assumptions and convert broad demand signals into practical adoption and pricing ranges. We speak with battery makers, integrators, distributors, and large industrial end users across APAC, EMEA, and the Americas so that chemistry shifts, replacement cycles, and procurement behavior can be checked against real buying patterns.
Distribution of primary research fieldwork respondents
| Company type | Respondent position | Region |
|---|---|---|
| Top tier: 36% | CXOs: 13% | APAC: 49% |
| Mid tier: 47% | Functional/Unit leaders: 28% | EMEA: 32% |
| Smaller Players: 17% | Managers: 59% | Americas: 19% |
Market-Sizing & Forecasting
Sizing is built using a top-down demand pool reconstruction, where industrial activity and installed base indicators are translated into battery demand by application, and then converted to value using realistic ASP bands by chemistry. Where the model needs to be grounded further, selective bottom-up approximations are used, such as supplier revenue splits, sampled ASP multiplied by estimated unit volumes, and channel checks on replacement sales.
Key inputs that shape the totals include forklift and motive power fleet activity, telecom tower backup power needs, UPS and data center build outs, grid-scale ESS commissioning pace, and chemistry mix shifts between lead-acid, lithium-ion, and nickel-based options. Pricing is not treated as a single flat number because contract timing, raw material pass-through, and warranty terms can move ASPs over the year. Forecasts are produced using scenario analysis that is anchored to expert consensus on capacity additions, industrial capex, and storage project pipelines, and then stress tested for downside cases where industrial output and energy storage awards slow.
When bottom-up information is missing for smaller countries or niche applications, gaps are filled through proxy ratios tied to industrial output, electrification intensity, and import dependence, and then adjusted after interview feedback confirms whether the proxy is directionally right.
Data Validation & Update Cycle
Model outputs are checked against independent signals like trade flows, announced capacity, and end-market installation trends so that totals do not drift away from what can be observed. If a region shows an unusual jump, the drivers are traced back to the exact assumption, and respondents are re-contacted when the variance looks structural rather than timing-related.
Before sign-off, the numbers go through step-by-step analyst reviews to confirm that units, currency conversions, and price assumptions are consistent across applications and regions. The report is refreshed annually, and interim updates are done when material events occur, such as major plant outages, policy changes affecting ESS demand, or sharp commodity-driven ASP swings. Right before delivery, a fresh pass is completed so clients receive the most current view available.
Mordor Intelligence's Industrial Battery Market Size Compared Against Other Published Estimates
Published numbers for industrial batteries often do not line up because firms pull the market perimeter in different directions and then apply different pricing and timing assumptions. Differences also show up when one estimate is chemistry-limited, when another blends industrial and automotive demand, or when exchange rates and inflation treatment are not handled the same way.
The main gap comes from whether grid-scale ESS and UPS/data center batteries are counted as industrial batteries on a like-for-like basis, where Mordor Intelligence includes these applications only when the battery is procured for industrial backup or stationary storage use cases and priced using application-level ASP ranges rather than a blended average.
Benchmark comparison
| Source | Market Size | Gaps in Research Methodology |
|---|---|---|
| Mordor Intelligence | USD 41.93 B (2026) | |
| Global Consultancy A | USD 22.44 B (2024) | Uses an earlier base year and a narrower chemistry and application view in the headline figure, and the growth path can be dampened when ASP progression is treated as a single blended curve across use cases. |
| Industry Publisher B | USD 23.97 B (2025) | Uses a different base year and forecast window, and the application mapping can shift totals depending on whether ESS and UPS deployments are counted fully as industrial or partially allocated to adjacent battery markets. |
Taken together, the spread is mostly explained by base-year choice, application inclusion rules, and how pricing is carried forward by chemistry and use case. By keeping assumptions tied to visible demand signals and rechecking them with field inputs, the resulting number stays transparent and repeatable for planning discussions.


Key Questions Answered in the Report
What is the growth outlook for the industrial battery market through 2031?
The industrial battery market is projected to grow from USD 41.93 billion in 2026 to USD 93.71 billion by 2031, registering a 17.45% CAGR.
Which technology leads current sales?
Lithium-ion technology held 51.26% revenue in 2025 and is forecast to expand at 18.56% through 2031.
Why are forklifts switching to lithium-ion?
Opportunity charging halves downtime and removes the need for dedicated battery-swap rooms, delivering quick payback for 24/7 warehouses.
How significant is Asia-Pacific in demand?
Asia-Pacific generated 49.92% of 2025 revenue and is expected to grow at 19.53% through 2031, led by China and India.
What challenges could slow adoption?
Critical-mineral price swings and higher fire-risk insurance premiums can raise capex and delay commissioning.
Which companies dominate supply?
CATL, BYD, LG Energy Solution, Panasonic Energy, and Samsung SDI account for about 70% of global industrial battery capacity.
Page last updated on:


 Your data is secure and never sold or shared.


