
Market Overview
| Study Period | 2021 - 2031 |
|---|---|
| Market Size (2026) | USD 60.13 Billion |
| Market Size (2031) | USD 75.72 Billion |
| Growth Rate (2026 - 2031) | 4.72 % |
| Fastest Growing Market | Asia Pacific |
| Largest Market | North America |
| Market Concentration | Medium |
Major Players *Disclaimer: Major Players sorted in no particular order Image © Mordor Intelligence. Reuse requires attribution under CC BY 4.0. | |
Industrial And Institutional Cleaning Chemicals Market Analysis by Mordor Intelligence
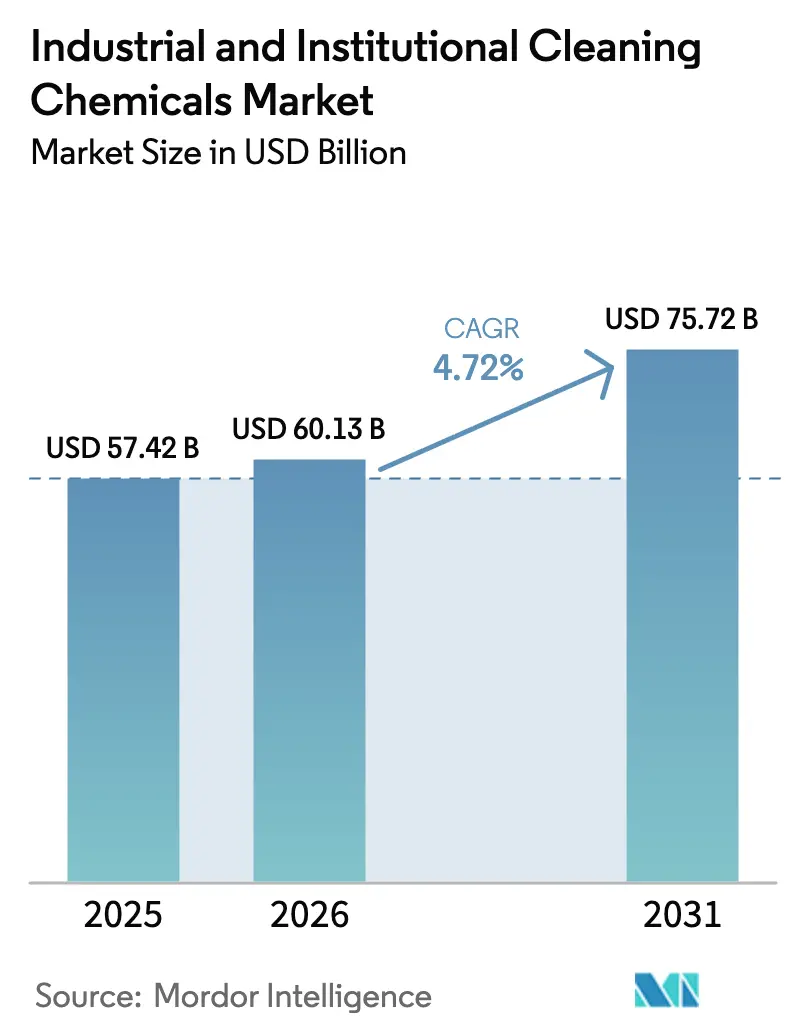
The Industrial And Institutional Cleaning Chemicals Market size was valued at USD 57.42 billion in 2025 and is estimated to grow from USD 60.13 billion in 2026 to reach USD 75.72 billion by 2031, at a CAGR of 4.72% during the forecast period (2026-2031). Tighter infection-control rules in hospitals and nursing homes, automated dosing in quick-service restaurants, and ultra-pure blends demanded by advanced semiconductor nodes are propelling volume growth. Surfactants still dominate raw-material spend, but precision-cleaning solvents are gaining share as electronics assembly and metal-fabrication customers shift toward low-residue formulations. Bio-based surfactants certified under RSPO Mass Balance protocols are scaling rapidly as European Union Ecolabel and California Safer Consumer Products criteria reshape sourcing decisions. Digital dispensers that record dilution ratios and feed alerts into safety-management systems are cutting chemical waste by up to 20% while easing OSHA Hazard Communication audits. At the same time, PFAS and VOC limits in the United States and the European Union are accelerating reformulation, nudging formulators toward fluorine-free surfactants and aqueous alkaline blends.
Key Report Takeaways
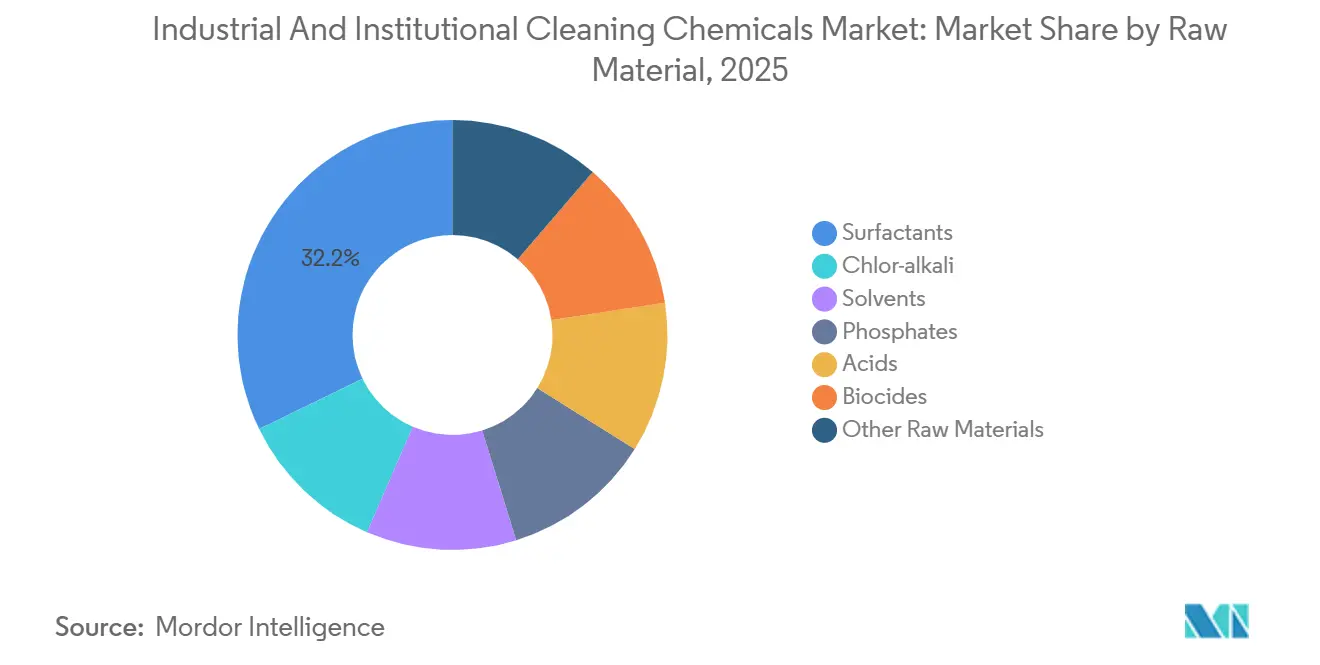
- By raw material, surfactants led with 32.18% of the industrial and institutional cleaning chemicals market share in 2025; solvents are set to expand at a 6.41% CAGR through 2031.
- By product type, general-purpose cleaners commanded 35.65% of the industrial and institutional cleaning chemicals market size in 2025, while disinfectants and sanitizers are growing at a 6.76% CAGR to 2031.
- By ingredient origin, conventional / petrochemical-based products accounted for 70.34% share of the industrial and institutional cleaning chemicals market size in 2025; bio-based / green are forecast to rise at 7.33% CAGR over 2026-2031.
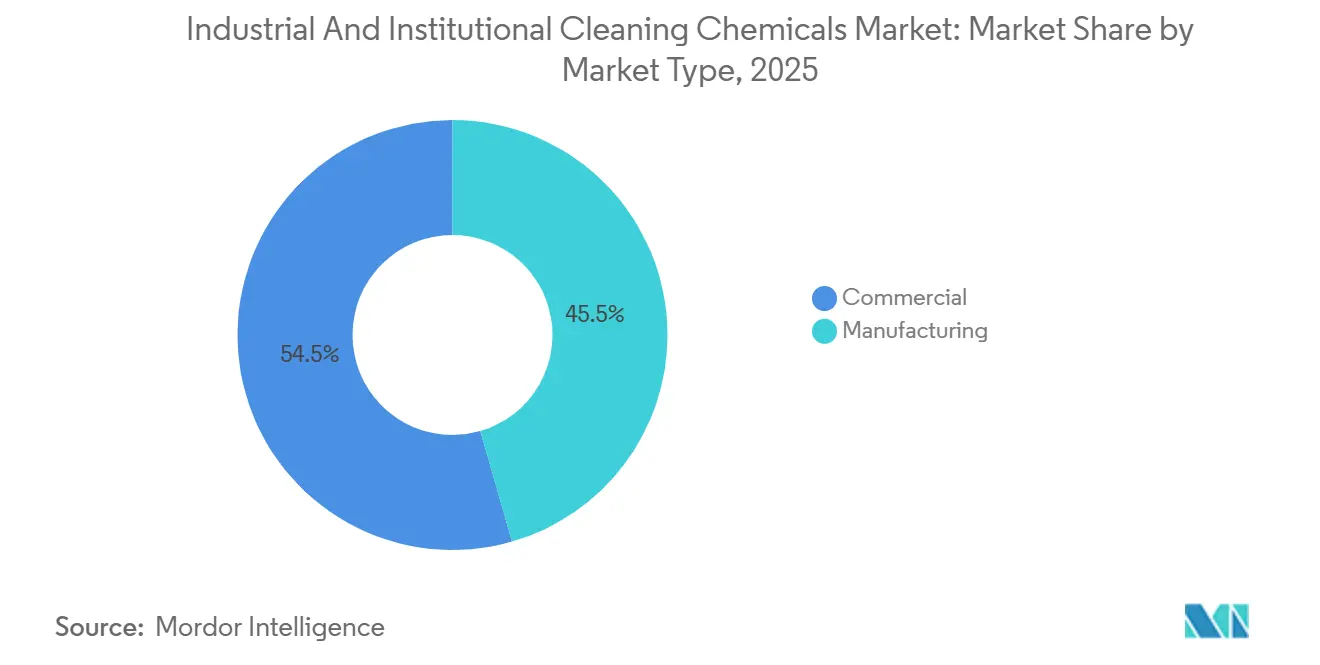
- By market type, the commercial sector held 54.46% revenue share in 2025 and is advancing at a 5.56% CAGR through 2031.
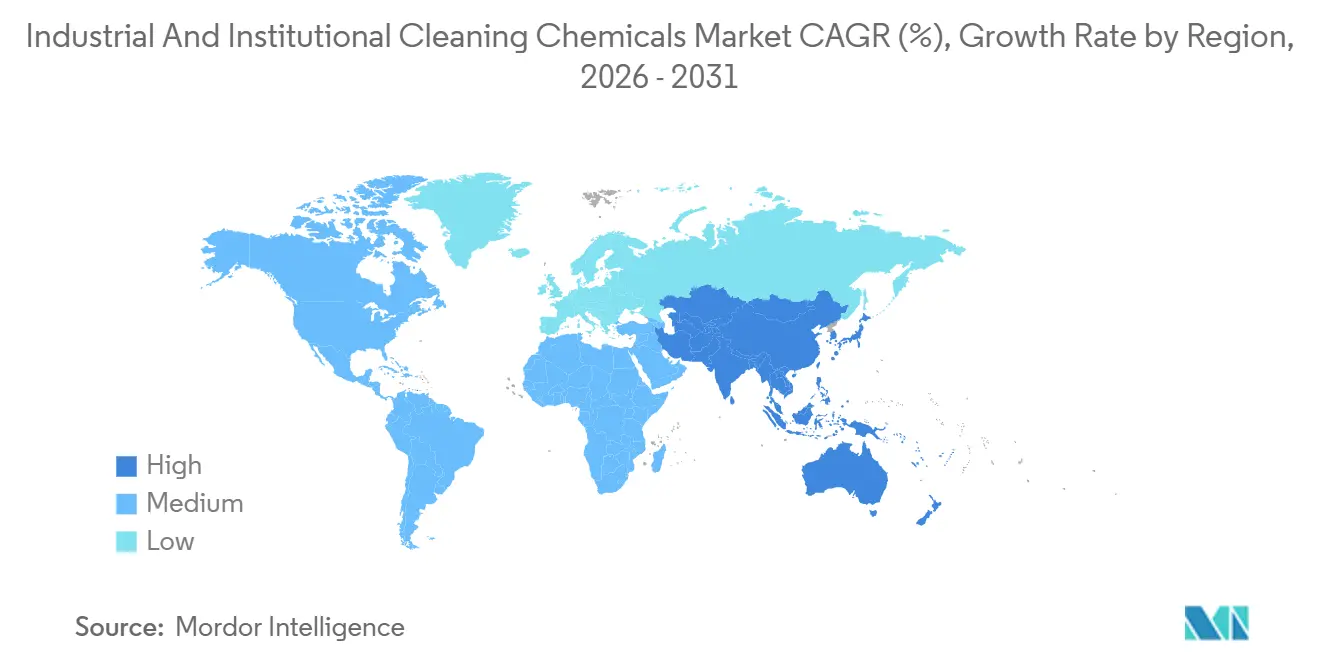
- By geography, North America maintained a 34.49% share in 2025, whereas the Asia-Pacific is projected to grow at a 6.98% CAGR over the forecast horizon.
Note: Market size and forecast figures in this report are generated using Mordor Intelligence’s proprietary estimation framework, updated with the latest available data and insights as of January 2026.
Market Trends and Insights
Drivers Impact Analysis of Industrial And Institutional Cleaning Chemicals Market*
| Driver | (~) % Impact on CAGR Forecast | Geographic Relevance | Impact Timeline |
|---|---|---|---|
| Infection-Control Protocols in Acute and Long-Term Care Facilities | +0.8% | Global, led by North America and Europe | Medium term (2-4 years) |
| Sanitizer Adoption in Asian Meat and Seafood Processing | +0.6% | APAC core—China, Thailand, Vietnam, Indonesia | Medium term (2-4 years) |
| Quick-Service Restaurant Boom Requiring Automated Ware-wash Dosing | +0.7% | Global, with North America and APAC hotspots | Short term (≤ 2 years) |
| Global Tourism and Hospitality Recovery | +0.5% | Europe, North America, APAC tourism hubs | Short term (≤ 2 years) |
| Semiconductor Clean-room Expansion Driving Ultra-Low-Residue Blends | +0.9% | APAC (China, South Korea, Taiwan), North America (Arizona, Texas) | Long term (≥ 4 years) |
| Source: Mordor Intelligence | |||
Infection-Control Protocols in Acute and Long-Term Care Facilities
Hospital environmental-services teams are replacing quaternary-ammonium disinfectants with hydrogen-peroxide and peracetic-acid blends that satisfy EPA List N emerging-pathogen criteria without triggering asthma liabilities[1]. The Centers for Disease Control and Prevention updated its environmental infection-control guidelines in 2024, recommending sporicidal agents for high-touch surfaces, a change that lifts per-gallon chemical spend by up to 40% but cuts hospital-acquired infection penalties under Medicare’s Hospital-Acquired Condition Reduction Program. Long-term care operators face parallel mandates from state regulators that require logged contact times, driving uptake of ready-to-use sprayers with built-in timers. The World Health Organization’s 2024 IPC guidance links rigorous surface disinfection to antimicrobial resistance mitigation, reinforcing the shift toward premium chemistries. Demand for low-irritation actives also benefits acute-care renovations that incorporate automated UV-C robots and electrostatic sprayers.
Sanitizer Adoption in Asian Meat and Seafood Processing
Processors in China, Thailand, Vietnam, and Indonesia are investing in Clean-in-Place systems that pair foaming alkaline detergents with peracetic-acid rinses to clear export inspections for HACCP certification[2]. China’s State Administration for Market Regulation began enforcing ATP bioluminescence verification in 2024, pushing operators to document chemical concentration for every shift. Trials by Meat & Livestock Australia showed that peracetic-acid carcass rinses combined with chlorine-dioxide flume treatments lowered Salmonella and E. coli prevalence by 1.5–2.0 log CFU/cm², justifying a 25% cost premium. Rising scrutiny from US FDA import alerts and EU Rapid Alert System notices further pressures Southeast Asian exporters to adopt validated quaternary-ammonium foamers and iodophor dips.
Quick-Service Restaurant Boom Requiring Automated Ware-wash Dosing
IoT-enabled ware-wash dispensers that auto-adjust detergent and rinse-aid flow based on water hardness and soil load are lowering chemical waste by up to 20% while ensuring NSF/ANSI 3 compliance. Ecolab’s DishIQ platform, launched in 2024, alerts managers when rinse temperatures dip below the 180°F sanitization threshold, reducing health department violations. Turnover in the U.S. quick-service sector averaged 150% in 2025, so color-coded, pre-portioned systems that cut training time to under eight hours have become essential. Robotics is also entering back-of-house cleaning: autonomous scrubbers fitted with on-board detergent tanks and UV-C modules are trimming labor hours by 35% and lowering slip-and-fall claims.
Global Tourism and Hospitality Recovery
Hotel occupancy in North America and Europe rebounded to 95% of 2019 levels by mid-2025, prompting housekeeping units to deploy electrostatic sprayers that sanitize rooms in under 10 minutes. The American Hotel & Lodging Association’s 2024 Safe Stay update requires EPA-registered disinfectants with 10-minute contact times and digital checklists for proof-of-service. Chemical spend per room has risen by USD 2–3 per night, but guest cleanliness complaints have fallen by roughly 45%. In the Asia-Pacific region, international arrivals surpassed pre-pandemic counts in 2025, and eco-labeled wipes compliant with Green Key and EarthCheck standards are now standard amenities. Medical-tourism clusters in Thailand are adopting pharmaceutical-grade cleaning regimes, supporting premium sporicidal demand.
Restraints Impact Analysis of Industrial And Institutional Cleaning Chemicals Market*
| Restraint | (~) % Impact on CAGR Forecast | Geographic Relevance | Impact Timeline |
|---|---|---|---|
| Fluctuating Petrochemical Feedstock Prices | -0.6% | North America and Middle East petrochemical hubs | Short term (≤ 2 years) |
| Ethylene-Oxide Volatility Elevating Surfactant Costs | -0.5% | Global regions dependent on ethoxylated surfactants | Medium term (2-4 years) |
| Stringent PFAS and VOC Regulations | -0.7% | North America and Europe, led by California and the European Union | Long term (≥ 4 years) |
| Source: Mordor Intelligence | |||
Fluctuating Petrochemical Feedstock Prices
Ethylene-oxide spot values swung between USD 900 and USD 1,400/t in 2024-2025 after outages at Gulf Coast crackers, directly impacting ethoxylated alcohol costs. Propylene contracts traced similar volatility, pushing linear alkylbenzene sulfonate prices up or down by 30% each quarter. Small and mid-sized formulators without sophisticated hedging lost as much as five margin points during peak swings, whereas multinationals leveraged inventory buffers. European caustic-soda supply tightened when energy-intensive chlor-alkali units curtailed output, lifting prices by nearly 20% year-over-year.
Ethylene-Oxide Volatility Elevating Surfactant Costs
Extended maintenance at major US ethylene-oxide facilities restricted nonionic surfactant availability, elongating lead times to six weeks for contract customers. Latin American buyers paid premiums as spot cargoes diverted to North America. Contract clauses that peg quarterly price adjustments to ethylene-oxide indices are becoming standard, transferring some risk to end-users but amplifying budgeting complexity for institutional purchasers.
*Our forecasts treat driver/restraint impacts as directional, not additive. The impact forecasts reflect baseline growth, mix effects, and variable interactions.
Industrial And Institutional Cleaning Chemicals Market Segment Analysis
By Raw Material:
Solvents Surge on Precision-Cleaning DemandSurfactants, while holding a 32.18% 2025 industrial and institutional cleaning chemicals market share, will cede incremental ground to these fast-evaporating systems. Chlor-alkali derivatives remain staples for alkaline Clean-in-Place cycles in dairy, brewery, and beverage plants. Solvents are poised to grow at a 6.41% CAGR through 2031, lifted by electronics and metal-fabrication users that require ether- and alcohol-based blends leaving <10 µg/cm² residue.
Phosphate use is now largely restricted to heavy-duty degreasing in aerospace and automotive segments after bans in the European Union and multiple U.S. states. Meanwhile, citric acid is displacing mineral acids in descaling because it is stainless-steel-friendly and biodegradable. Biocides such as isothiazolinones make up only 0.5% of finished formulations, yet they are indispensable for microbial control in bulk concentrate storage, an attribute closely regulated under the EU Biocidal Products Regulation.

By Product Type:
Disinfectants Accelerate Amid Infection-Control MandatesGeneral-purpose cleaners retained a 35.65% slice of the industrial and institutional cleaning chemicals market size in 2025. Hydrogen-peroxide and peracetic-acid blends achieve 1-5 minute kill times versus the 10 minutes needed for legacy quats, making them the disinfectant of choice for hospitals seeking to speed room turnover. General-purpose formulations compete on fragrance, color, and eco-label score, with Green Seal GS-37 certification now a default tender requirement for many US school districts. Disinfectants and sanitizers are expanding at a 6.76% CAGR by 2031.
Laundry-care powders and liquids face pressure from on-premise dosing systems that shave 15% off chemical cost per kilogram of linen. Vehicle-wash pre-soaks are pivoting toward touchless chemistries containing chelants and high-foaming amphoterics so tunnel operators can satisfy insurance underwriters that now demand quarterly slip-risk audits.
By Ingredient Origin:
Bio-based Formulations Capture Sustainability PremiumsConventional feedstocks held a 70.34% share in 2025, but bio-based blends sourced from coconut, palm kernel, and corn glucose are advancing 7.33% annually, the fastest within the industrial and institutional cleaning chemicals market. Alkyl-polyglucoside surfactants degrade >60% within 28 days under OECD 301, aligning with EU Ecolabel Wash-Off limits. Croda’s RSPO-certified fatty-alcohol ethoxylates let contract cleaners add “mass-balance” claims without segregated logistics.
Price sensitivity remains a barrier in vehicle-wash and industrial degreasing, where end-users resist premiums beyond 10%, yet corporate Scope 3 targets are tipping more hotel and foodservice chains toward greener sourcing. BASF’s bio-chelants, introduced in 2025, help laundry-formulators meet phosphate bans while matching sequestration performance at similar treat rates.
By Market Type:
Commercial Segments Outpace Manufacturing on Labor DynamicsCommercial establishments generated 54.46% of 2025 revenue and are forecast to log a 5.56% CAGR, outstripping manufacturing lines. Quick-service restaurants value automated ware-wash dosing that halves training hours for staff with 150% annual turnover. Hospitals and nursing homes prioritize EPA-registered sporicidal disinfectants and electrostatic sprayers to meet Medicare penalties tied to infection rates. Retailers and malls are adopting fragrance-free floor finishes to address chemical sensitivity litigation.
Manufacturing plants still rely on high-alkali or solvent formulations but are implementing recycling loops that recover 70-80% of spent solvent, compressing fresh-chemical demand. Semiconductor assemblers insist on particle-count certificates for each drum, elevating quality-assurance costs. Textile mills and pulp-and-paper operations upgrade enzymatic sizing removal systems, which cut caustic use by 25%, thereby redefining consumption patterns.
Geography Analysis
North America Industrial and Institutional Cleaning Chemicals Market
North America commanded 34.49% of the industrial and institutional cleaning chemicals market in 2025, thanks to entrenched distribution networks, stringent EPA and FDA standards, and high per-capita chemical use in healthcare and hospitality. Quick-service operators in the United States, facing 150% labor churn, rely on pre-measured sachets to maintain hygiene when onboarding windows shrink. Canada’s food-processing clusters and Mexico’s automotive corridors add steady solvent and degreaser demand.
APAC Industrial and Institutional Cleaning Chemicals Market
Asia-Pacific is the fastest-growing region at a 6.98% CAGR through 2031, propelled by China’s semiconductor wet-cleaning boom and India’s foodservice sector. Tier-2 Indian cities are rolling out automated ware-wash systems, while Southeast Asian shrimp and poultry processors invest in validated sanitation protocols to avoid US FDA import alerts. Thailand’s manufacturing sector, contributing 44% of 2024 GDP, sustains alkaline and solvent uptake in electronics and automotive facilities.
EMEA and South America Industrial and Institutional Cleaning Chemicals Market
Europe posts moderate growth, constrained by mature consumption but lifted by sustainability premiums under EU Ecolabel and REACH. South America endures currency headwinds, yet agricultural exports keep sanitation volumes healthy in Brazil and Argentina. The Middle East and Africa show nascent uptake; water-scarce GCC nations favor low-rinse concentrates, while Egypt and South Africa deploy chlor-alkali cleaners in food-processing and hospitality builds linked to tourism diversification drives.
Regulatory Landscape
Industrial and institutional (I&I) cleaning chemicals sit at the intersection of detergent and surfactant rules, biocide approvals, and air-emissions limits on solvents, which creates region-specific compliance paths for labels, safety data sheets, and permitted actives. In the European Union, Regulation (EU) 2026/405 on detergents and surfactants was adopted in February 2026. It replaced the long-standing Detergents Regulation (EC) No 648/2004 and introduced a 42-month transition period that requires manufacturers and importers to refresh documentation, labeling, and market-surveillance readiness.
Disinfectants and sanitizers also face biocidal-product requirements that shape permissible active substances and product-family registrations. In February 2026, ECHA's Biocidal Products Committee adopted opinions supporting approval of ethanol for biocidal product types relevant to I&I use (PT1, PT2, and PT4). The European Commission granted Union Authorization for the ECA Disinfect Product Family 5, effective 13 July 2026, streamlining multi-country access under the EU Biocidal Products Regulation. In the United States, antimicrobial disinfectants are regulated under EPA's FIFRA framework, and EPA's antimicrobial pesticide registration guidance updates in January 2026 reinforced the need for disciplined change control around formulation, claims, and registration maintenance for professional-use products.
Value Chain Analysis
The value chain runs from upstream commodity and specialty inputs (chlor-alkali derivatives, surfactants, solvents, acids, chelants, and biocides) through formulation, packaging, and labeling into distribution via national and regional chemical distributors, jan-san networks, and direct-to-key-account supply for healthcare, foodservice, hospitality, and manufacturing plants. Feedstock volatility, notably ethylene oxide-linked nonionic surfactants and petrochemical solvents, and specialized QA requirements for precision-cleaning and cleanroom grades raise the importance of multi-sourcing, indexed contracts, and verified certificates of analysis across global supply lines.
Downstream, performance verification and compliance documentation increasingly travel with the product, not just the drum. EU Regulation (EU) 2026/405 reinforces clearer labeling and market surveillance for I&I detergents used by specialized personnel, which increases the burden for data management across suppliers and private-label formulators. On the service and solutions layer, vendors differentiate through dosing hardware, IoT dispensers, and resource-optimization programs that link chemical delivery to auditability, water use, and waste reduction. This aligns with institutional procurement that favors measurable outcomes rather than unit price alone.
Competitive Landscape
The Industrial and Institutional Cleaning Chemicals market remains moderately fragmented. Ecolab’s January 2024 purchase of Purolite’s ion-exchange resins integrated water-treatment know-how with cleaning portfolios, enabling bundled RO pretreatment and wastewater recycling for beverage bottlers. BASF and Croda expanded bio-surfactant capacity, targeting customers seeking RSPO-certified mass-balance supply. Technology adoption is reshaping service models: IoT dispensers feed dilution data into ERP systems, triggering automated re-orders and ensuring OSHA Hazard Communication compliance.
Industrial And Institutional Cleaning Chemicals Industry Leaders
-
3M
-
BASF
-
Ecolab
-
Henkel AG & Co. KGaA
-
Reckitt
- *Disclaimer: Major Players sorted in no particular order

Industrial And Institutional Cleaning Chemicals Market Companies Covered in this Report
- 3M
- Akzo Nobel N.V.
- Albemarle Corporation
- BASF
- Betco
- Clariant
- Croda International Plc
- Ecolab
- Henkel AG & Co. KGaA
- Huntsman International LLC
- Kersia Group
- Lanxess
- National Chemical Laboratories Inc.
- Nouryon
- Procter & Gamble
- Reckitt
- Solenis
- Solvay
- Spartan Chemical Company Inc.
- Stepan Company
- Virox
- Westlake Corporation
- WM Barr
Read Analysis of Industrial And Institutional Cleaning Chemicals Companies
Market Opportunities and Future Outlook
Reformulation and substitution whitespace is widening where regulatory limits constrain traditional solvent and surfactant choices. In the United States, VOC content limits for industrial cleaning solvents under EPA frameworks and the NESHAP standards for halogenated solvent cleaning operations are pressuring a move toward low-VOC or aqueous systems. This creates room for precision-cleaning blends that meet residue requirements without relying on regulated halogenated chemistries. At the same time, tighter PFAS and VOC limits described in the report context are accelerating demand for fluorine-free surfactants and alternative solvent systems. That shift is pulling innovation toward low-residue aqueous alkaline cleaners, peroxide and peracetic-acid disinfectants, and compliant solvent packages.
Capacity localization and supply assurance for surfactants and detergent intermediates are actionable opportunities in fast-growing end-markets. In March 2026, Unitop Chemicals (Rossari Biotech subsidiary) commissioned an ethoxylation expansion in Dahej, Gujarat, taking total capacity to 66,000 MTPA. In Q1 2026, Hayat Kimya commissioned a USD 50 million detergent facility in Mersin, Turkey (230,000 tons/year), signaling active investment around I&I-adjacent supply chains. For buyers, digitally enabled dosing and monitoring platforms, already adopted in foodservice and spreading into healthcare and manufacturing, create a pull-through for suppliers that bundle chemicals with connected dispensers and compliance-ready reporting. This is especially relevant for accounts that need logged dilution ratios and documented contact times.
Recent Industry Developments in Industrial And Institutional Cleaning Chemicals Market
- March 2026: Ecolab announced a definitive agreement to acquire CoolIT Systems for about USD 4.75 billion, expanding capabilities in advanced liquid cooling for AI data centers. The move strengthens Ecolab's technology footprint in water and thermal management, adjacent to I&I programs where on-site system performance, monitoring, and service integration drive differentiated outcomes.
- September 2025: Ecolab launched Ecolab CIP IQ and announced a strategic partnership with 4t2 Sensors to enhance clean-in-place monitoring for food and beverage operations. The combination of digital sensing and analytics tightens verification of cleaning cycles and supports procurement shifts toward measurable hygiene performance and resource efficiency.
- January 2024: Ecolab completed the purchase of Purolite's ion-exchange resins business, adding water-treatment know-how that can be bundled with cleaning and sanitation programs for industrial users. The integration supports wastewater recycling and pretreatment offerings that sit alongside chemical supply, increasing stickiness in large institutional and manufacturing accounts.
Industrial And Institutional Cleaning Chemicals Market Report Scope and Research Methodology
Market Definition and Coverage
For this study, the market covers formulated cleaning chemicals used in non-residential settings to clean, degrease, wash, and disinfect surfaces, equipment, and textiles across industrial sites and institutions. It is measured as the sales value of these products across the covered geographies.
Scope exclusions: Household consumer cleaning products and outsourced janitorial service revenues are not counted in the market value.
Segments Covered in This Report
- By Raw Material
- Chlor-alkali
- Caustic Soda
- Soda Ash
- Chlorine
- Surfactants
- Non-ionic
- Anionic
- Cationic
- Amphoteric
- Solvents
- Alcohols
- Hydrocarbons
- Chlorinated
- Ethers
- Phosphates
- Acids
- Biocides
- Other Raw Materials (Chelants, Rheology Modifiers, Opacifiers, Dispersants, Ketones, Esters)
- Chlor-alkali
- By Product Type
- General-Purpose Cleaners
- Disinfectants and Sanitizers
- Laundry Care Products
- Vehicle Wash Products
- By Ingredient Origin
- Bio-based / Green
- Conventional / Petrochemical
- By Market Type
- Commercial
- Foodservice
- Retail
- Laundry and Dry-Cleaning
- Healthcare
- Car Washes
- Offices, Hotels and Lodging
- Manufacturing
- Food and Beverage Processing
- Fabricated Metal Products
- Electronic Components
- Other Manufacturing (Textile, Pulp and Paper, Petrochemical)
- Commercial
- By Geography
- Asia-Pacific
- China
- India
- Japan
- South Korea
- Malaysia
- Thailand
- Indonesia
- Vietnam
- Rest of Asia-Pacific
- North America
- United States
- Canada
- Mexico
- Europe
- Germany
- United Kingdom
- France
- Italy
- Spain
- Nordics
- Turkey
- Russia
- Rest of Europe
- South America
- Brazil
- Argentina
- Colombia
- Rest of South America
- Middle-East and Africa
- Saudi Arabia
- United Arab Emirates
- Qatar
- Egypt
- South Africa
- Nigeria
- Rest of Middle-East and Africa
- Asia-Pacific
Data Sources, Market Sizing, and Validation
Desk Research
Desk work started by building a clear demand map across institutional and industrial use-cases, and then tying it to product categories that are typically procured as chemicals (not services). Public sources were used to anchor the macro picture, such as US EPA Safer Choice and disinfectant-related listings, the European Chemicals Agency (ECHA), and the US Census Bureau and Eurostat for industrial output and services activity indicators that influence cleaning consumption.
We also reviewed materials and regulatory signals that can shift formulations and pricing, using sources such as OECD chemicals information, selected peer-reviewed hygiene and surface disinfection studies, and trade association publications that discuss cleaning and sanitation practices. Company annual reports, investor presentations, and reputable press were used to validate product mix shifts and regional demand patterns, and a paid subscription for company financials and news was referenced where a public split was not available. This list is illustrative, and many other public and secondary sources were referred to for data collection, validation, and clarification.
Primary Interviews and Surveys
Primary conversations were used to sanity-check the category scope, confirm typical buying units and pricing logic, and validate how demand behaves across commercial facilities and manufacturing sites. We spoke with a mix of formulators, raw material participants, distributors, large end-users, and facility-level decision makers across the main regions, and then used the feedback to refine assumptions that were weak in public data.
Distribution of primary research fieldwork respondents
| Company type | Respondent position | Region |
|---|---|---|
| Top tier: 28% | CXOs: 15% | APAC: 42% |
| Mid tier: 51% | Functional/Unit leaders: 30% | EMEA: 35% |
| Smaller Players: 21% | Managers: 55% | Americas: 23% |
Market-Sizing & Forecasting
Market sizing was built using a top-down approach where industrial output and institutional activity indicators are converted into a realistic consumption pool for I&I cleaning chemicals, and then filtered by product use intensity across key facility types. To keep the totals practical, results were corroborated with selective bottom-up checks, such as sampled price per kilogram or liter multiplied by estimated volumes for high-usage categories, followed by channel-level sense checks.
Inputs in the model included hospital and healthcare facility activity signals, foodservice and hospitality reopening and occupancy trends, manufacturing production indices, the share of disinfectants and sanitizers within I&I baskets, and raw material and formulation cost movements that influence average selling prices. Forecasts were run using scenario analysis, where the key drivers were stress-tested for hygiene compliance intensity, industrial cycle strength, and price normalization, and then aligned to what interviewees described as their expected procurement patterns. Where category splits were not reported consistently, gaps were handled by using proxy ratios from similar end-use cohorts and then re-validating the implied mix with primary feedback.
Data Validation & Update Cycle
Validation is done in layers so the final number does not depend on a single assumption. Analysts compare model outputs against independent signals, such as regional industrial activity, institutional demand indicators, and observed pricing movement, and then investigate any variance that looks out of line with what procurement teams and suppliers report.
Before sign-off, the dataset and calculations go through multi-step internal reviews, and re-contacts are triggered when a material gap appears in category scope, regional split, or price trend. Reports are refreshed annually, with interim updates when major regulatory shifts, demand shocks, or raw material disruptions are seen. Right before delivery, a fresh review pass is completed so clients receive the latest updated view.
Mordor Intelligence's Industrial and Institutional Cleaning Chemical Market Size Measured Against Other Published Estimates
Published market values for industrial and institutional cleaning chemicals can vary even when the topic label looks the same, because the underlying product scope and the year being sized are not always aligned. Differences also come from how firms treat disinfection-heavy demand years, how pricing is rolled forward, and how regional currency conversions are timed.
In practice, the spread is usually driven by whether household cleaners or service revenues are mixed into the definition, whether the model counts only formulated I&I products or also adds adjacent industrial process chemicals, and whether assumptions are validated with end-user procurement behavior. When pricing is projected using a single inflation factor, or when an older base year is carried forward without a fresh scope check, the market size can drift away from what facility-level consumption supports.
Benchmark comparison
| Source | Market Size | Gaps in Research Methodology |
|---|---|---|
| Mordor Intelligence | USD 60.13 B (2026) | |
| Industry Advisory A | USD 59.71 B (2024) | Uses a different base year and does not clearly state exclusions for household cleaners or service-linked spend, which can shift comparability when the category boundary is interpreted more broadly. |
| Research Publisher B | USD 32.97 B (2024) | Shows a much smaller total that likely reflects a narrower inclusion set or different revenue capture approach, and the period definitions and segment axes can make like-for-like reconciliation difficult. |
The table shows that the main gap is not only timing, but also what is counted as an I&I chemical sale versus an adjacent cleaning spend line, and that difference becomes visible when product definitions and pricing steps are checked with buyers and distributors, a scope discipline applied by Mordor Intelligence.
Key Questions Answered in the Report
How large will the industrial and institutional cleaning chemicals market be by 2031?
It is projected to reach USD 75.72 billion, expanding at a 4.72% CAGR during 2026-2031.
Which raw-material category is growing fastest?
Solvents are set to rise at a 6.41% CAGR as precision-cleaning needs in electronics and metal-fabrication escalate.
Why are disinfectants outpacing general-purpose cleaners?
Hospitals, foodservice, and hospitality operators now prioritize EPA-registered sporicidal efficacy, lifting disinfectants and sanitizers at a 6.76% CAGR.
What is driving Asia-Pacific demand?
China’s semiconductor fabs and India’s quick-service restaurant build-out are propelling regional growth at a 6.98% CAGR.
How are regulations influencing product reformulation?
The EPA’s 4 ppt PFAS limit and EU REACH VOC rules are accelerating a shift to fluorine-free surfactants and low-VOC solvents across multiple applications.