Energy & Power
30th JulyUnlocking Market Potential for Solid-State Transformers
3 Min Read
The Industrial Air Quality Control Systems Market Report is Segmented by Type (Flue Gas Desulfurization, Fabric/Ceramic Filters, Scrubbers, and Others), Pollutant Controlled (Particulate Matter, Volatile Organic Compounds, Sox, Nox, and Mercury and Air Toxics), End-User Industry (Power Generation, Cement, Iron and Steel, and More), and Geography (North America, Europe, Asia-Pacific, South America, and Middle East and Africa).
Market Overview
| Study Period | 2021 - 2031 |
|---|---|
| Market Size (2026) | USD 101.48 Billion |
| Market Size (2031) | USD 131.02 Billion |
| Growth Rate (2026 - 2031) | 5.24 % CAGR |
| Fastest Growing Market | Asia Pacific |
| Largest Market | Asia Pacific |
| Market Concentration | Medium |
Major Players *Disclaimer: Major Players sorted in no particular order. Image © Mordor Intelligence. Reuse requires attribution under CC BY 4.0. |
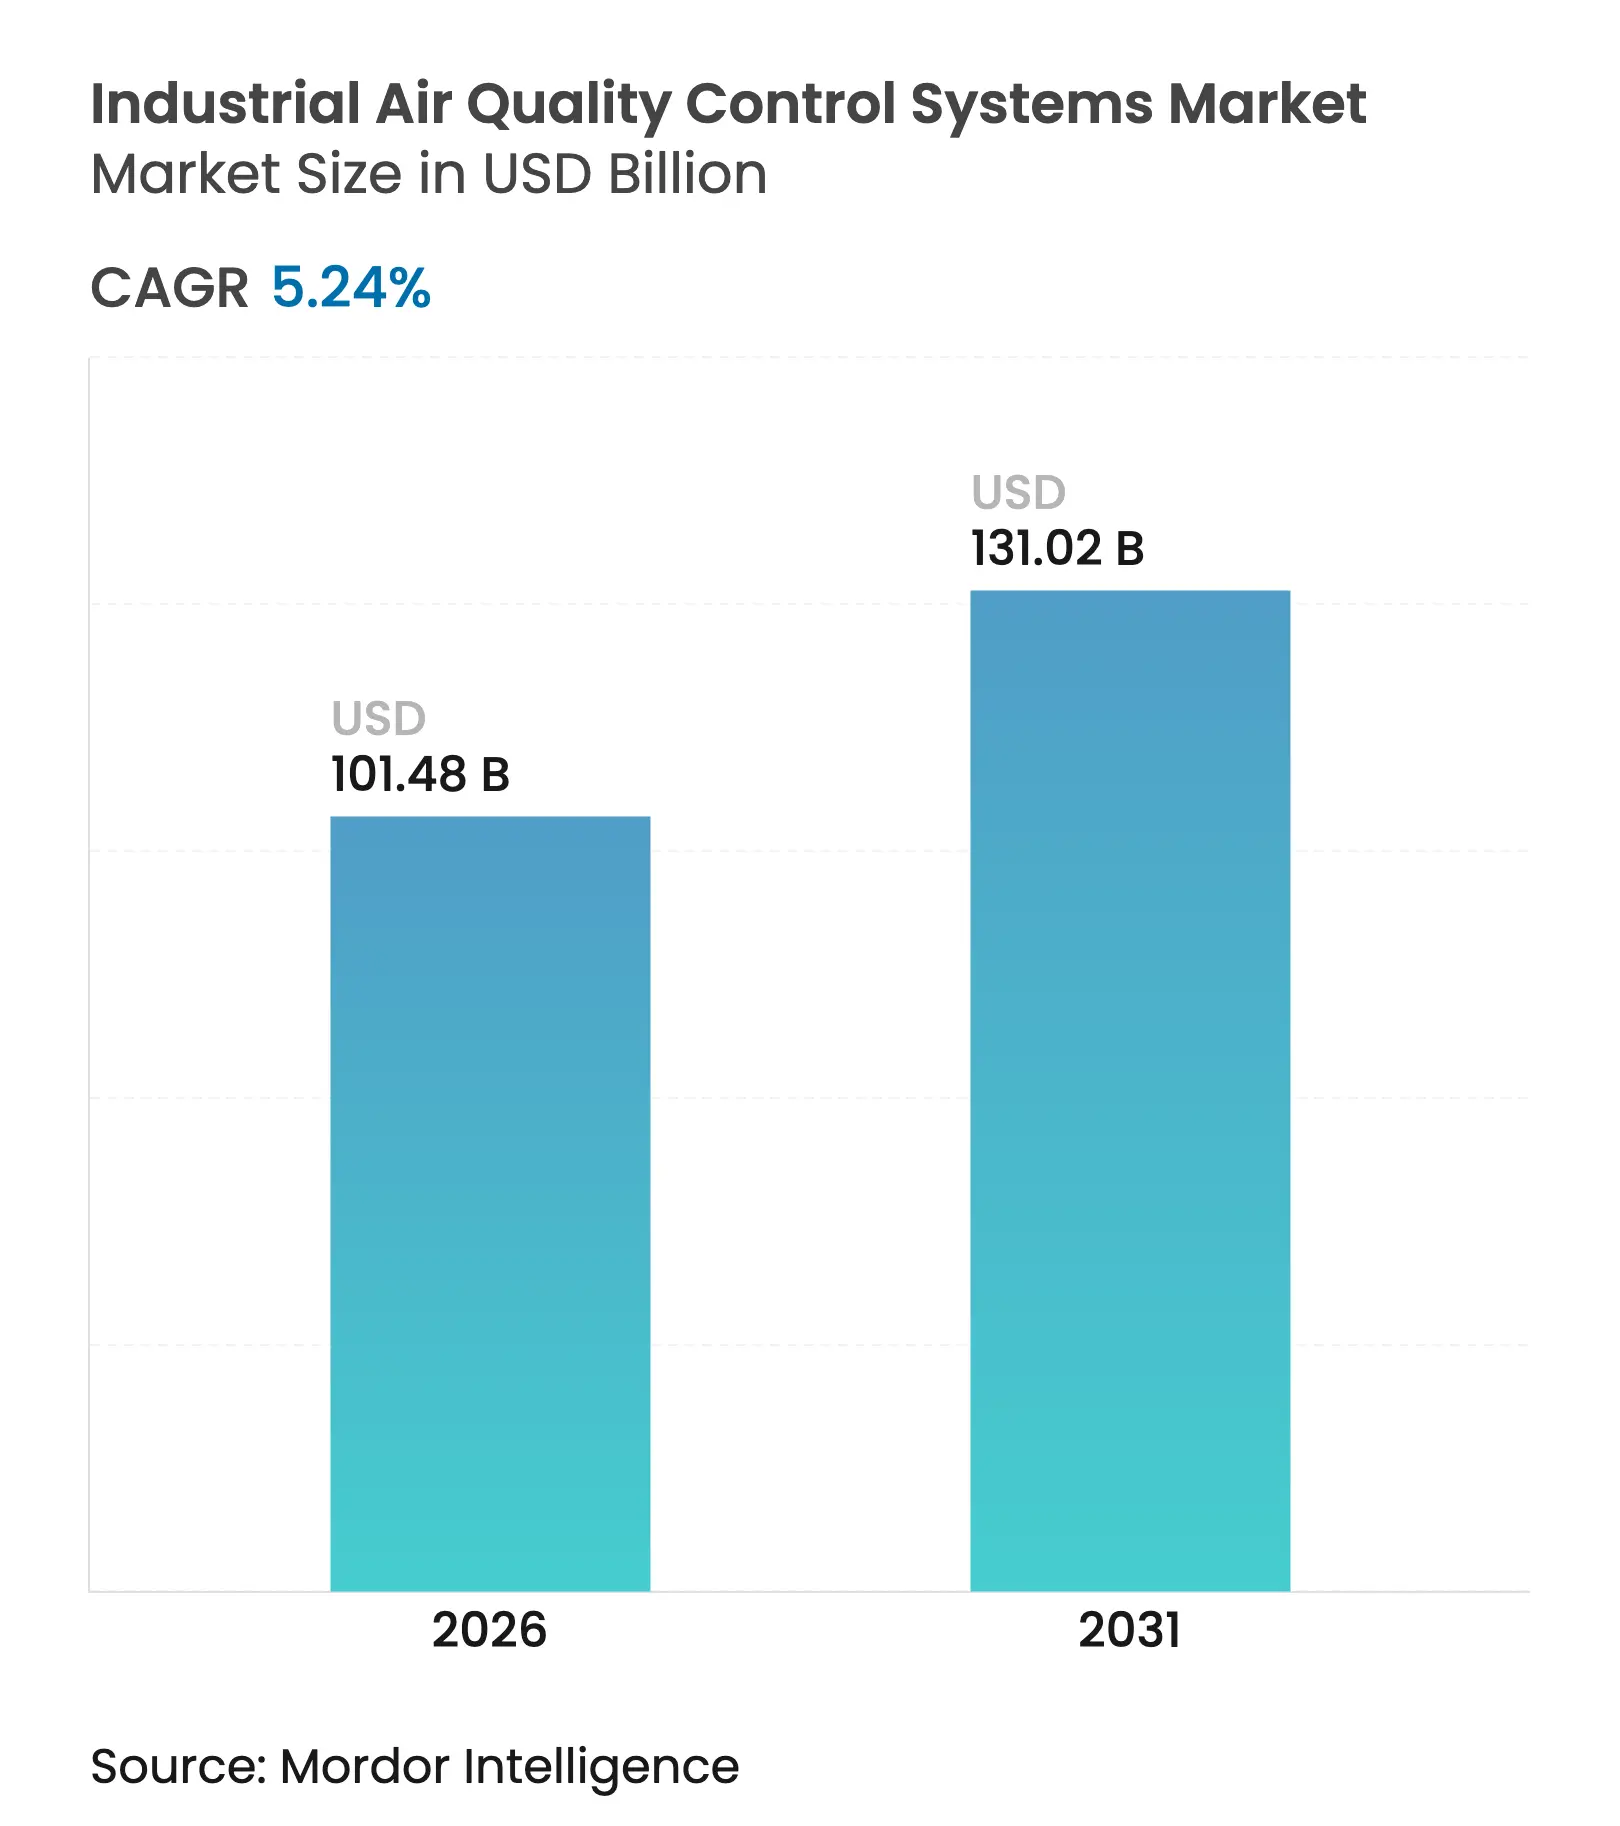

The mid-single-digit growth is based on tightening emission limits, rapid retrofit cycles in the Asia-Pacific region, and early integration of carbon-capture-ready designs. Technology suppliers are broadening portfolios to bundle multi-pollutant control with digital optimization, while plant operators weigh total cost of ownership against compliance risk. Cross-industry opportunities are widening as cement, waste-to-energy, and specialty chemicals facilities seek solutions once limited to coal-fired power plants. Competitive intensity is shaped by order-book strength, regional partnerships, and mergers and acquisitions that fill product gaps in fast-growing niches.
Key Report Takeaways
Note: Market size and forecast figures in this report are generated using Mordor Intelligence's proprietary estimation framework, updated with the latest available data and insights as of 2026.
Drivers Impact Analysis
| Driver | (~) % Impact on CAGR Forecast | Geographic Relevance | Impact Timeline |
|---|---|---|---|
Stricter emission norms & compliance deadlines | +1.8% | Global with Asia-Pacific, North America focus | Short term (≤ 2 years) |
Acceleration of coal-plant retrofit programs across Asia | +1.2% | Asia-Pacific core, spill-over to Europe & North America | Medium term (2-4 years) |
Rapid industrial build-out in developing economies | +0.9% | Asia-Pacific, Middle East & Africa, Latin America | Long term (≥ 4 years) |
Heightened focus on particulate-matter health impacts | +0.7% | Global urban-industrial corridors | Medium term (2-4 years) |
Carbon-capture-ready AQCS retrofits | +0.6% | North America & EU leading, Asia-Pacific following | Long term (≥ 4 years) |
AI-enabled O&M optimization unlocking replacement revenue | +0.4% | Technology-advanced markets | Medium term (2-4 years) |
| Source: Mordor Intelligence | |||
Stricter Emission Norms & Compliance Deadlines
Regulatory tightening is forcing operators to adopt multi-pollutant platforms rather than piecemeal modules. The April 2024 Mercury and Air Toxics Standards require 90% carbon control by 2032 for existing U.S. coal plants, driving integrated upgrades that bundle sulfur, nitrogen, mercury, and carbon removal(1). Regional rules mirror this urgency: Texas implemented new VOC limits for ozone zones in January 2025, spurring investments beyond the power sector(2). India will enforce zero liquid discharge by October 2025, propelling interest in systems that treat flue gas and wastewater simultaneously(3). Collectively, these mandates accelerate order placement, shorten payback expectations, and raise demand for systems that can be re-configured for carbon capture.
Acceleration of Coal-Plant Retrofit Programs Across Asia
China’s ultra-low-emission drive now covers more than 101 units, cutting total pollutants 90% from conventional baselines. India and Indonesia are adopting similar standards, while technology exporters in Europe and the United States supply sorbents, catalysts, and control software. Retrofits increasingly include space, ductwork, and heat-integration points for future CO₂ capture, creating a hybrid specification that differentiates premium bids. Financing from the Asian Development Bank for projects such as the Tianjin IGCC plant, which removes 99% of sulfur and 15-20% of NOx, signals multilateral support for the best-available technology(4).
Heightened Focus on Particulate-Matter Health Impacts
PM2.5 exposure studies indicate GDP losses of 1-4% in Asia; governments now treat air pollution as an economic issue, not merely an environmental one(5). The cement sector’s shift to bag-type dust collectors exemplifies health-driven purchasing criteria, as pulse-jet designs capture more than 99% of particles and comfortably meet ambient standards. Material science breakthroughs, such as corn-protein nano filters that trap 99.5% fine particles, broaden the arsenal available to designers. These advances feed into premium upgrade cycles even where legal limits remain unchanged.
Carbon-Capture-Ready AQCS Retrofits
Utilities and industrial boilers plan for 10- to 20-year asset lives. Adding absorber columns, duct realignment, and lower-temperature catalyst beds at the retrofit stage lowers the future cost of attaching amine or calcium looping units. U.S. plants installing mercury-control equipment spent at least USD 6.1 billion during 2015-2016, a cost now benchmarked for decision-makers evaluating capture-ready options(6). AI-enabled process optimization promises 15% waste reduction and 30% product quality gains, improving the business case for advanced retrofits.
Restraints Impact Analysis
| Restraint | (~) % Impact on CAGR Forecast | Geographic Relevance | Impact Timeline |
|---|---|---|---|
High capex & O&M costs | −1.4% | Global, acute in price-sensitive markets | Short term (≤ 2 years) |
Shift toward renewable energy curbing new installations | −0.8% | Europe & North America leading | Long term (≥ 4 years) |
Catalyst & filter-media supply-chain volatility | −0.6% | Global, tech-intensive segments | Medium term (2-4 years) |
Stricter wastewater norms raising wet-scrubber costs | −0.4% | Regions with integrated air-water rules | Medium term (2-4 years) |
| Source: Mordor Intelligence | |||
High Capex & O&M Costs
Ultra-low-emission systems demand specialized alloys, high-surface-area catalysts, and sophisticated controls. U.S. coal plants spent USD 6.1 billion in 15 months to meet mercury standards, with activated-carbon injection favored for quicker deployment. Smaller operators often postpone upgrades or opt for modular packages with staged implementation. Vendors counter cost barriers by offering build-own-operate models and digital twins that extend service revenues.
Shift Toward Renewable Energy Curbing New Installations
As utility-scale solar and wind displace coal in tender pipelines, greenfield prospects for large-volume flue-gas systems shrink. Yet this trend drives retrofit, biomass co-firing, and waste-to-energy conversions. Babcock & Wilcox’s Michigan coal-to-biomass project couples emissions control with CO₂ capture to produce net-negative power, signalling how legacy fleets remain addressable.
By Type: FGD Dominance Amid Filter Innovation
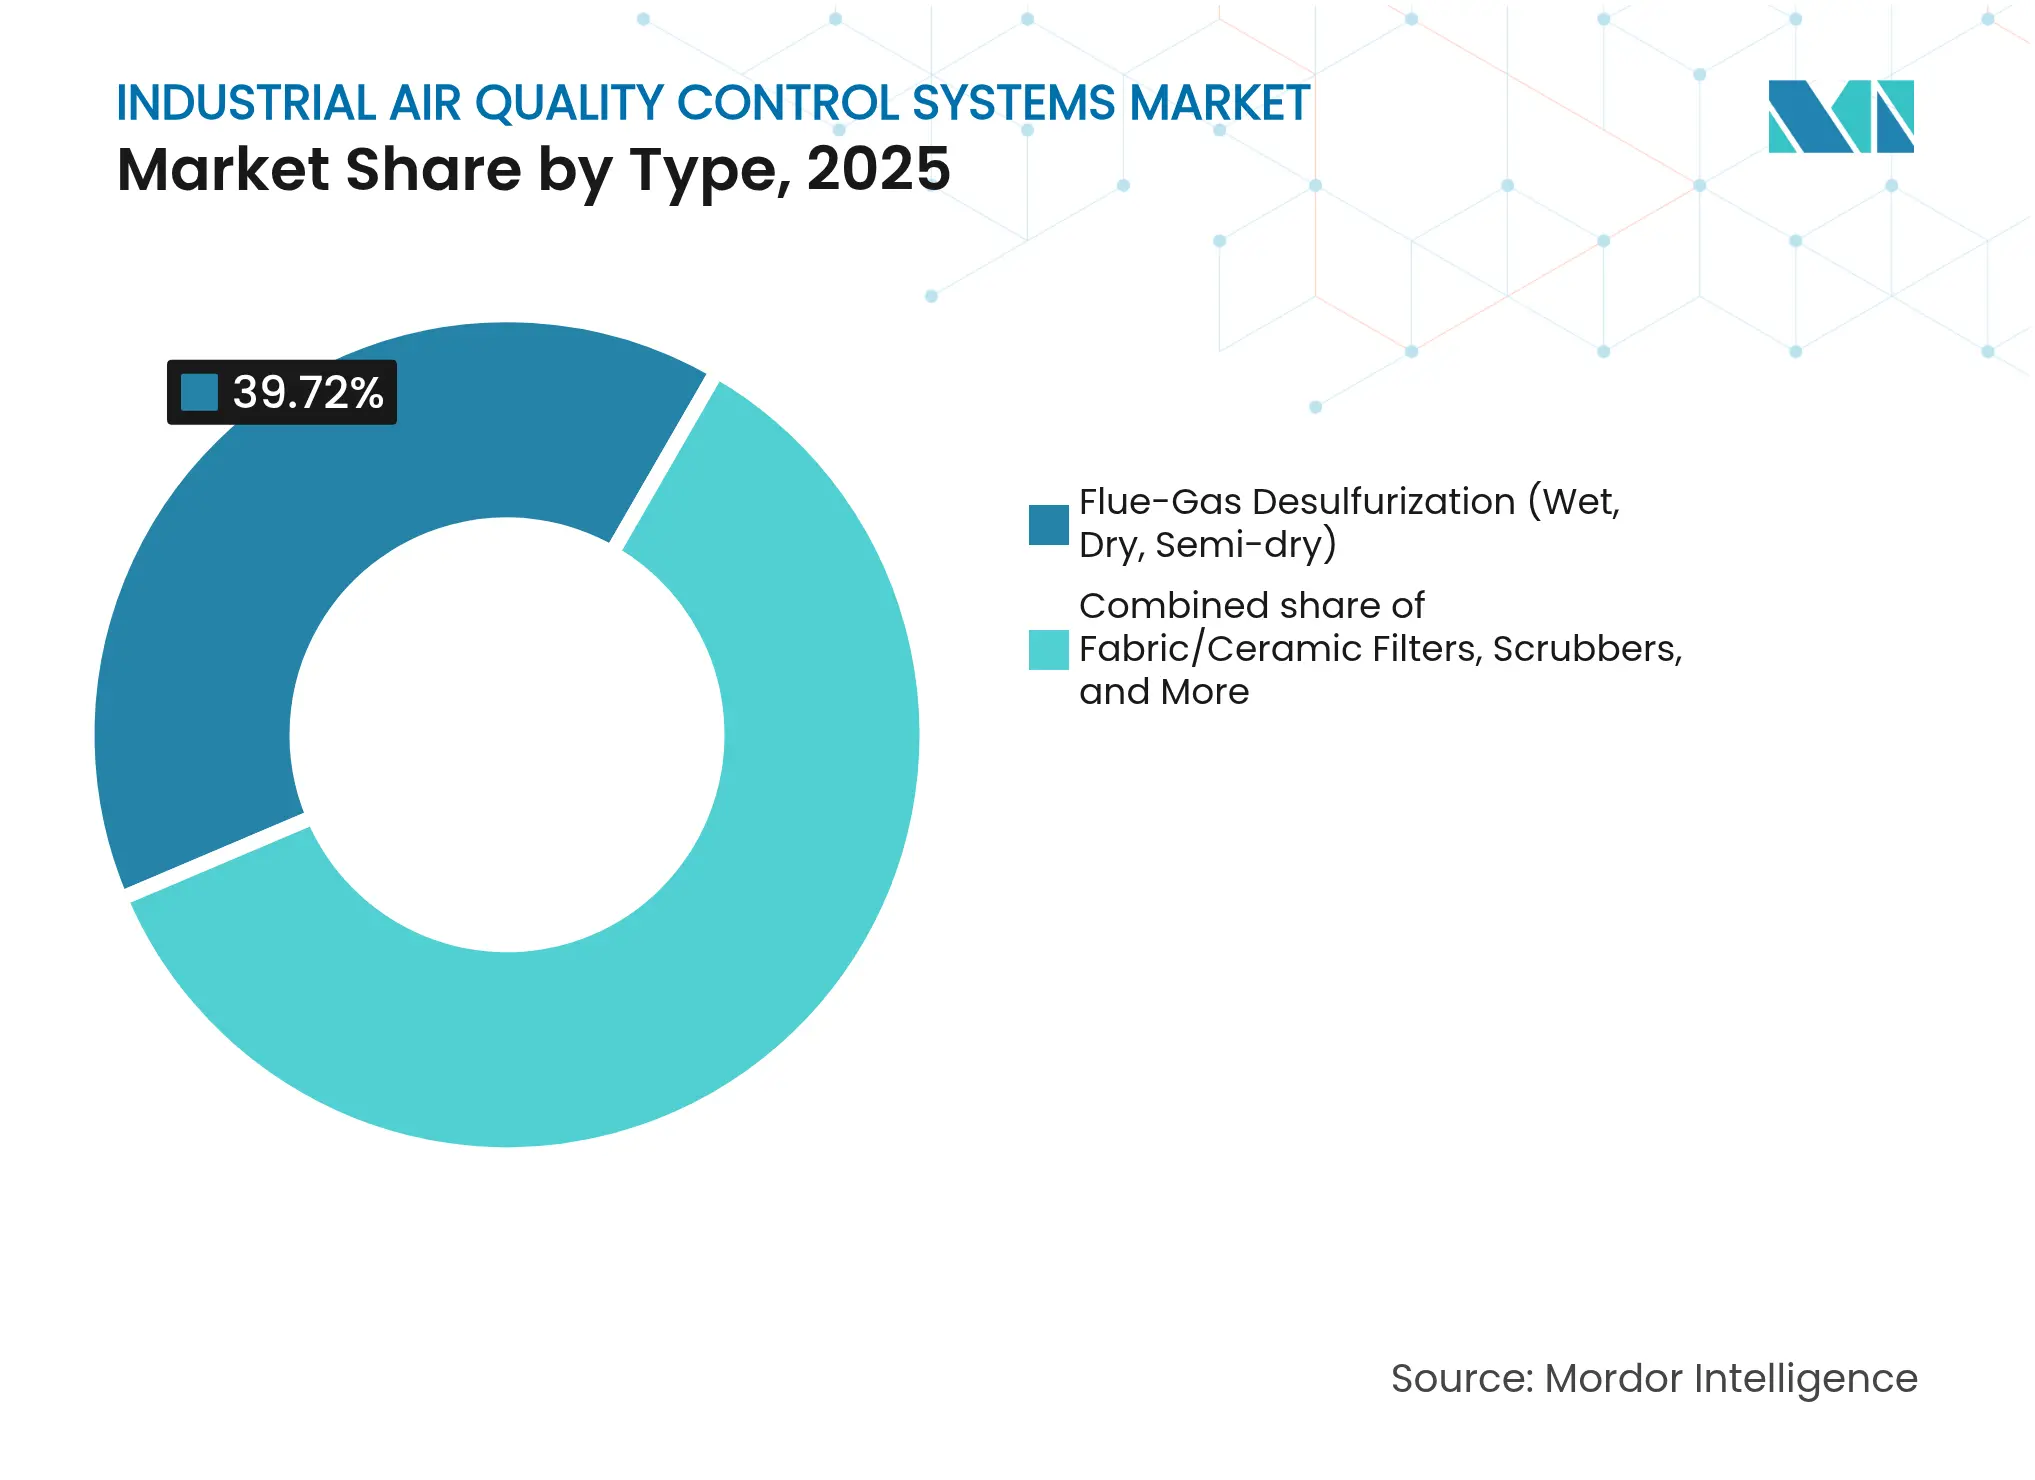
Flue-gas desulfurization retained a 39.72% stake in the industrial air quality control systems market share in 2025, anchored by its indispensability in the combustion of sulfur-rich coal and petcoke. Fabric/ceramic filters outpaced all rivals, achieving an 8.48% CAGR, driven by the need for simultaneous removal of PM, SOx, and NOx. Electrostatic precipitators remain workhorses in bulk power units, while scrubbers gain favor in marine retrofits and chemical plants. Selective catalytic reduction (SCR) and selective non-catalytic reduction (SNCR) sustain demand where NOx caps tighten.
FGD growth stays steady as China and India retrofit limestone-gypsum units to ultra-low emission standards, often integrating oxidation air blowers and gypsum dewatering upgrades. Fabric filters excel in cement and steel lines, where high-temperature catalytic filter candles achieve <5 mg/Nm³ PM emissions, along with 90% NOx reduction at 350 °F. The industrial air quality control systems market size for fabric filters is estimated to climb from USD 15.6 billion in 2025 to USD 25.43 billion by 2031. Adoption quickens when plant owners replace aging ESPs with baghouses during scheduled outages, leveraging existing ducts and fans to minimize downtime.
Note: Segment shares of all individual segments available upon report purchase
By Pollutant Controlled: PM Leadership with VOC Acceleration
Particulate-matter technologies accounted for 38.11% of 2025 revenue, reflecting the ubiquitous presence of dust loads. VOC systems, however, are rising fastest at 7.92% CAGR as chemical and paint lines face tougher solvent limits. SOx control maintains its presence in coal-fired corridors, while NOx solutions gain incremental traction through transportation spillover and industrial boilers. Mercury and air toxics remain niche yet mandatory in power retrofits.
Hybrid VOC platforms combine cryocondensation, adsorption, and catalytic oxidation to reclaim high-value solvents. Linde’s CIRRUS units recover VOCs for resale, offsetting capital expenditures with product value. The industrial air quality control systems market size for VOC applications is poised to exceed USD 9.31 billion by 2031. Meanwhile, advanced PM controls utilize electro-spinning nanofiber layers and pulse-jet algorithms, which reduce compressed-air use, thereby extending bag life and lowering OPEX.
By End-User Industry: Power Dominance with Cement Momentum
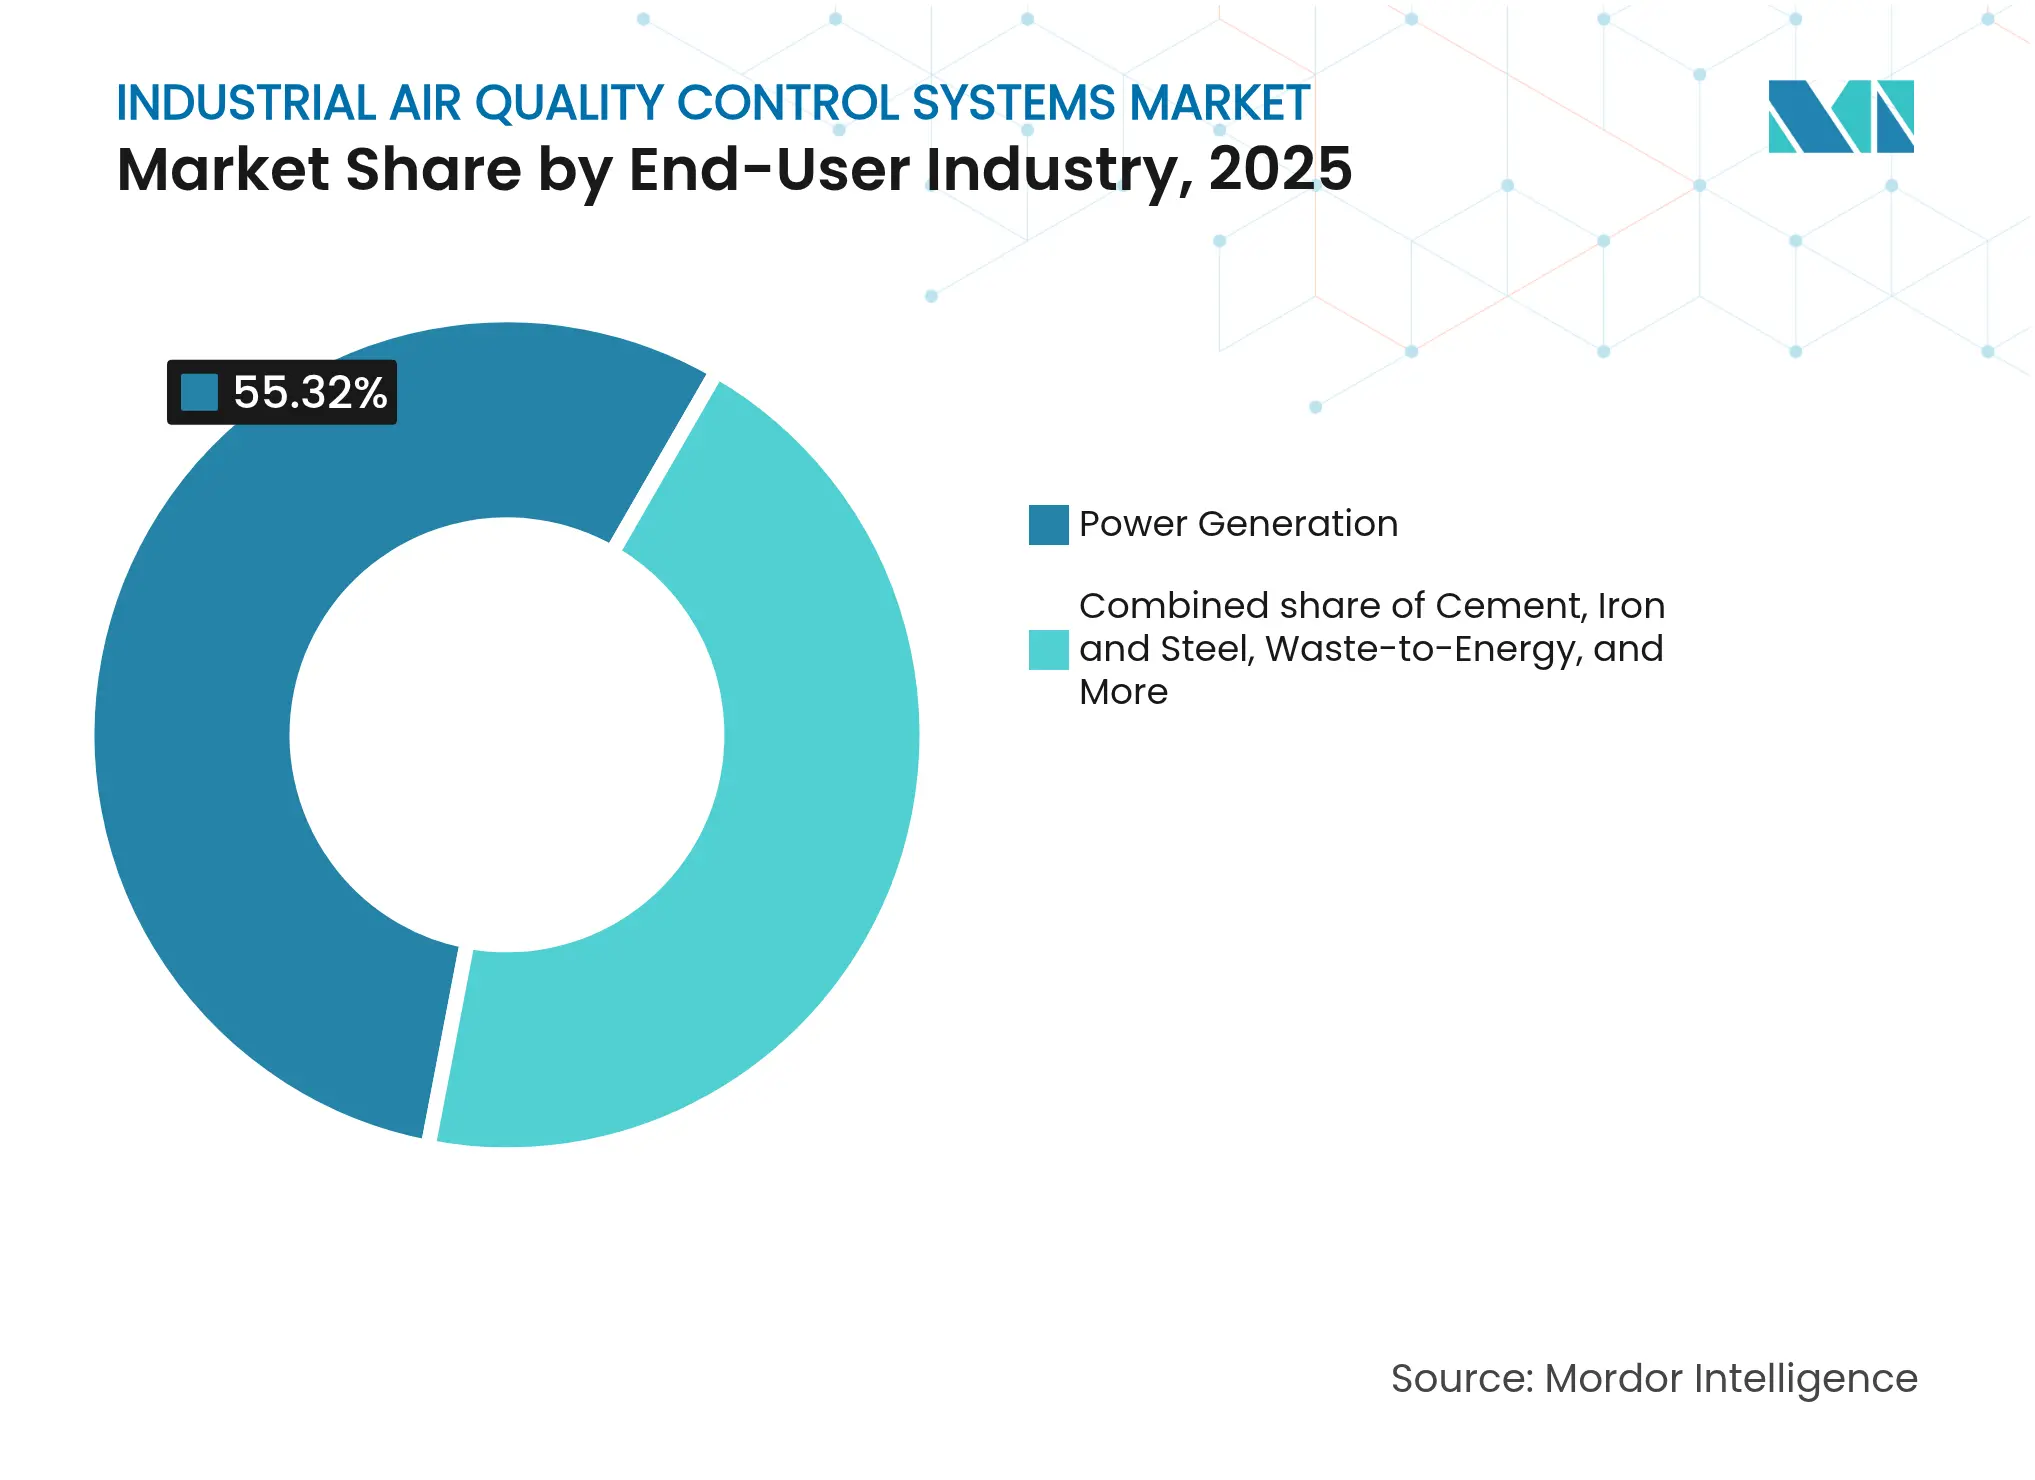
Power plants delivered 55.32% of 2025 global revenue but face plateauing capacity additions outside Asia. Cement shows the strongest growth, rising at a 6.72% CAGR on the back of new kilns in India, Vietnam, and Africa. Steel mills and petrochemical complexes demand temperature-resilient, acid-gas-capable systems, whereas pulp, paper, and waste-to-energy facilities opt for odor and multi-pollutant packages.
Cement operators increasingly deploy regenerative thermal oxidizers paired with SCR to eliminate kiln VOCs and NOx simultaneously. Kiln bypass filters capture alkali-chloride cycles, prolonging refractory life and improving clinker quality. The industrial air quality control systems market share for the cement industry is expected to rise from 10.52% in 2025 to 12.56% by 2031, reflecting the industry’s shift from compliance-driven investments to process efficiency.
Note: Segment shares of all individual segments available upon report purchase
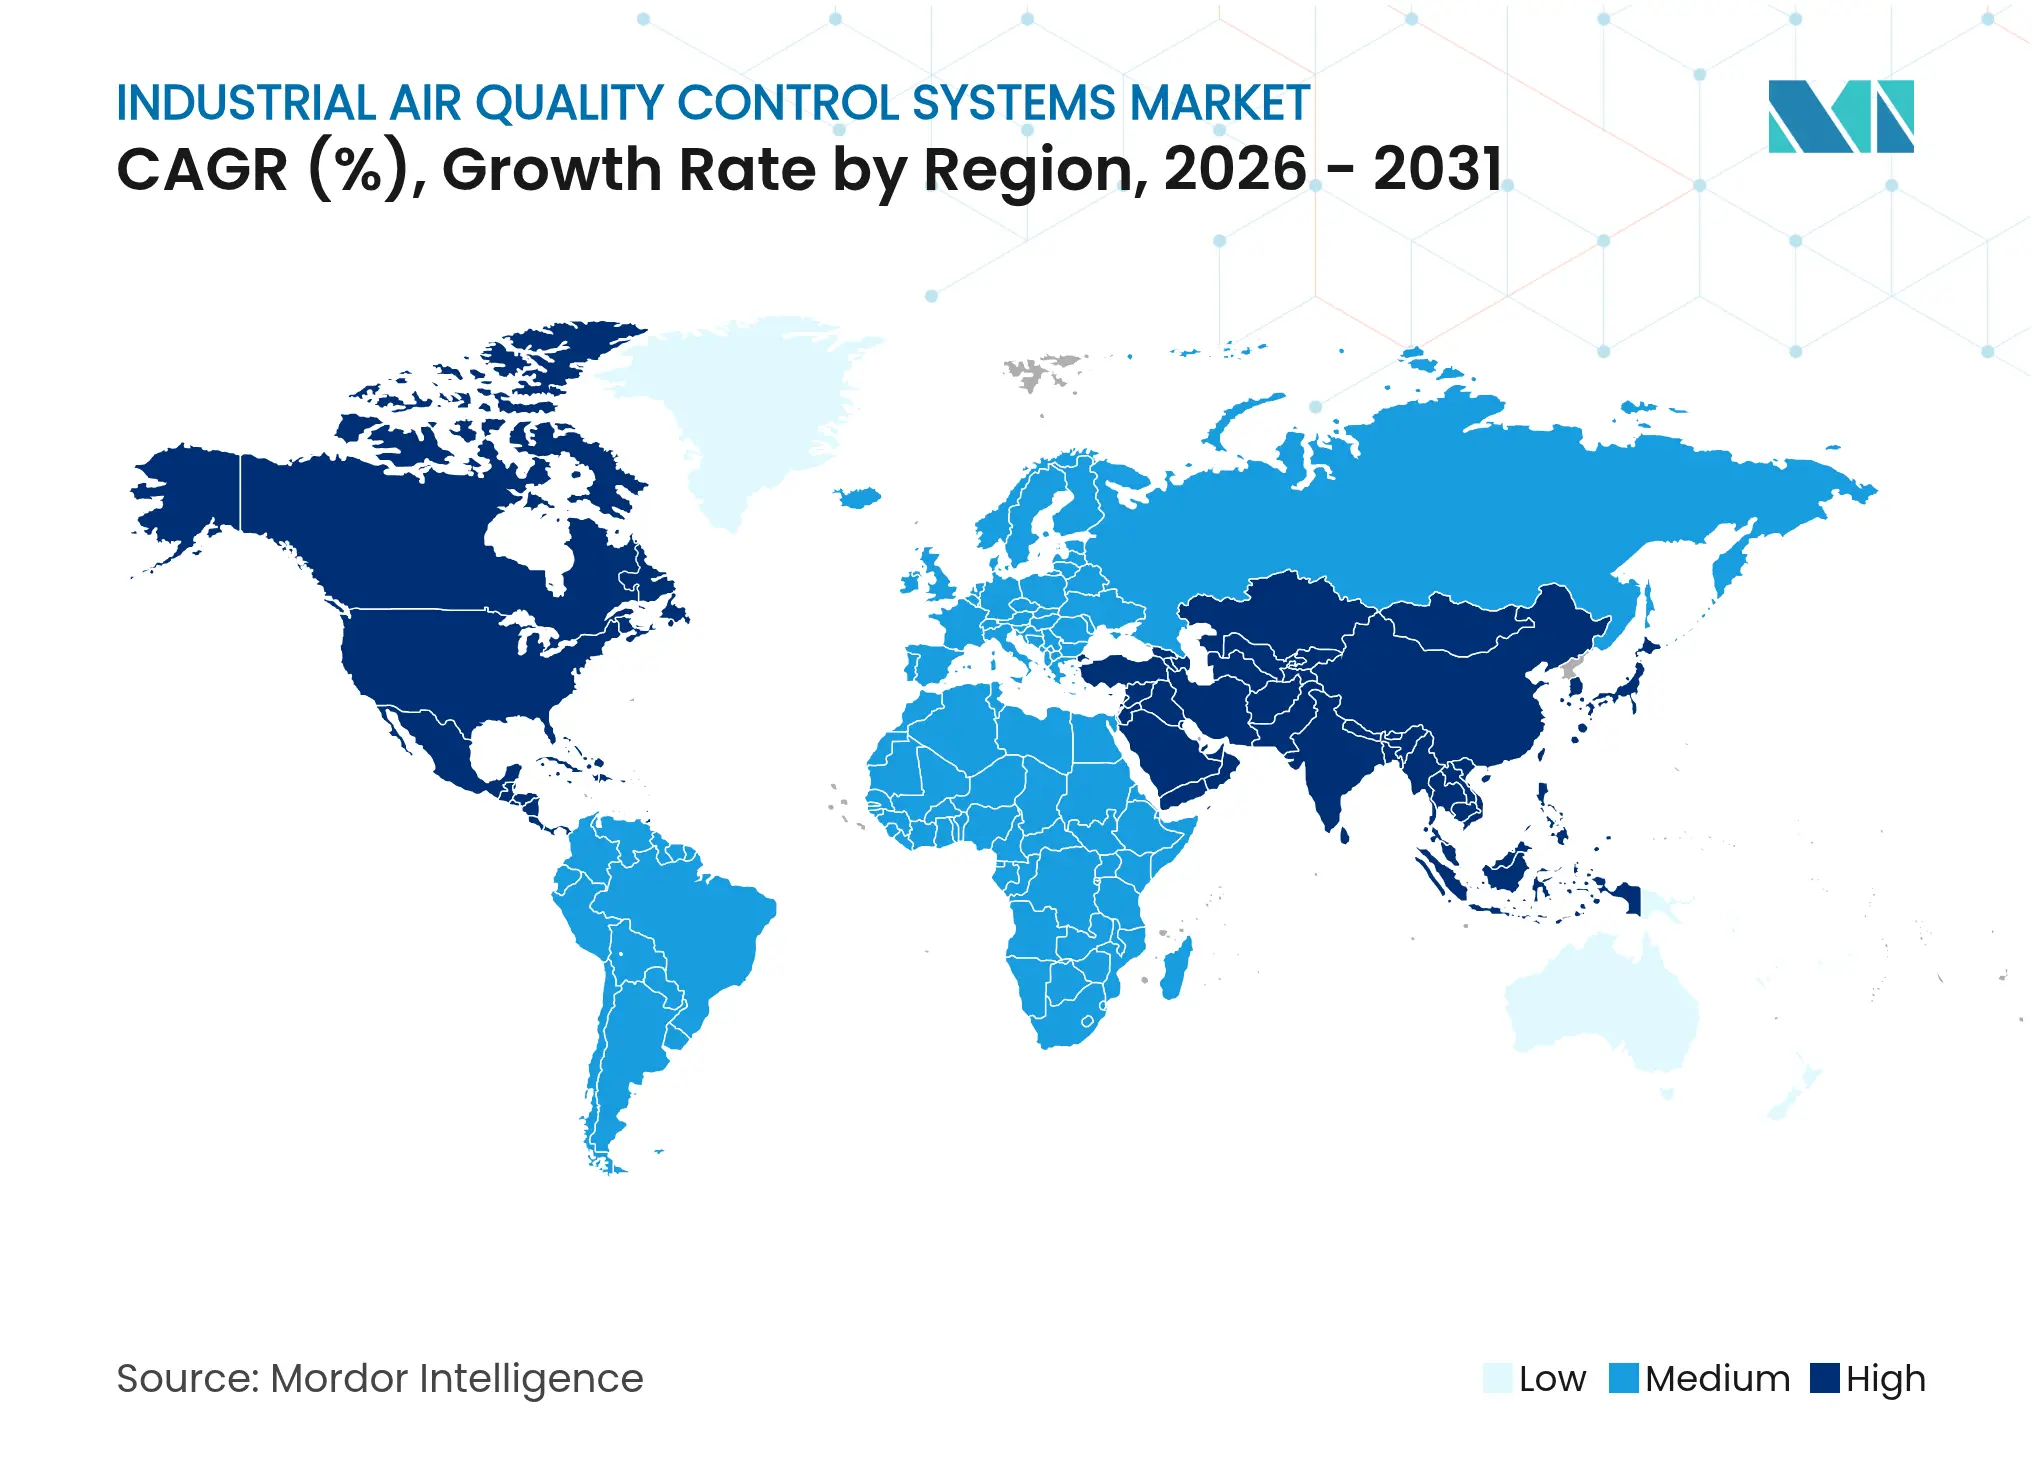
The Asia-Pacific region dominates the industrial air quality control systems market, accounting for 44.18% of the market share in 2025 and is expected to grow at a 5.95% CAGR until 2031. China’s 101 compliant coal units underscore regulatory resolve, with some plants now reporting mercury at 0.29 μg m⁻³ after fly-ash modification. India enforces BS-VI tailpipe limits and drafts BS-VII standards, expanding demand from power to refinery stacks. Southeast Asian nations replicate ultra-low-emission templates, often funded by climate-finance facilities that prioritise the highest-efficiency systems.
North America’s market is retrofit-heavy. The 2024 Mercury and Air Toxics Standards aim for 90% carbon control by 2032, triggering a surge in demand for absorbers and catalysts. Cross-border collaboration under the Canada-U.S. Air Quality Agreement has already slashed SO₂ by 93% and NOx by 70% from 1990 to 2020, offering a proven roadmap for combined federal-state policies.
Europe couples strict emission ceilings with carbon-capture pilots. ANDRITZ will design a plant in Finland that captures all CO₂ from waste-to-energy flue gas to synthesize e-fuels, showcasing integration of AQCS and net-zero ambitions. The region’s package also features stricter ammonia slip limits, stimulating demand for high-activity SCR catalysts.
The Middle East & Africa region registers a rise in industrial projects in refining, petrochemicals, and waste-to-energy. Carbon-based sensor networks, capable of detecting benzene and hydrogen sulfide in real-time, enhance enforcement and drive the early adoption of control equipment. Africa’s fast-growing cooling market compels the adoption of localized air-quality rules, nudging industrial estates to install particulate and odor abatement systems early in their life cycles.
South America advances through national programs that tie credit access to emission-reduction milestones, prompting pulp and mining companies to retrofit their baghouses and dry scrubbers. Regional OEMs collaborate with European licensors to tailor solutions for high-humidity, high-altitude operations.

Reports are available across multiple geographies.
Gain in-depth market insights across regions to support informed decisions.
Market Concentration
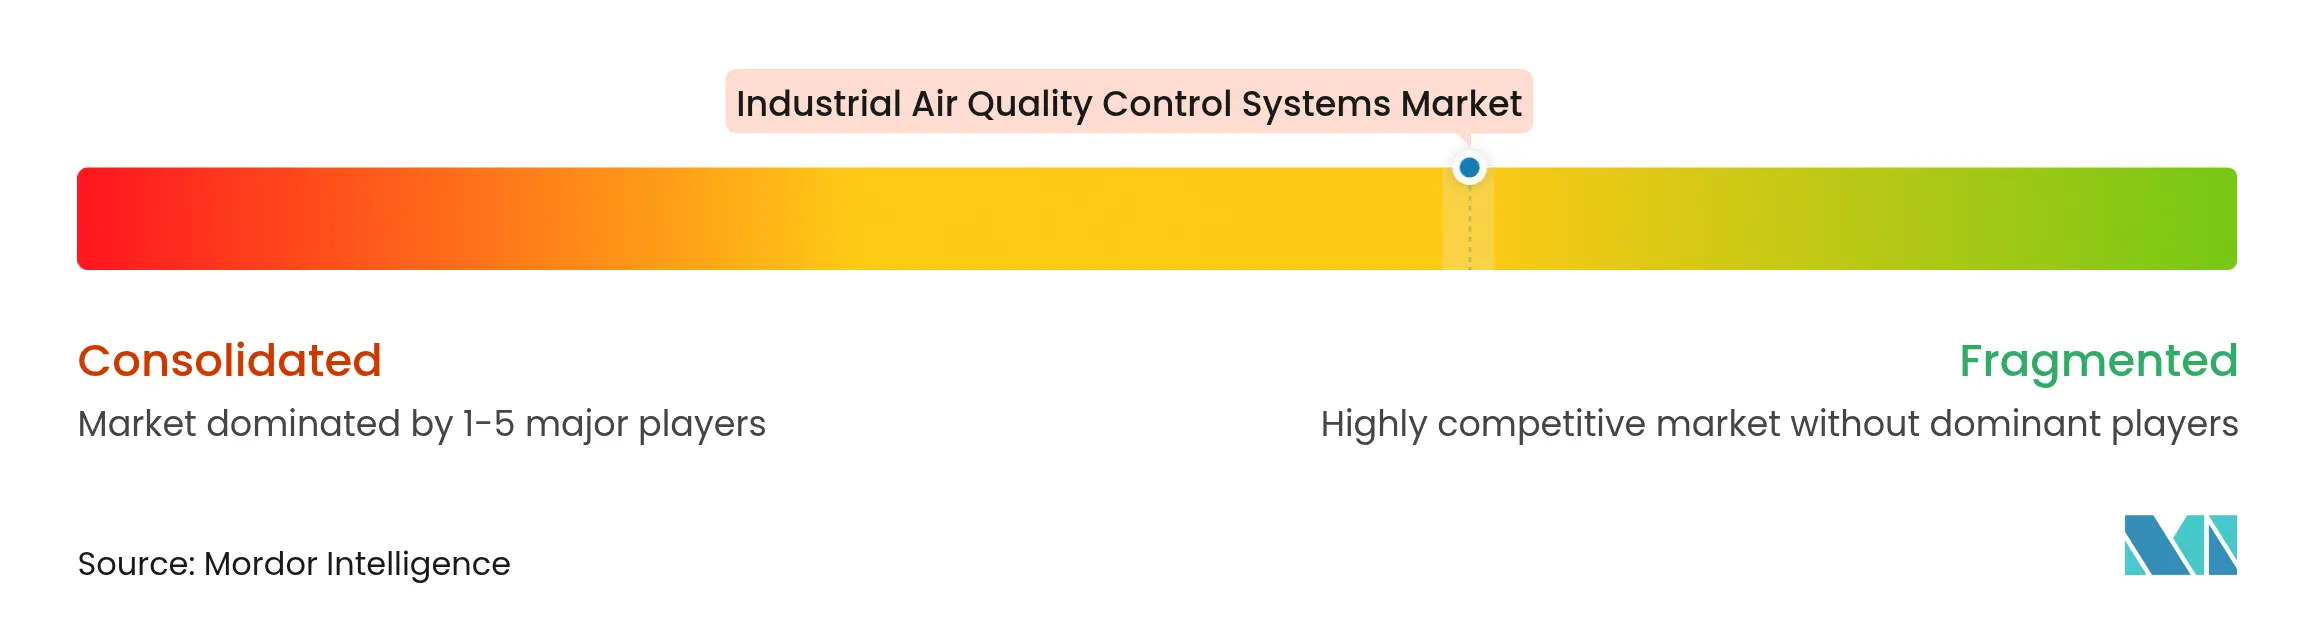
The industrial air quality control systems market is moderately fragmented. Mitsubishi Heavy Industries, GE Vernova, Babcock & Wilcox, Siemens Energy, ANDRITZ, and FLSmidth anchor the top tier. Combined, the five largest vendors hold roughly 55-60% of the revenue, leveraging their portfolio breadth, references, and lifecycle services.
Strategic moves reshape positions:
Disruptive entrants focus on AI, advanced materials, and modular capture units. A University of Virginia team demonstrated graphene-based gas sensors that identify ammonia, SO₂, and H₂S in milliseconds, promising tighter feedback loops and lower reagent costs. Korean startups are fielding filter-free electrostatic purifiers suited for hospitals and data centers, thereby broadening the addressable sub-segments.
Supply-chain resilience becomes a separator. Firms with regional catalyst production or in-house filter media secure delivery schedules amid raw-material volatility. Service-centric models, including performance guarantees and reagent supply contracts, lock in multi-year cash flows that cushion cyclical order fluctuations.

*Disclaimer: Major Players sorted in no particular order
1. Introduction
2. Research Methodology
3. Executive Summary
4. Market Landscape
5. Market Size & Growth Forecasts
6. Competitive Landscape
7. Market Opportunities & Future Outlook
The scope of the industrial air quality control systems market report includes:
| By Type | Electrostatic Precipitators (Dry & Wet) | |
| Flue-Gas Desulfurization (Wet, Dry, Semi-dry) | ||
| Scrubbers (Wet, Dry, Marine) | ||
| Selective Catalytic and Non-Catalytic Reduction | ||
| Fabric/Ceramic Filters | ||
| Mercury and VOC Control Units | ||
| By Pollutant Controlled | Particulate Matter (PM) | |
| SOx | ||
| NOx | ||
| Volatile Organic Compounds (VOC) | ||
| Mercury and Air Toxics | ||
| By End-user Industry | Power Generation | |
| Cement | ||
| Iron and Steel | ||
| Chemicals and Petrochemicals | ||
| Pulp and Paper | ||
| Waste-to-Energy | ||
| Others (Glass, Mining, etc.) | ||
| By Geography | North America | United States |
| Canada | ||
| Mexico | ||
| Europe | Germany | |
| France | ||
| United Kingdom | ||
| Italy | ||
| Russia | ||
| Rest of Europe | ||
| Asia-Pacific | China | |
| India | ||
| Japan | ||
| South Korea | ||
| ASEAN Countries | ||
| Rest of Asia-Pacific | ||
| South America | Brazil | |
| Argentina | ||
| Rest of South America | ||
| Middle East and Africa | Saudi Arabia | |
| United Arab Emirates | ||
| South Africa | ||
| Egypt | ||
| Rest of Middle East and Africa | ||
Unlocking Market Potential for Solid-State Transformers
3 Min Read
Unlocking Saudi Arabia’s Regional Tourism Growth Potential
5 Min Read
MICE Sales Optimization for a Top Hotel Brand
3 Min Read
When decisions matter, industry leaders turn to our analysts. Let’s talk.


