
Industrial Absorbent Market Size and Share
Market Overview
| Study Period | 2021 - 2031 |
|---|---|
| Market Size (2026) | USD 4.35 Billion |
| Market Size (2031) | USD 5.35 Billion |
| Growth Rate (2026 - 2031) | 4.21 % |
| Fastest Growing Market | Asia Pacific |
| Largest Market | Asia Pacific |
| Market Concentration | Medium |
Major Players *Disclaimer: Major Players sorted in no particular order Image © Mordor Intelligence. Reuse requires attribution under CC BY 4.0. | |
Industrial Absorbent Market Analysis by Mordor Intelligence
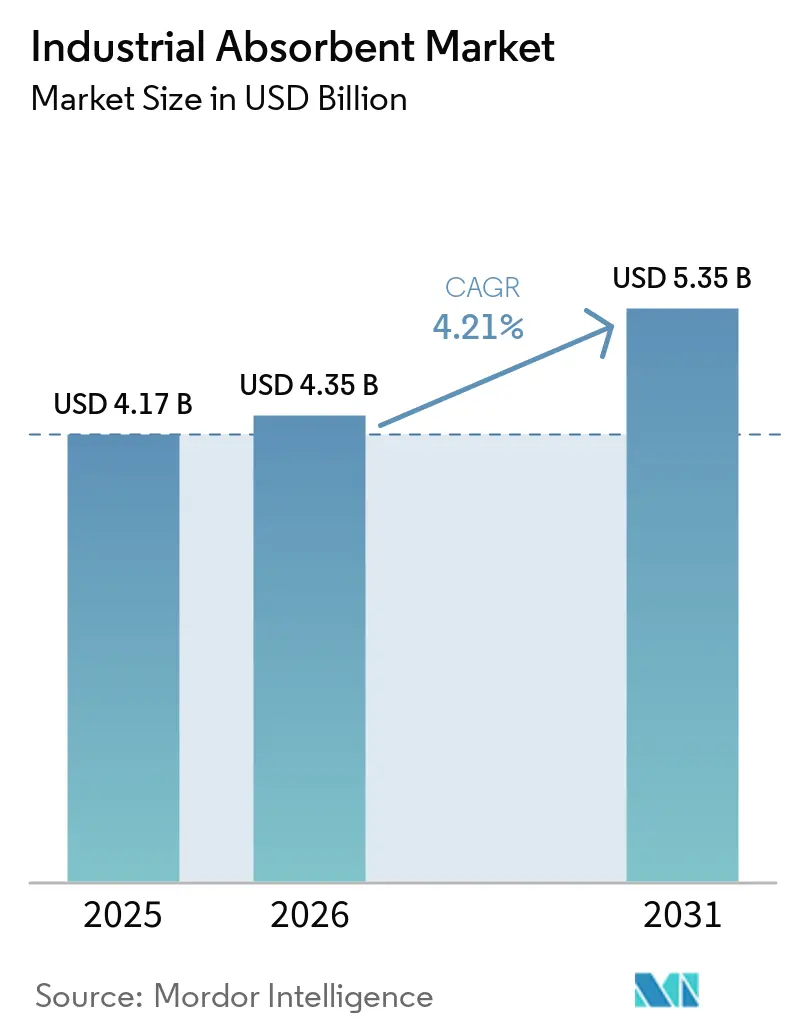
The Industrial Absorbent Market size was valued at USD 4.17 billion in 2025 and is estimated to grow from USD 4.35 billion in 2026 to USD 5.35 billion by 2031, at a CAGR of 4.21% during the forecast period (2026-2031). The outlook reflects a decisive migration from ad-hoc spill response to integrated safety ecosystems that couple absorbents with leak-detection sensors and predictive-maintenance software. Buyers in petrochemicals and heavy manufacturing are embedding these consumables into capital-project budgets, a change that smooths demand even when production cycles fluctuate. Asia-Pacific remains the volume anchor, yet its growth narrative is increasingly propelled by regulatory ratchets in China and India that mandate certified absorbent materials with documented end-of-life traceability. Competitive intensity remains elevated because the five largest suppliers control less than 40% of revenue, leaving room for regional specialists to undercut on price or out-innovate on sustainability.
Key Report Takeaways
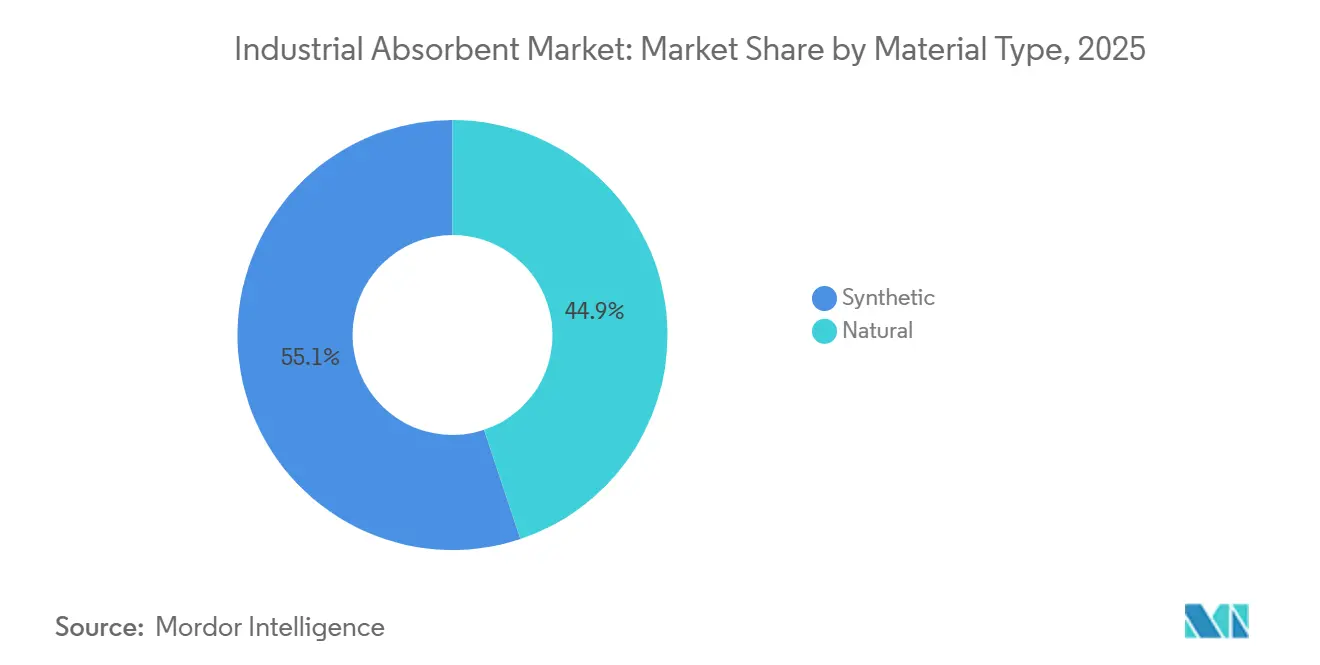
- By material type, synthetic absorbents led with 55.12% of the industrial absorbent market share in 2025, whereas natural materials are projected to post the fastest 5.13% CAGR through 2031.
- By type, oil-only absorbents captured 35.67% revenue share of the industrial absorbent market size in 2025 and are expected to advance at a 4.89% CAGR to 2031.
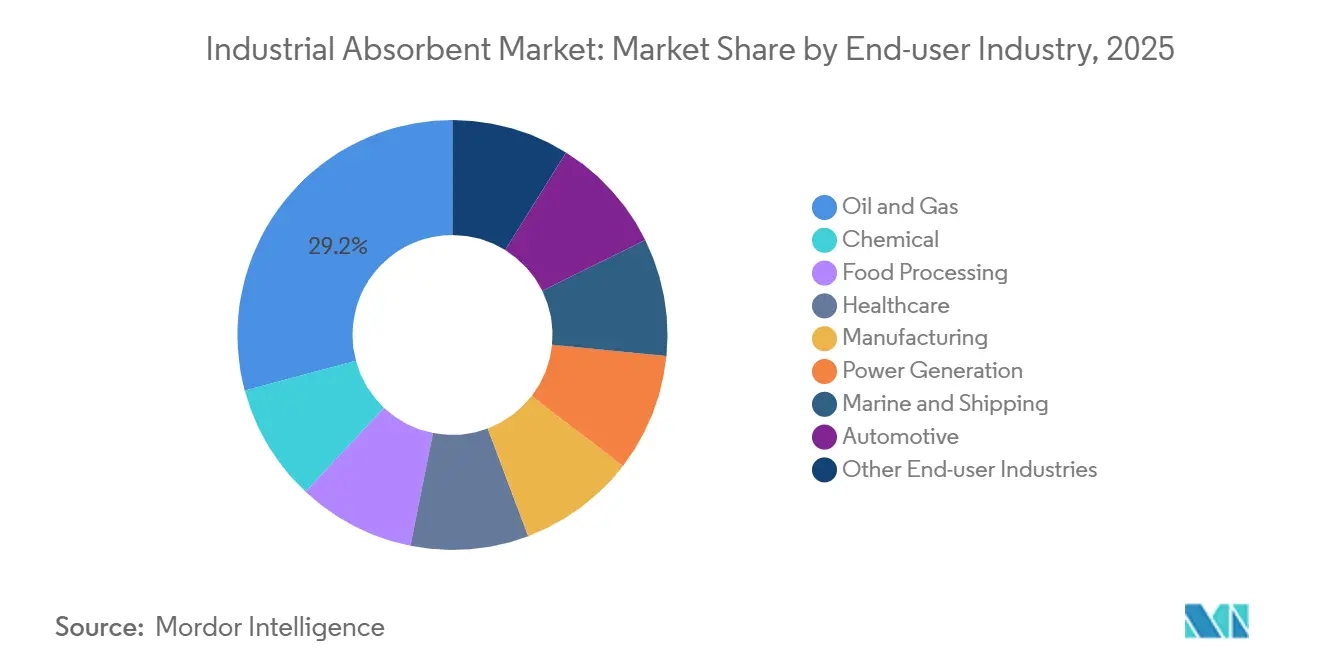
- By end-user industry, oil and gas accounted for a 29.16% share of the industrial absorbent market size in 2025, while healthcare is on track for a 5.67% CAGR through 2031.
- By geography, Asia Pacific dominated with 38.32% industrial absorbent market share in 2025; the region is set to grow at a 5.78% CAGR through 2031.
Note: Market size and forecast figures in this report are generated using Mordor Intelligence’s proprietary estimation framework, updated with the latest available data and insights as of January 2026.
Market Trends and Insights
Drivers Impact Analysis of Industrial Absorbent Market*
| Driver | (~) % Impact on CAGR Forecast | Geographic Relevance | Impact Timeline |
|---|---|---|---|
| Rising demand for spill-control in oil and gas expansion | +1.2% | Middle East, North America, Asia-Pacific | Medium term (2-4 years) |
| Stricter multi-regional environmental enforcement | +1.0% | Global, with EU and China leading | Long term (≥4 years) |
| Increasing cost and frequency of industrial spills | +0.8% | Global | Short term (≤2 years) |
| Rapid growth of Asia-Pacific petrochemical output | +0.9% | Asia-Pacific core, spill-over to Middle East | Medium term (2-4 years) |
| Commercialization of bio-based sorbents from agro-waste | +0.5% | North America, Europe, India | Long term (≥4 years) |
| Source: Mordor Intelligence | |||
Rising Demand for Spill-Control in Oil and Gas Expansion
Global upstream capital expenditure reached USD 525 billion in 2025, a 12% jump over 2024, with the Middle East supplying 38% of the incremental outlay[1]. Each new rig, pipeline, or processing skid requires oil-only booms and pads to comply with spill-prevention standards under the US Clean Water Act and similar regulations in the Gulf Cooperation Council. North American shale operators drilled 1,200 additional horizontal wells in 2025, and each completion generated spill-control demand for hydrophobic mats that contain 18 barrels of flow-back fluid during tank transfers. Longer-lateral wells, some exceeding 3 km, raise the number of surface connections and elevate micro-leak risks, which sustains absorbent pull-through even as rig counts plateau. Insurance carriers now request documented absorbent inventories before underwriting general liability policies, pushing facilities to hold safety-stock levels that further buoy the industrial absorbents market.
Stricter Multi-Regional Environmental Enforcement
The European Union’s Industrial Emissions Directive, revised in 2024, obliges sites handling more than 10 t of hazardous liquids annually to demonstrate “best available techniques” for spill containment, effectively codifying certified absorbent usage and disposal trails. China’s Ministry of Ecology and Environment instituted a parallel framework in 2025 for petrochemical clusters along the Yangtze River Economic Belt, requiring absorbent liners that meet GB 18597 leachate-prevention standards. Enforcement intensity is tangible: EU states issued 1,840 spill-control citations in 2025 and lifted average fines to EUR 47,000 per incident[2]. ISO 14001 audits now include absorbent stock verification, turning previously discretionary spending into a non-negotiable compliance line item. This regulatory ratchet is translating into a full percentage point of additional long-term CAGR for the industrial absorbents market.
Increasing Cost and Frequency of Industrial Spills
The US National Response Center recorded 11,200 hazardous-material incidents in 2025, a 9% uptick from 2024, with chemical manufacturing and transport responsible for 42% of cases. Average cleanup expense for a 50-gallon industrial spill climbed to USD 8,500 in 2025 after disposal fees and contractor rates rose 15%. Facilities are therefore pre-positioning absorbent kits at high-risk transfer points to contain leaks within the first 10 minutes, a practice that can trim cleanup costs by 60% according to OSHA incident data. Insurers have tightened policy language to require on-site absorbent inventories, effectively hard-coding baseline demand into risk-management programs. This behavior change adds 0.8 percentage points to the near-term growth trajectory of the industrial absorbents market.
Rapid Growth of Asia-Pacific Petrochemical Output
China brought 4.2 million t per year of new ethylene capacity online in 2025, each cracker demanding 120–180 t of absorbents annually for maintenance and emergency response. India’s petrochemical output grew 11% as Reliance Industries and Indian Oil ramped up cracker utilization. Southeast Asian nations such as Vietnam and Indonesia are also adding downstream polymer assets under stricter environmental-impact assessments that mandate certified absorbents. The spill-over effect reaches the Middle East, where Saudi Arabia’s USD 20 billion Amiral complex sources absorbents from Asian vendors, tightening regional supply. Collectively, these expansions inject 0.9 percentage points into medium-term CAGR for the industrial absorbents market.
Restraints Impact Analysis of Industrial Absorbent Market*
| Restraint | (~) % Impact on CAGR Forecast | Geographic Relevance | Impact Timeline |
|---|---|---|---|
| Worker-exposure hazards in manufacturing and disposal | -0.4% | Global, with stricter enforcement in North America and EU | Medium term (2-4 years) |
| Volatile polypropylene and mineral feedstock prices | -0.6% | Global | Short term (≤2 years) |
| Shift toward reusable spill-containment booms and pads | -0.3% | Marine and offshore sectors, North America and Europe | Long term (≥4 years) |
| Source: Mordor Intelligence | |||
Worker-Exposure Hazards in Manufacturing and Disposal
OSHA’s 2025 crystalline-silica rule lowered permissible exposure to 50 µg/m³, forcing clay-absorbent plants to install high-capacity ventilation or switch to amorphous silica at 30–40% higher material cost. Three US manufacturers accrued USD 1.2 million in fines during the first compliance year. On the disposal side, spent absorbents contaminated with hazardous chemicals are now F-listed waste under the Resource Conservation and Recovery Act, and incineration fees rose 18% in 2025 amid landfill-capacity tightness. EU “duty of care” clauses extend liability down the waste stream, discouraging smaller firms without dedicated compliance staff from adopting single-use absorbents. These factors remove 0.4 percentage points from medium-term CAGR.
Volatile Polypropylene and Mineral Feedstock Prices
Polypropylene resin traded between USD 1,200 and USD 1,650 /t in 2025 as naphtha prices swung with crude volatility and hurricane-related cracker outages on the US Gulf Coast. Spot spikes above USD 1,600 /t pushed several mid-tier converters into negative gross margins. Mineral absorbents faced comparable headwinds as Chinese attapulgite exports tightened and US mining energy costs climbed; attapulgite prices rose 22% while diatomaceous earth gained 14%. Buyers negotiated quarterly price-adjustment clauses, yet smaller distributors cut inventories, slowing market velocity. The result is a 0.6 percentage-point drag on near-term growth for the industrial absorbents market.
*Our forecasts treat driver/restraint impacts as directional, not additive. The impact forecasts reflect baseline growth, mix effects, and variable interactions.
Industrial Absorbent Market Segment Analysis
By Material Type:
Natural Fibers Gain Ground on Cost and ComplianceSynthetic formats still held 55.12% revenue in 2025, a lead underpinned by the five-year shelf life of sealed melt-blown webs compared with 18–24 months for untreated natural fibers, yet bio-based suppliers are closing the gap with barrier-coated foil packaging. Universal absorbents that sandwich polypropylene layers around a cellulose core are gaining favor in automotive plants where spills may involve both water and oil, thereby simplifying inventory management. Hazmat absorbents, tailored for acids and aggressive chemicals, enjoy niche demand in battery manufacturing, where electrolyte leaks require polypropylene fabrics resistant to hydrofluoric acid. Natural fibers are projected to grow at a 5.13% CAGR through 2031, outpacing synthetics despite their smaller base. In 2025, rice-husk absorbents processed via carbonization and hydrophobization delivered 8–12× oil retention at 20–30% lower landed cost than polypropylene pads. India’s Council of Scientific and Industrial Research validated coconut-coir mats treated with silane coupling agents, unlocking export potential to Europe and North America.
In disposal economics, lighter-weight natural mats reduce landfill tonnage and transportation costs, advantages amplified by rising waste-management fees in the EU and Japan. Carbon accounting adds a further tailwind: a bio-based mat carries about one-third the cradle-to-gate emissions of a polymer equivalent, a metric now scrutinized under the EU Corporate Sustainability Reporting Directive. As natural suppliers integrate upstream into feedstock aggregation and downstream into finished pad production, their delivered-cost advantage could widen. Nonetheless, scale constraints persist; agro-waste availability is seasonal, and pre-treatment plants often operate below optimal utilization, limiting price competitiveness during peak polymer oversupply.
By Type:
Oil-Only Absorbents Lead on Offshore and Petrochemical DemandOil-only absorbents commanded 35.67% of 2025 revenue and are advancing at a 4.89% CAGR, driven by offshore wind construction and petrochemical expansions that require hydrophobic materials impervious to seawater. Each new offshore turbine nacelle consumes about 12 kg of pads during annual maintenance. Engineered oleophilic coatings on these pads deliver oil-to-water selectivity exceeding 20:1, a threshold that universal variants cannot match. Middle Eastern complexes such as the Amiral project installed 4,200 m of boom for secondary containment around storage tanks.
Universal absorbents, the workhorse for mixed-fluid environments, benefit from simplified inventory rules in food and beverage plants where spills may involve water, cleaning solutions, or cooking oils. Hazmat formats, though volumetrically smaller, are experiencing steady uptake in battery gigafactories, where electrolyte spills require fabrics resistant to corrosive lithium salts. Specialty types designed for mercury or radioactive liquids serve episodic niches in healthcare and nuclear decommissioning. Competition among types is, therefore, more a matter of application specificity than price. As offshore wind and petrochemical investments surge, oil-only formats will likely extend their lead, though universal products will continue to dominate in multi-fluid manufacturing settings, sustaining diverse demand across the industrial absorbents market.
By End-User Industry:
Healthcare Surges on Infection-Control ProtocolsOil and gas retained the revenue crown with 29.16% in 2025, underpinned by continuous drip-pan and valve-leak applications at well sites and midstream terminals. Healthcare is set to post the fastest 5.67% CAGR to 2031 as hospitals adopt single-use mats impregnated with silver ions to contain blood-borne pathogens during surgery. The US CDC revised its spill-control guidelines in March 2025, recommending absorbent barriers for all Category A infectious substances. European hospitals followed suit after ECDC data showed 3.2 million patients affected by healthcare-associated infections in 2025.
Chemical manufacturing remains a core consumer, especially in batch reactors that produce frequent microspills of corrosive or flammable liquids. Food-processing demand is accelerating as US FDA sanitation audits now survey absorbent protocols, and production holds linked to non-compliance can cost USD 15,000–30,000 per day. Marine and shipping segments see periodic spikes tied to International Maritime Organization regulations requiring vessels over 400 GT to carry oil-only booms and pads. Manufacturing, power generation, and automotive each maintain mid-single-digit shares, their trajectories tethered to capacity additions and regulatory vigilance. The industrial absorbents market therefore exhibits a broad end-user portfolio, with healthcare emerging as the fastest growth vector while energy and chemicals anchor volume.

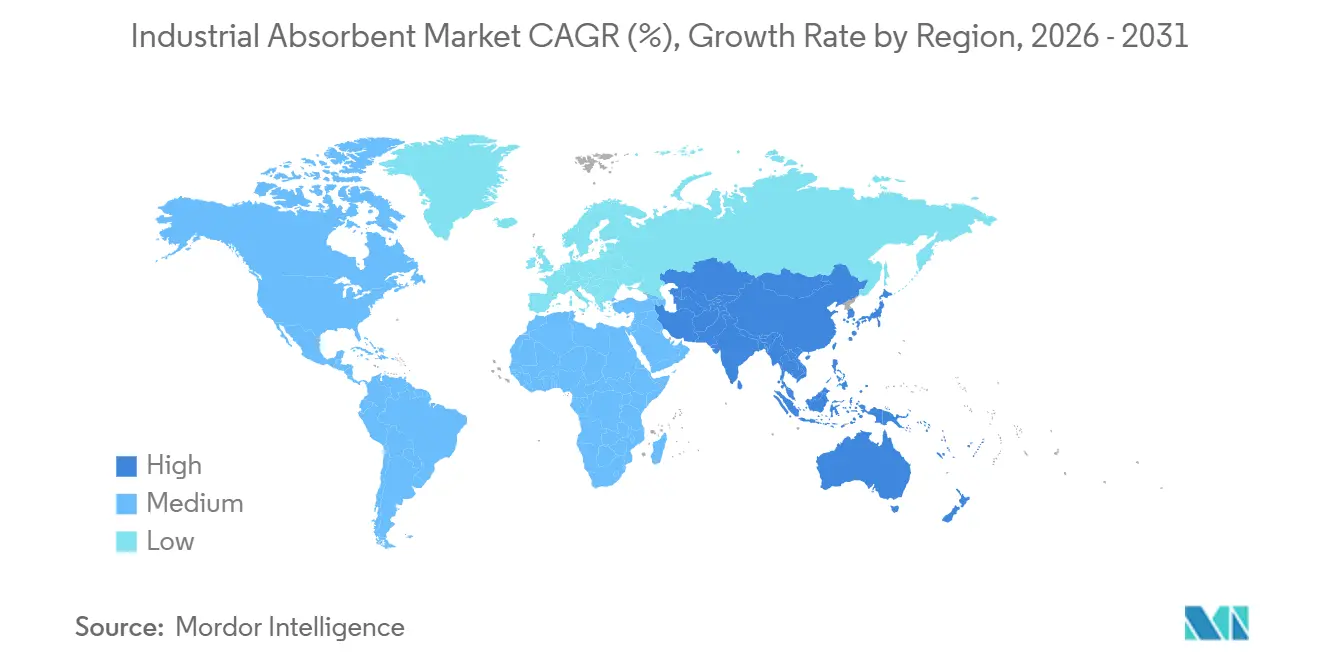
Geography Analysis
APAC Industrial Absorbent Market
Asia-Pacific contributed 38.32% of 2025 revenue and is projected to expand at a 5.78% CAGR to 2031, underscoring its dual drivers of petrochemical capacity growth and increasingly stringent environmental mandates. China’s 4.2 million t ethylene additions in 2025 created recurring demand of roughly 120–180 t of absorbents per cracker for maintenance and emergency readiness. India’s Central Pollution Control Board broadened mandatory spill-response plans to facilities handling more than 5 t of hazardous liquids, capturing 1,200 additional sites in 2025. Japan’s April 2025 revision of the Industrial Safety and Health Act requires documented absorbent stockpiles, adding 800 t of annual demand. ASEAN petrochemical entrants face export-oriented customers that demand ASTM-compliant spill kits, lifting import volumes into Vietnam and Indonesia.
North America Industrial Absorbent Market
North America remains the second-largest region, buoyed by shale expansion and Gulf Coast chemical builds. The Permian Basin added 1,200 horizontals in 2025, each requiring hydrophobic mats for flow-back containment. The US SPCC rule applies to 638,000 facilities with above-ground oil storage exceeding 1,320 gal and underpins baseline demand for oil-only absorbents. Canada’s oil-sands production rebounded to 3.1 mb/d, triggering restock cycles for clay granules and polypropylene pads. Mexico’s Pemex began upgrading spill-response kits after environmental fines in 2024, creating fresh orders for universal and hazmat variants.
Europe Industrial Absorbent Market
Europe is oriented toward sustainability-driven procurement. The Corporate Sustainability Reporting Directive forces large enterprises to disclose carbon footprints of consumables, accelerating adoption of bio-based mats and reusable systems. Germany, the UK, and France collectively account for more than half of regional demand, with volumes anchored in chemicals, automotive, and food. Price sensitivity has moderated as corporations assign internal carbon prices that favor low-emission alternatives.
South America and MEA Industrial Absorbent Market
South America’s growth pivots on energy and mining. Brazil’s pre-salt output rose by 240,000 b/d in 2025, and Ibama licenses require oil-only booms on each offshore platform. Argentina’s Vaca Muerta ramped 180 new wells in 2025, sourcing absorbent supplies both locally and from the US. The Middle East and Africa rely on hydrocarbon investments; Saudi Arabia’s Amiral complex, operational since late 2024, imports pads and socks from Asian fabricators. UAE and Qatar LNG projects mirror those specifications, while South Africa and Nigeria see intermittent demand spikes tied to power-plant overhauls and port expansions. Collectively, the geographic mosaic confirms that the industrial absorbents market maintains diversified regional anchors, with Asia-Pacific setting the pace.
Value Chain Analysis
The industrial absorbent value chain starts with upstream feedstocks and media: polyolefin resins (notably polypropylene) for meltblown and spunbond nonwovens, cellulose pulp and recycled fiber streams for airlaid and cellulose-based laminates, and mined minerals such as clay/attapulgite and diatomaceous earth for granular products. These inputs move through converting steps that define performance by application (universal, oil-only, and hazmat) and by format (pads, rolls, socks, pillows, booms, and loose granular). Manufacturing economics are highly sensitive to resin and mineral price swings, while cellulose and agro-waste pathways add variability tied to collection, pretreatment, and seasonality.
In North America and Europe, Domtar's Engineered Absorbent Materials (EAM) platform illustrates midstream integration of airlaid and laminated substrates that shape supply dynamics. Midstream producers and converters differentiate either through scale nonwoven production and standardized SKUs or through engineered constructions (airlaid/laminated structures and coatings) aimed at higher absorbency per unit and better handling. Downstream, distribution splits between (1) service-led channels where premium brands bundle absorbents with spill-program design, compliance documentation, and inventory management and (2) commodity-led channels that compete on regional logistics, bulk delivery, and price. End-of-life handling (segregation, manifesting, and disposal) is a critical final link because spent absorbents often enter regulated waste streams, making suppliers and distributors that can support disposal coordination and audit-ready documentation more valuable to buyers seeking repeatable compliance.
Competitive Landscape
The Industrial Absorbent market is moderately consolidated. Consolidation pressure is rising, however, as large buyers demand integrated solutions that bundle materials with sensor-enabled cabinets and inventory-tracking software. In 2025, Brady rolled out connected spill-response stations that trigger automatic reorders when stock falls below thresholds, an innovation already piloted in 18 chemical plants. Vertically integrated players that control polymer extrusion, nonwoven production, and spill-service contracts are best positioned to weather raw-material volatility and capture premium margins.
Industrial Absorbent Industry Leaders
-
3M
-
Brady Worldwide, Inc.
-
Kimberly-Clark Worldwide, Inc.
-
Oil-Dri Corporation of America
-
New Pig Corporation
- *Disclaimer: Major Players sorted in no particular order

Industrial Absorbent Market Companies Covered in this Report
- 3M
- Absorbent Products
- Ansell Ltd.
- Brady Worldwide, Inc.
- Chemtex Industries
- Decorus Europe
- EP Minerals
- ITU AbsorbTech, Inc.
- Jaycot Industries
- Johnson Matthey
- Justrite
- Kimberly-Clark Worldwide, Inc.
- Meltblown Technologies Inc.
- New Pig Corporation
- Oil-Dri Corporation of America
- Tosla
Market Opportunities and Future Outlook
Service-led replenishment and digitally enabled management represent concrete opportunities as industrial sites shift toward managed spill-control programs. The market is seeing adoption of connected spill-response stations that automate reorders and formalize stocking thresholds, creating openings for suppliers to expand beyond product sales into recurring program management, compliance support, and disposal coordination for multi-site customers.
Materials innovation widens opportunities, particularly where sustainability reporting and waste-reduction targets influence consumable choices. Bio-based and biodegradable nonwoven alternatives (for example, PLA meltblown sorbent research) and high-performance sorbents tailored for demanding conditions (such as high-temperature adsorption materials reported in 2026 technical literature) illustrate a pipeline of differentiated products beyond standard polypropylene pads. On the industrial buyer side, healthcare protocols emphasizing single-use infection-control barriers and Asia-Pacific petrochemical capacity additions institutionalize maintenance and emergency spill preparedness, reinforcing demand for certified, application-specific absorbents and enabling suppliers that can validate performance and provide documentation aligned with customer audit requirements.
Recent Industry Developments in Industrial Absorbent Market
- June 2026: Domtar completed the sale of its Engineered Absorbent Materials (EAM) business to Saothair Capital Partners. The transaction shifts ownership of an airlaid and laminated materials platform used across industrial and medical-related applications, with implications for sourcing strategies among converters that rely on engineered substrates. It also highlights continued portfolio reshaping around specialty material capabilities that can influence availability and innovation pace in adjacent absorbent end markets.
- April 2025: Kimberly-Clark Professional launched enhanced WypAll X70 Medium Duty and WypAll X80 Heavy Duty cleaning cloths with performance-engineered construction and surface textures to increase oil and water absorbency. The company stated the WypAll X70 absorbs up to 20% more than prior versions, and select formats moved to 10% larger sheet sizes. The upgrade targets improved cost-to-performance for industrial users by raising absorbency per cloth and reducing changeout frequency.
- April 2025: FyterTech Nonwovens upgraded its Sustayn absorbent product line with biodegradation acceleration technology and positioned the change as improving end-of-life performance versus conventional meltblown pads. The update supports buyers that are tightening procurement requirements around sustainability metrics and disposal outcomes. It also increases competitive pressure on incumbent polypropylene-based pads by adding differentiated environmental claims to nonwoven absorbents.
Industrial Absorbent Market Report Scope and Research Methodology
Market Definition and Coverage
This market covers industrial absorbent products used to soak up, contain, and clean liquids in workplaces, including oil, coolants, water-based fluids, and chemicals. The sizing is expressed as revenue from absorbent materials sold for spill response and routine housekeeping in industrial and commercial sites.
Scope exclusions: Consumer hygiene absorbents, personal wipes, and bulk super-absorbent polymer feedstocks are excluded from this market sizing.
Segments Covered in This Report
- By Material Type
- Natural
- Synthetic
- By Type
- Universal
- Oil-only
- Hazmat
- Other Types
- By End-user Industry
- Oil and Gas
- Chemical
- Food Processing
- Healthcare
- Manufacturing
- Power Generation
- Marine and Shipping
- Automotive
- Other Industries
- By Geography
- Asia-Pacific
- China
- India
- Japan
- South Korea
- ASEAN Countries
- Australia and New Zealand
- Rest of Asia-Pacific
- North America
- United States
- Canada
- Mexico
- Europe
- Germany
- United Kingdom
- France
- Italy
- Spain
- Russia
- Rest of Europe
- South America
- Brazil
- Argentina
- Rest of South America
- Middle East and Africa
- Saudi Arabia
- United Arab Emirates
- South Africa
- Nigeria
- Rest of Africa
- Asia-Pacific
Data Sources, Market Sizing, and Validation
Desk Research
Desk work starts by building a clean fact base on industrial activity, workplace safety compliance, and spill control demand. We refer to public sources such as US EPA spill prevention guidance, OSHA workplace safety information, USGS materials data, UN Comtrade trade statistics, and selected peer-reviewed papers on sorbent materials and spill cleanup.
To translate this context into a usable model, we also scan company annual reports, investor presentations, and product catalogs to understand common product formats (pads, rolls, socks, booms, pillows, and granules) and typical end-use environments. Where required, we use paid subscriptions for company financials and intelligence, shipment-level import and export checks for geography coverage, and patent lookups to track material substitutions and new product launches. These desk sources are illustrative only, and many other public references are used for cross-checking, validation, and clarifying open questions.
Primary Interviews and Surveys
Primary work focuses on validating the demand pool, price points, and the practical buying cycle for absorbents across industries that handle liquids routinely. We speak with manufacturers, distributors, facility and EHS teams, and logistics partners across APAC, EMEA, and the Americas, so assumptions from desk research can be stress-tested, refined, and then aligned to how sites actually order and replenish.
Distribution of primary research fieldwork respondents
| Company type | Respondent position | Region |
|---|---|---|
| Top tier: 38% | CXOs: 15% | APAC: 46% |
| Mid tier: 43% | Functional/Unit leaders: 33% | EMEA: 31% |
| Smaller Players: 19% | Managers: 52% | Americas: 23% |
Market-Sizing & Forecasting
Sizing is built using a top-down demand pool approach where industrial activity and safety-driven usage are reconstructed by region, and then translated into absorbent consumption and spending. The model is anchored on end-use footprints and spill readiness needs, and it is adjusted by how absorbents are stocked and replenished at sites.
Key inputs include manufacturing output trends, the installed base of facilities with liquid-handling operations, the mix of oil-only versus universal versus chemical absorbents, average replenishment frequency by site type, and observed price ranges by product format and material type. Since published price lists are not always the paid price, the assumed ASP path is checked through channel feedback and stress-tested with sensitivity bands before totals are finalized.
Results are corroborated with selective bottom-up approximations, such as sampled supplier roll-ups and distributor channel checks, and simple volume times ASP builds for a few high-use industries. This helps flag gaps where coverage is incomplete. For forecasting, we use scenario analysis supported by a light multivariate regression overlay, where industrial production, regulatory enforcement intensity, and maintenance spending cycles act as explanatory signals, and then we align the outputs with what interviewees expect for purchasing behavior over the next few years.
Data Validation & Update Cycle
Validation is done through triangulation across independent signals so the final number is not driven by any one dataset. Analysts compare outputs against trade flows, facility and industry indicators, and observed product mix shifts, and then investigate outliers until the driver is understood and documented.
Before sign-off, assumptions and calculations go through multiple review steps. We re-contact sources when a variance is large, or when a market-related change affects pricing or availability. The report is refreshed on an annual cycle, with interim updates when material events occur, and a final pre-delivery pass is completed so clients receive the most current view.
Mordor Intelligence's Industrial Absorbent Market Sizing Compared With Other Published Estimates
Published market sizes for industrial absorbents can look inconsistent because the scope can shift in small but important ways, and each publisher may choose different base years and price assumptions. The spread usually comes from what is counted as an industrial absorbent sale, how end-use demand is tied to real industrial activity, and how quickly pricing and product-mix changes are refreshed.
Some estimates expand the definition by blending adjacent categories or by using broad end-use buckets that are not strictly industrial spill control, which can lift the number even if volumes are similar. Differences also show up when one model uses list prices without channel adjustments, applies a single global growth rate, or keeps currency conversion timing fixed even when raw material and freight cycles move. Those choices are treated more narrowly here, a modeling choice applied by Mordor Intelligence.
Benchmark comparison
| Source | Market Size | Gaps in Research Methodology |
|---|---|---|
| Mordor Intelligence | USD 4.35 B (2026) | |
| Global Consultancy A | USD 4.95 B (2024) | Uses an earlier base year and groups demand using broad end-use labels (including non-industrial buckets), which can increase totals even when industrial spill-response consumption is similar. |
| Industry Publisher B | USD 4.30 B (2024) | Relies heavily on stated revenue with limited adjustment for product-mix shifts and channel price realization, so value can run lower when synthetic-to-natural mix and pricing cycles change. |
Overall, the comparison shows that year selection and category inclusion are the main drivers behind the gap, followed by how pricing is translated from product lists to real transaction ranges. By keeping the demand pool tied to industrial liquid-handling activity and checking the assumed mix and ASP progression with field feedback, the final figure stays traceable to clear steps that can be repeated.
Key Questions Answered in the Report
What is current market size of Industrial Absorbent Market?
The Industrial Absorbent Market size was valued at USD 4.17 billion in 2025 and is estimated to grow from USD 4.35 billion in 2026 to USD 5.35 billion by 2031, at a CAGR of 4.21% during the forecast period (2026-2031).
Why are oil-only absorbents gaining traction?
Oil-only absorbents are gaining traction because they selectively absorb oil while repelling water, making them highly effective for industrial and marine spill response.
Which region will grow the fastest?
Asia-Pacific is expected to grow the fastest, accounting for 38.32% of 2025 revenue and expanding at a 5.78% CAGR through 2031.
How fragmented is supplier competition?
Supplier competition is moderately fragmented, with a mix of global manufacturers, regional suppliers, and specialized niche players.