
Market Overview
| Study Period | 2020 - 2031 |
|---|---|
| Forecast Data Period | 2026 - 2031 |
| Base Year Market Size (2025) | USD 71.80 Billion |
| Market Size (2026) | USD 76.55 Billion |
| Market Size (2031) | USD 105.5 Billion |
| Growth Rate (2026 - 2031) | 6.62 % |
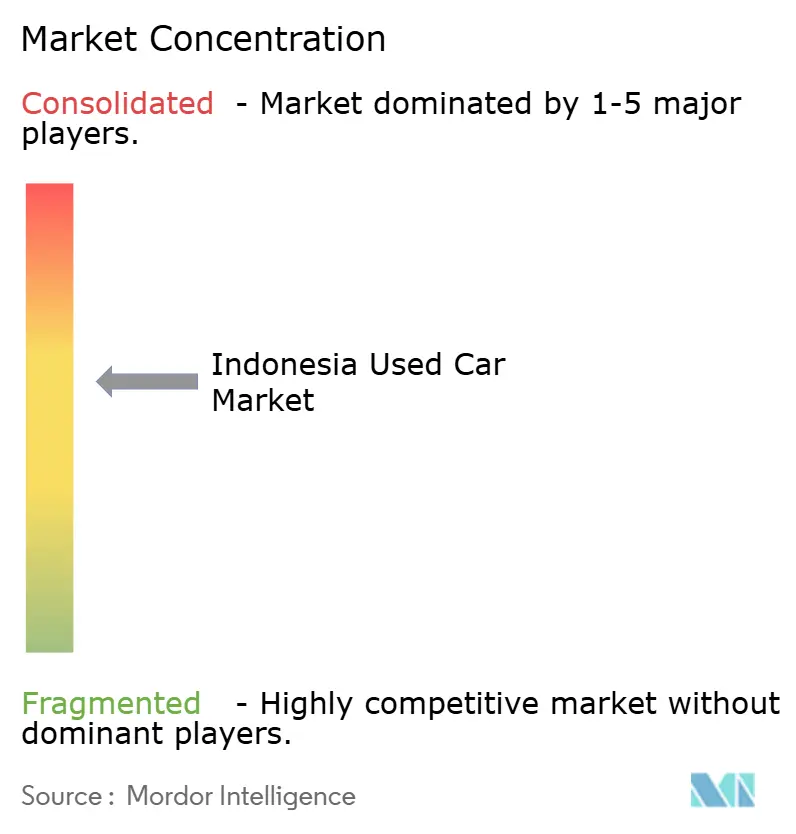
| Market Concentration | Medium |
Major Players *Disclaimer: Major Players sorted in no particular order Image © Mordor Intelligence. Reuse requires attribution under CC BY 4.0. | |
Indonesia Used Car Market Analysis by Mordor Intelligence
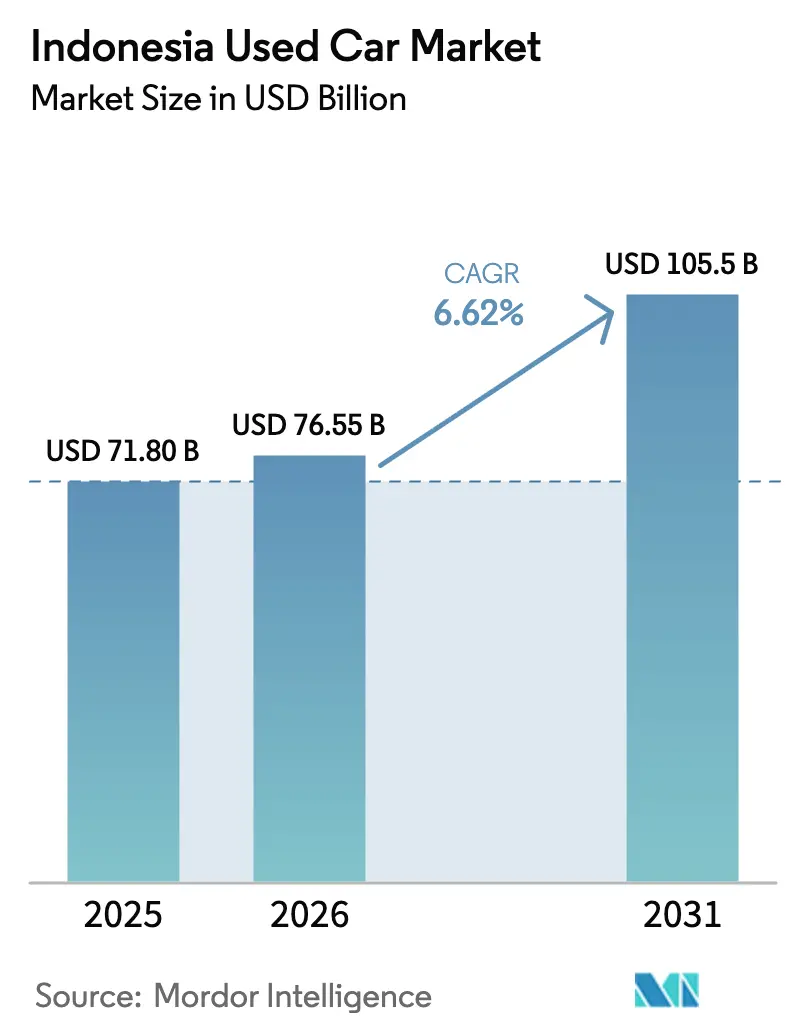
The Indonesia used car market size is expected to grow from USD 71.80 billion in 2025 to USD 76.55 billion in 2026 and is forecast to reach USD 105.5 billion by 2031 at 6.62% CAGR over 2026-2031. Demand resilience reflects a structural tilt toward pre-owned vehicles as tighter credit conditions and waning purchasing power push households to stretch budgets without postponing mobility goals. Used-car financing outpaced new-car loans for the first time in 2024, signalling a lasting recalibration of consumer behavior. Online classifieds now dominate discovery journeys, and emerging AI-grading tools narrow price dispersion by giving buyers objective condition scores. Financing pivots by major banks boost accessibility and margins, while ride-hailing fleet renewals inject a steady stream of high-quality cars into dealer inventories.
Key Report Takeaways
- By vehicle type, SUVs held 37.62% of the Indonesia used car market share in 2025, whereas MPVs are projected to expand at a 7.05% CAGR through 2031.
- By fuel type, petrol models accounted for 63.10% of the Indonesia used car market size in 2025; hybrid and electric vehicles are advancing at a 12.34% CAGR to 2031.
- By price segment, the USD 11,000-21,999 band captured 39.05% of the Indonesia used car market revenue in 2025 and is growing at a 7.33% CAGR through 2031.
- By sales channel, online digital classified portals accounted for 52.78% of the Indonesia used car market size in 2025; pure-play e-retailers are advancing at a 10.74% CAGR to 2031.
- By vendor type, unorganized dealers retained 66.20% of the Indonesia used car market size in 2025, but organized players are scaling faster with an 8.25% CAGR to 2031.
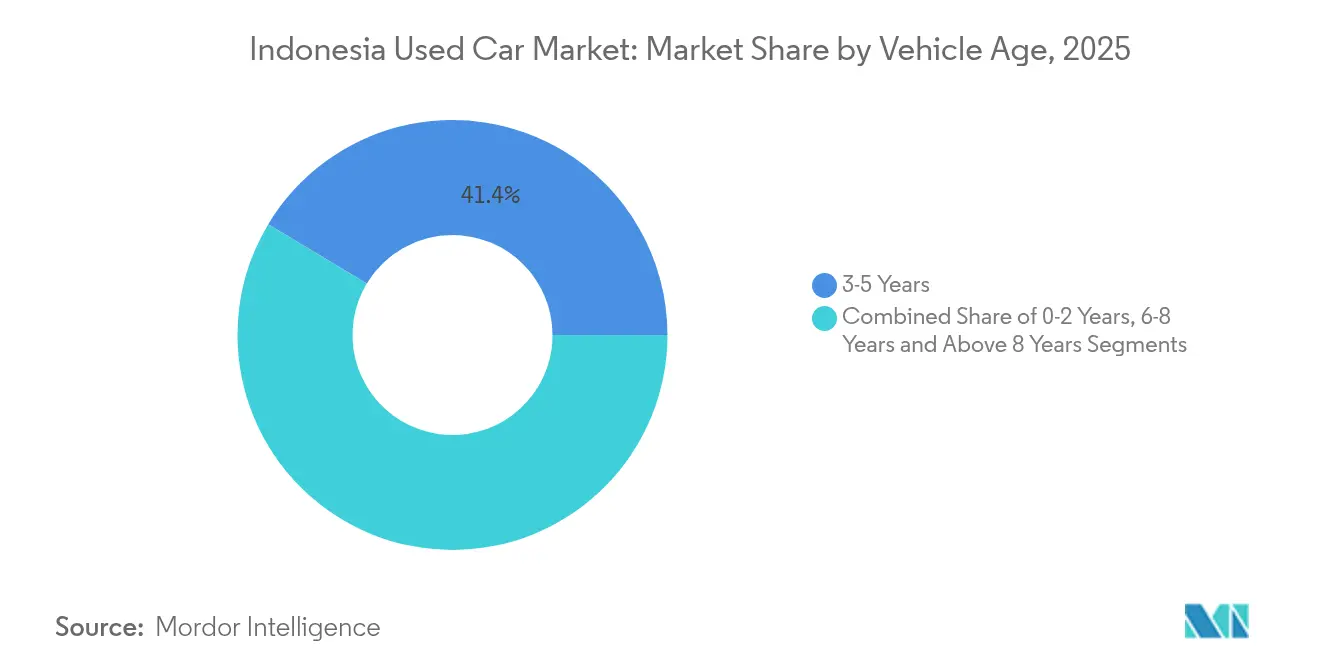
- By vehicle age, 3-5-year-old vehicles accounted for 41.38% share in 2025, whereas 0-2-year-old vehicles are projected to grow at a 7.74% CAGR to 2031.
- By financing providers, banks captured 75.40% of revenue in 2025 and is growing at a 7.19% CAGR.
- By geography, Jakarta commanded 33.20% of revenue in 2025, while North Sumatra is on track for the fastest 6.74% CAGR through 2031.
Note: Market size and forecast figures in this report are generated using Mordor Intelligence’s proprietary estimation framework, updated with the latest available data and insights as of 2026.
Indonesia Used Car Market Trends and Insights
Drivers Impact Analysis*
| Driver | (~) % Impact on CAGR Forecast | Geographic Relevance | Impact Timeline |
|---|---|---|---|
| Online Classified, E-retail Activity Grows | +1.8% | National; Java core with Sumatra spillover | Short term (≤ 2 years) |
| Banks' Pivot to Used-car Loans | +1.5% | Jakarta, West Java, East Java | Short term (≤ 2 years) |
| Organized Dealer Network Expansion | +1.2% | Sumatra, Kalimantan, Sulawesi | Medium term (2-4 years) |
| Ride-hailing Fleet Renewal Cycles | +0.9% | Urban centers | Medium term (2-4 years) |
| OEM Buy-back Schemes | +0.7% | National | Long term (≥ 4 years) |
| AI-led Condition Grading | +0.4% | Major cities | Long term (≥ 4 years) |
| Source: Mordor Intelligence | |||
Growing Online Classified and E-retail Activity
Digital portals empower consumers to compare prices, mileage, and photos, streamlining their transactions before reaching out to sellers. Platform operators integrate inspection, financing, and documentation, reducing search friction in secondary cities where dealer density is low. SEVA’s 17,500-unit throughput and IDR 8.2 trillion gross transaction value in 2024 validated the model, encouraging capital inflows and unicorn creation [1]. Traditional conglomerates have reacted: Astra’s OLX acquisition aligned captive financing, inspection centers, and logistics into a single stack. Regulatory support from OJK for in-platform digital lending completes a frictionless experience, propelling the Indonesian used car market toward deeper online penetration.
Banks’ Pivot to Used-car Specific Loan Products
Major banks such as BCA expanded vehicle loan books to IDR 65.3 trillion (USD 4.1 billion) in 2024, with used cars forming an increasing share as lenders chase higher yields [2]. Proprietary scorecards have evolved to incorporate a range of crucial factors, including mileage bands, detailed inspection grades, and projected resale values, moving beyond the traditional focus on borrower income. This innovative approach allows for instant pre-approval within online marketplaces, significantly reducing approval times to just a few hours. As a result, this streamlined process not only enhances conversion rates but also invigorates liquidity in the Indonesian used car market, creating dynamic opportunities for both buyers and sellers.
Expanding Organized Dealer Networks Outside Java
Organized dealers are moving into Sumatra, Kalimantan, and Sulawesi, taking with them standardized 150-point inspections and warranty offers that lift consumer trust [3]. Toyota-backed outlets illustrate how franchise scale can cut logistics costs and shorten inventory turns. Outer-island consumers, once limited to unorganized yards, now access reliable cars and financing, accelerating motorization where ownership ratios still trail Java. Improved roads and port upgrades lower unit transport costs, enhance margins, and reinforce the growth loop for the organized segment.
Ride-hailing Fleet Renewal Cycles (Grab and Gojek)
Three-year churn cycles release thousands of well-maintained units that carry full service histories, creating premium stock for certified programs. Gojek’s pledge to electrify 100% of its fleet by 2030 implies even larger disposals of gasoline cars mid-decade, bolstering supply in key urban hubs. Fleet cars’ documented upkeep lifts residuals, reducing depreciation shocks for second owners.
Restraints Impact Analysis*
| Restraint | (~) % Impact on CAGR Forecast | Geographic Relevance | Impact Timeline |
|---|---|---|---|
| Odometer and Accident-history Fraud | -1.1% | Nationwide; unorganized yards | Short term (≤ 2 years) |
| Fragmented Provincial Registration Databases | -0.8% | All provinces | Medium term (2-4 years) |
| High Inter-island Logistics Cost | -0.6% | Outer-island flows | Long term (≥ 4 years) |
| Limited Certified Battery Checks | -0.3% | Early EV clusters | Long term (≥ 4 years) |
| Source: Mordor Intelligence | |||
Odometer and Accident-history Fraud Remains Pervasive
Provincial STNK and BPKB systems operate in silos, letting bad actors reset mileage or hide flood damage when vehicles cross borders. First-time buyers and online shoppers bear the brunt, paying inflated prices for compromised cars. Trust deficits raise financing risk premiums, dampening the Indonesia used car market velocity until AI inspection and centralized data become mainstream.
Fragmented Provincial Registration Databases
Transfers between Indonesia’s 34 provinces demand serial paperwork and multiple fees, extending transaction cycles and opening graft windows. Dealers scaling nationally must master disparate rules, pushing overheads that unorganized sellers often circumvent. The administrative drag curbs inter-provincial trade, limiting demand pooling and sustaining regional price divergence.
*Our forecasts treat driver/restraint impacts as directional, not additive. The impact forecasts reflect baseline growth, mix effects, and variable interactions.
Segment Analysis
By Vehicle Type: SUVs Lead Despite MPV Momentum
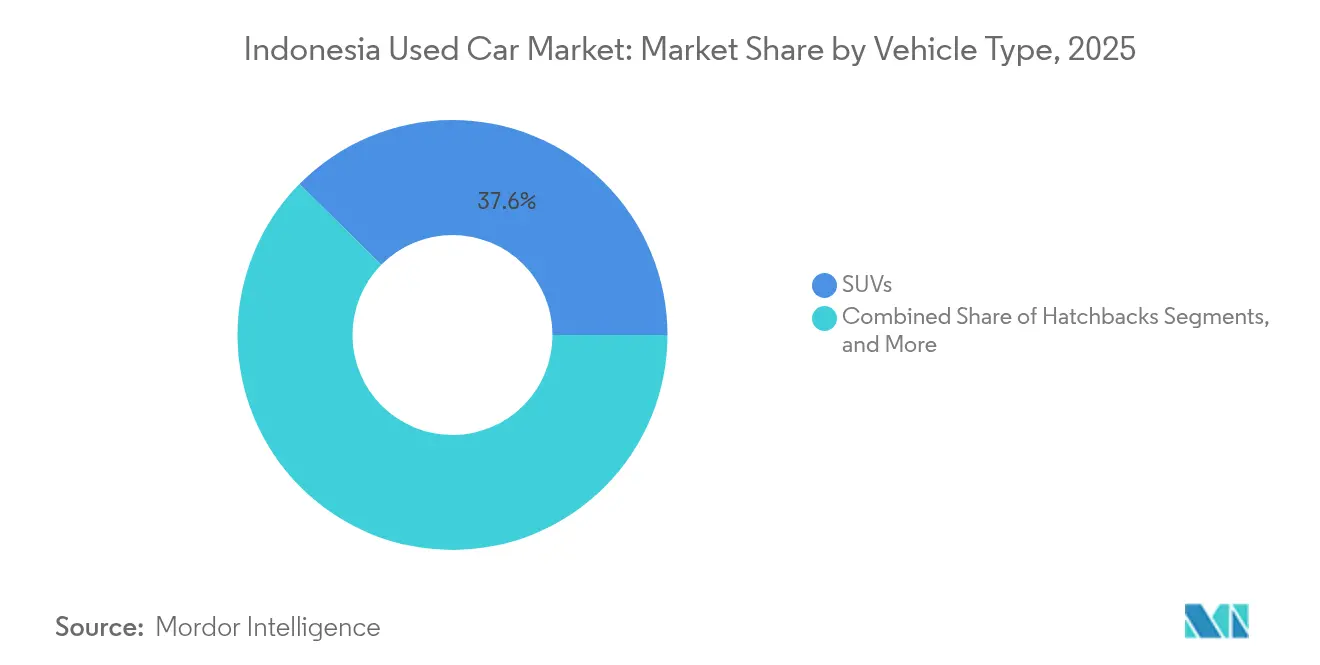
SUVs owned 37.62% of the Indonesia used car market share in 2025, buoyed by high ground clearance and perceived safety in congested streets. MPVs, climbing at 7.05% CAGR, appeal to multi-generational households that prize sliding doors and flexible seating. Sedans cater to commuters seeking fuel efficiency, and hatchbacks target first-time owners navigating tight parking norms. The Indonesia used car market size for SUVs is projected to keep pace with robust supply from fleet replacements, yet MPVs fetch quicker days-to-sale in suburban Java as school-run demand rises. Chinese OEMs have entered both segments with competitive hybrid trims, pushing Japanese incumbents to refresh line-ups more frequently.
New-energy SUVs feed aspirational buyers in Jakarta and Surabaya, while compact MPVs dominate outer-island lanes where road quality varies. Digital platforms algorithmically recommend SUVs to ride-hailing prospects and MPVs to growing families, increasing match efficiency. Certified programs overweight SUVs and MPVs because warranty upsells monetize better than sedans.

By Fuel Type: Petrol Dominance Faces Electric Disruption
Petrol models still command 63.10% of the Indonesia used car market size in 2025, yet hybrids and electric models exhibit a 12.34% CAGR, propelled by VAT cuts and zero luxury tax. The diesel share erodes amid rising subsidy talk and emissions scrutiny. The Indonesia used car market size for electric models remains small, but fast-charger rollouts and government roadmaps catalyze future secondary sales. Residual values of hybrids have outperformed petrol peers in Jakarta auctions by 6-8% since 2024, hinting at shifting buyer calculus.
Battery degradation uncertainty curbs wider uptake. Dealers hesitate to stock older BEVs without OEM testing. Banks apply shorter tenures and higher collateral haircuts for BEVs pending battery warranties. Petrol cars, however, keep liquidity advantages in rural exchanges where charging remains scarce.
By Price Segment: Mid-Range Vehicles Dominate Market
Units priced USD 11,000-21,999 held 39.05% of the Indonesia used car market revenue in 2025 and expanded at 7.33% CAGR, aligning with median household affordability and bank lending brackets. Entry models under USD 5,500 attract cash buyers in tier-3 cities, while premium brackets above USD 22,000 serve affluent urbanites eyeing luxury badges. The Indonesia used car market share of mid-range vehicles benefits from abundant trade-ins and certified programs bundling one-year warranties.
Online calculators showcasing installment scenarios boost mid-range visibility: a USD 15,000 Avanza with a 20% down payment and a 48-month tenor remains the most-searched combination on leading portals. Growth in premium slices rides on expatriate turnovers and corporate fleet disposals, but remains niche relative to value-centric core segments.
By Sales Channel: Digital Platforms Reshape Distribution
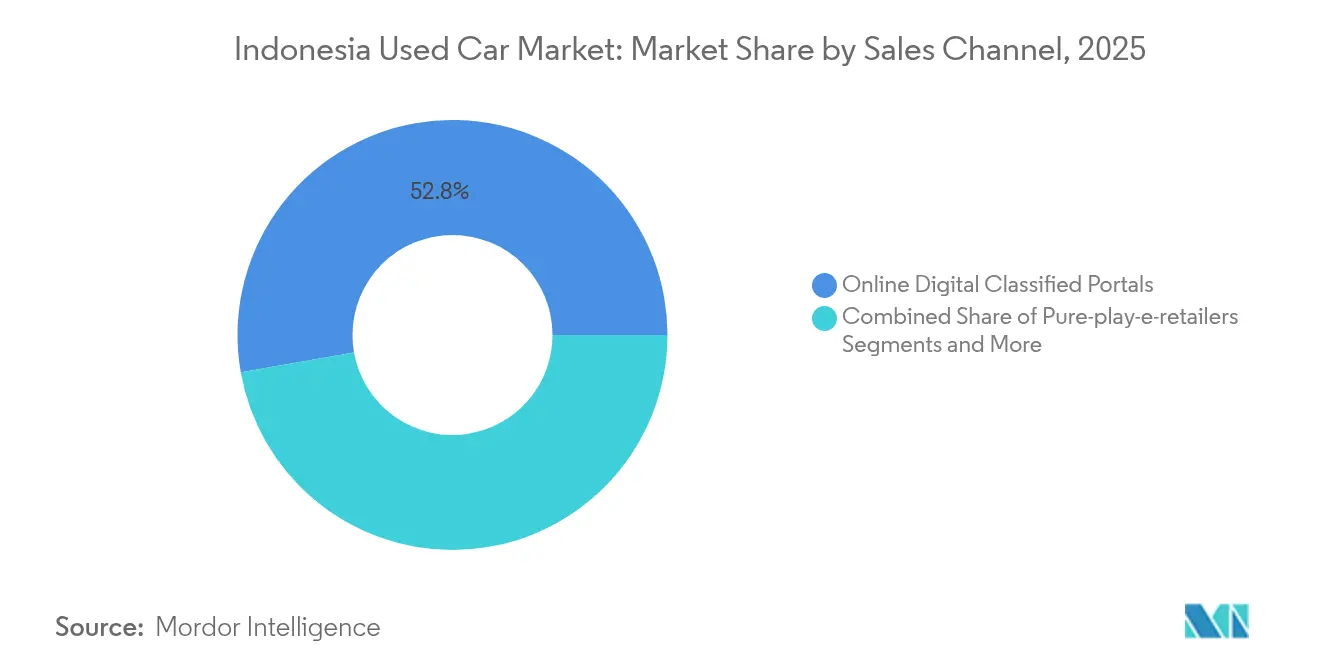
Digital classifieds captured 52.78% of the Indonesia used car market share in 2025, while pure-play e-retailers show the fastest 10.74% CAGR. Franchise dealers safeguard relationships via omnichannel models offering test drives at home, but independent lots rely on community ties and negotiable payment plans. Auction hybrids liquidate fleet turnovers rapidly, reinforcing wholesale price discovery. The Indonesian used car market size transacted online will keep expanding as lenders embed APIs for real-time credit scoring.
Modern physical showrooms are evolving into crucial last-mile fulfillment centers for vehicle buyers who have already narrowed down their choices online. Utilizing advanced geo-fencing technology, online platforms now allow potential buyers in Jakarta to access vehicle listings from depots located within a convenient 30-kilometer radius. This innovation significantly reduces the time and effort required for in-person inspections, enhancing the overall shopping experience and driving higher conversion rates for dealerships.
By Vendor Type: Organized Segment Gains Ground
Unorganized sellers still account for 66.20% of the Indonesia used car market revenue in 2025, yet organized channels grow at 8.25% CAGR with scale advantages in inspection, refurbishment, and financing tie-ups. For consumers, a three-day return policy and fixed-price transparency offset slight price premiums, driving repeat purchase intent. The Indonesia used car market size handled by organized dealers has tripled since 2019 as pandemic-era hygiene concerns nudged buyers toward professional outfits.
Institutional investors are increasingly drawn to asset-light online dealers that strategically outsource their refurbishment processes to partner workshops. This approach allows them to conserve capital, which can then be allocated towards robust marketing initiatives and maintaining an adequate inventory float. Additionally, franchise models provide small, family-owned dealerships with valuable branding opportunities and access to advanced technological platforms. This not only enhances their operational efficiency but also accelerates their journey towards formalization in a competitive marketplace.
By Vehicle Age: Prime Years Drive Demand
Models aged 3-5 years controlled 41.38% of the Indonesia used car market share in 2025 as buyers seek depreciation sweet spots with modern infotainment and safety tech. Nearly-new 0-2 year vehicles clock the fastest 7.74% CAGR, thanks to ride-hailing disposals and OEM buy-backs. The Indonesia used car market share for 6-8 year cars holds as cost-focused rural demand persists. Age dictates financing tenor caps: banks typically cap 0-2 year cars at 60 months, 3-5 year at 48 months, and 6-8 year at 36 months, shaping affordability outcomes.
Fleet-grade maintenance histories keep turnover swift in the 0-5 year bracket, while older stock faces lengthier lot times and higher reconditioning budgets. AI-based condition scoring helps older vehicles find price-appropriate buyers faster.
By Financing Providers: Banks Maintain Leadership
Banks possessed 75.40% of the Indonesia used car market share during 2025 and are projected to expand to a 7.19% CAGR by 2031, leveraging branch reach, low funding costs, and bundled insurance. NBFCs cherry-pick self-employed customers that banks view as higher risk but price loans 150-250 bps higher. OEM captives entice switchers with loyalty rebates and bundled maintenance. Indonesia's used car market size, financed via digital channels, surged after banks embedded instant approvals in marketplace apps.
Risk-based pricing aligns interest rates with inspection grades, incentivizing buyers to opt for certified vehicles. Delinquency ratios remain manageable at 1.9% versus 3.4% for new-car portfolios, underscoring improved collateral valuation algorithms.
Geography Analysis
Jakarta delivered 33.20% of the Indonesia used car market revenue in 2025, fueled by high per-capita income, dense dealer grids, and mature credit infrastructure. Average ticket values surpass national norms by 22% as buyers favor late-model SUVs. Competition compresses gross margins, spurring players to scout spillover demand into satellite cities like Depok and Tangerang.
West Java and East Java enjoy deep manufacturing linkages that create steady trade-in flows and ready access to service centers. Road and rail connectivity keeps logistics costs low, supporting brisk turnover. Central Java’s emerging industrial zones bolster middle-class formation, widening the customer base for value-oriented MPVs.
North Sumatra’s 6.74% CAGR to 2031 illustrates the archipelago’s diversification. Medan’s logistics hub status draws organized dealers building multi-brand superstores. Province-level incentives for digital startups streamline e-retail expansion, narrowing price gaps with Java. Other outer-island provinces like South Sulawesi and East Kalimantan grow from small bases as mining and plantation booms lift purchasing power, though high shipping costs still temper cross-island arbitrage.
Regulatory Landscape
Indonesia maintains a restrictive regime for used passenger-vehicle imports, with importation generally prohibited under the Ministry of Trade framework and only limited exceptions possible via specific permits and technical recommendations. The 2025 import-policy reset via Ministry of Trade Regulation (Permendag) No. 16 of 2025, effective 29 August 2025, replaced the prior framework (including Permendag 36/2023) and sits alongside Permendag 24 of 2025 governing imports of goods in non-new condition, reinforcing controls around what can enter the country as used goods.
On compliance and standards, the Badan Standardisasi Nasional (BSN) oversees Indonesian National Standards (SNI) that underpin vehicle eligibility for circulation, including safety and emissions requirements and specific SNI references used in the EV ecosystem (KBLBB), such as SNI 8872:2019 and SNI 8928:2023. Import permitting and customs workflows run through the Indonesia National Single Window (SINSW) for Surat Persetujuan Impor and clearance, and the updated reporting requirements under the 2025 framework place tighter discipline on post-clearance compliance reporting for parties using surveyor documentation.
Competitive Landscape
Competition is intensifying as incumbents and tech disruptors vie for a share in a market where unorganized lots still dominate volumes. Astra, leveraging its Toyota distributorship, now controls inspection centers, finance arms, and OLX’s digital reach, forging a closed ecosystem difficult to replicate. The Indonesia used car market rewards platforms that integrate credit, warranty, and logistics; hence, vertical consolidation is accelerating.
Specialists target pain points: Autopedia’s AI grading underpins financing risk models; logistics start-ups trial roll-on-roll-off aggregation to slash inter-island costs; and battery analytics firms prepare for looming second-life EV demand.
Foreign entrants such as CARS24 leverage global data pools to refine Indonesian residual curves, but must localize inspection to account for climate-induced corrosion and road conditions. Regulatory oversight by OJK supports fintech innovation yet compels greater consumer disclosure, raising compliance barriers for small dealers.
Indonesia Used Car Industry Leaders
-
OLX Indonesia
-
Toyota Astra Motor (Toyota Trust)
-
Carro Indonesia
-
Carsome Indonesia
-
Mobil88 (PT Serasi Auto Raya (SERA))
- *Disclaimer: Major Players sorted in no particular order
Market Opportunities and Future Outlook
The shift of shopping and transaction journeys onto digital platforms creates whitespace for end-to-end, compliance-forward used-car stacks that bundle inspection, financing, documentation, and logistics. Online-led commerce models are scaling, with online digital classified portals already accounting for 52.78% of transaction value in 2025, leaving room for organized players to win share by formalizing supply and reducing fraud risk.
A second opportunity sits at the intersection of certified programs, warranties, and financing, where banks already account for 75.40% of used-car financing revenue (2025) and are embedding faster approvals into marketplace flows. Policy and industry signals in 2026 also keep attention on affordability and domestic-industry priorities: GAIKINDO published a 2026 wholesale target of 850,000 new vehicles and reported 10.5% year-on-year retail sales growth to 433,848 units in H1 2026, while the Ministry of Industry stated in February 2026 that proposed automotive incentives were submitted to the Ministry of Finance and were not yet confirmed. With used-vehicle transaction VAT governed by MoF Regulation 65/PMK.03/2022 and import restrictions limiting used-vehicle inflows, the operating space centers on domestically sourced inventory, refurbishment capacity, and data-backed condition grading (including battery-health verification for used hybrids/EVs) to expand buyer trust and lender confidence.
Recent Industry Developments
- July 2026: OLXmobbi was named the Official Trade-in Partner for GAIKINDO Indonesia International Auto Show (GIIAS) 2026 (July 30 to August 9, 2026). The partnership positions OLX deeper in the transaction funnel by capturing trade-in supply at a major new-car event, supporting inventory replenishment and cross-selling of financing and inspections.
- May 2026: PT Toyota Astra Motor reiterated the Toyota Trust certified used-car program with structured warranty offerings (Prime and Prime Extra) covering vehicles up to eight years or 150,000 km. The standardized warranty framing strengthens organized, certified competition versus unorganized lots by reducing perceived risk and improving financing eligibility for qualified stock.
- December 2024: Carro received a strategic investment from Woori Venture Partners to support expansion plans in Indonesia. The capital backing adds firepower for scaling inspection, refurbishment, and distribution capabilities, intensifying competition among organized and digital-first used-car operators.
Research Methodology Framework and Report Scope
Market Definition and Coverage
For this study, the Indonesia used car market is defined as the total value generated from buying, selling, and trading pre-owned passenger vehicles within Indonesia across organized and semi-organized channels.
Scope exclusions: This sizing excludes two-wheelers, heavy commercial vehicles, and parts or repair services that are sold separately from the used-car transaction.
Segmentation Overview
- By Vehicle Type
- Hatchbacks
- Sedans
- SUVs
- MPVs
- By Fuel Type
- Petrol
- Diesel
- Hybrid and Electric
- Others (LPG, CNG, etc.)
- By Price Segment
- Below USD 5,500
- USD 5,500 – 10,999
- USD 11,000 – 21,999
- ≥ USD 22,000
- By Sales Channel
- Online Digital Classified Portals
- Pure-play e-Retailers
- Dealer/OEM Online Platforms
- Physical Franchise Dealerships
- Independent Used-Car Lots
- Auction Houses (Physical and Online Hybrid)
- Peer-to-Peer (Private) Sales
- By Vendor Type
- Organized
- Unorganized
- By Vehicle Age
- 0 – 2 Years
- 3 – 5 Years
- 6 – 8 Years
- Above 8 Years
- By Financing Providers
- Original Equipment Manufacturers (OEMs)
- Banks
- Non-Banking Financial Companies
- By Province
- West Java
- East Java
- Central Java
- North Sumatra
- Banten
- Jakarta
- Other Provinces
Data Sources, Market Sizing, and Validation
Desk Research
Desk research was used to set the market frame, align definitions, and collect the base indicators that anchor the model. We relied on public sources such as Statistics Indonesia (BPS) for macro and household indicators, Bank Indonesia for interest rate and credit signals, OJK for finance market direction, and the Ministry of Transportation for vehicle administration context. We also reviewed selective trade and customs releases, plus university and peer-reviewed papers on vehicle ownership and turnover patterns.
To connect the market to actual transaction activity, we cross-checked listed company filings, investor presentations, and credible press coverage that reports on used-car demand, financing appetite, and dealer expansion. In addition, we used paid subscriptions for company financials and intelligence, plus news and financials screening, to keep revenue mixes and channel developments current through the year. The sources listed here are illustrative, and other public and paid references were also used for data collection, validation, and clarification.
Primary Interviews and Surveys
Primary work was done to confirm how prices move by vehicle type, how fast inventory turns, and how financing availability changes actual buying behavior. We spoke with a balanced set of respondents such as multi-brand dealers, OEM-authorized used programs, online-led marketplaces, lenders, and independent channel participants across major provinces, and then used that input to fill data gaps and test assumptions that could not be fully validated through public sources alone.
Distribution of primary research fieldwork respondents
| Company type | Respondent position |
|---|---|
| Top tier: 25% | CXOs: 16% |
| Mid tier: 59% | Functional/Unit leaders: 34% |
| Smaller Players: 16% | Managers: 50% |
Market-Sizing & Forecasting
The core sizing is built using a top-down approach where the national used-car demand pool is reconstructed through vehicle parc and replacement cycles, and then translated into value using observed pricing by category. We then corroborate totals with selective bottom-up checks, such as sampled listings and dealer throughput, plus ASP x volume validations by vehicle type and booking channel, so that outliers can be corrected before the final number is locked.
Inputs that materially shape the model include used-vehicle transaction velocity, average selling prices by hatchback, sedan, SUV, and MPV, finance penetration split across banks and non-banking financial companies, and channel mix across online, OEM authorized, and multi-brand dealerships. Province-level indicators, including population concentration and vehicle ownership intensity, are used to keep the distribution realistic, since demand is not spread evenly across Indonesia. When bottom-up visibility is weak for smaller provinces or informal sellers, we scale from better-tracked provinces using consistent ownership and affordability signals, and then validate the split in interviews.
For forecasting, scenario analysis is used to translate macro and credit paths into transaction and price outcomes, and it is supported by time-series smoothing on stable inputs like parc growth and replacement timing. Assumptions on finance availability, price appreciation, and channel shift are reviewed with primary respondents so the forecast stays tied to what sellers and lenders see in their pipelines.
Data Validation & Update Cycle
Validation is done by triangulating the model outputs against independent signals such as vehicle ownership trends, financing growth, and visible shifts in used-car supply from repossessions or trade-ins. If a segment shows an unusual jump, the underlying inputs are rechecked, the calculations are rerun, and respondents are re-contacted when there is no practical explanation from public information. A separate analyst review is completed before sign-off so that formula errors, currency timing issues, and inconsistent segment splits are caught early.
The report is refreshed annually, and interim updates are made when material events change financing conditions, pricing, or channel behavior. Before delivery, we do a final pass to ensure the market size and narrative reflect the latest available disclosures and confirmed market signals.
Mordor Intelligence's Indonesia Used Car Market Size Compared Against Other Published Estimates
Published market values for Indonesia used cars can look far apart because studies do not always count the same transaction types, and they also apply different rules for pricing and financing-driven demand. Differences become more visible when one estimate treats the market as a broad mobility resale economy, and another keeps it focused on passenger used-car transactions.
Some external numbers are built with wider coverage, such as mixing used cars with other used vehicles, or treating listing prices as completed sales values. In the Mordor Intelligence approach, only pre-owned passenger vehicles traded in Indonesia are counted, and value is tied to realized selling prices that are checked by vehicle type, channel, and province before forecasting is applied.
Benchmark comparison
| Source | Market Size | Gaps in Research Methodology |
|---|---|---|
| Mordor Intelligence | USD 71.80 B (2025) | |
| Industry Report A | USD 57.00 B (2024) | Uses a different base year and appears to apply a narrower counted pool that leans toward selected used-vehicle categories and newer age bands, which can reduce total transaction value versus an all passenger used-car view. |
| Trade Journal B | USD 82.00 B (2025) | Likely reflects a broader definition that can blend advertised listing values or adjacent resale activity into the total, and it is typically less explicit on how province mix, channel mix, and realized pricing were validated. |
The spread in the table is mainly explained by what is included in the transaction pool and how price is treated, since used-car value changes quickly with financing conditions and supply mix. By keeping the inputs traceable to clear levers such as vehicle type pricing, finance penetration, and province splits, the final estimate stays repeatable and easier to reconcile with observed market behavior over time.
Key Questions Answered in the Report
What is the projected value of Indonesia’s used-car trade in 2031?
The Indonesia used car market size is expected to reach USD 105.5 billion by 2031.
How fast is the organized dealer segment growing?
Organized vendors are expanding at an 8.25% CAGR, outpacing unorganized lots.
Which vehicle types are gaining the most traction among Indonesian buyers?
SUVs lead by share at 37.62% in 2025, while MPVs post the fastest 7.05% CAGR due to family-centric demand.
Why are banks focusing more on pre-owned car financing?
Used-car loans offer higher margins and now account for 75.40% of financed transactions, supported by refined risk models.