Market Overview
| Study Period | 2020 - 2031 |
|---|---|
| Base Year For Estimation | 2025 |
| Forecast Data Period | 2026 - 2031 |
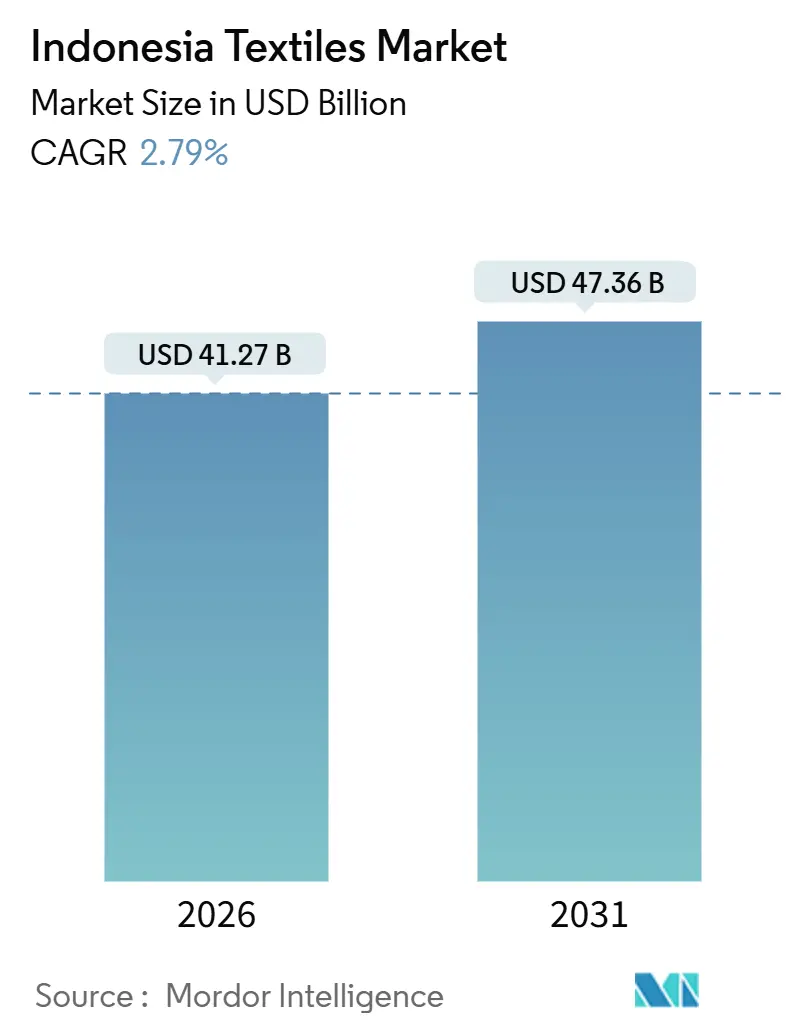
| Market Size (2026) | USD 41.27 Billion |
| Market Size (2031) | USD 47.36 Billion |
| Growth Rate (2026 - 2031) | 2.79% CAGR |
| Market Concentration | Low |
Major Players *Disclaimer: Major Players sorted in no particular order Image © Mordor Intelligence. Reuse requires attribution under CC BY 4.0. | |
Indonesia Textiles Market Analysis by Mordor Intelligence
The Indonesia Textiles Market size is estimated at USD 41.27 billion in 2026, and is expected to reach USD 47.36 billion by 2031, at a CAGR of 2.79% during the forecast period (2026-2031). Currency depreciation, higher wages, and low-cost imports weigh on margins, yet government machinery subsidies, expanding e-commerce, and new trade accords provide countervailing tailwinds. A shift toward recycled polyester, stricter environmental rules, and tariff-free access to Australia and the European Union are prompting mills to modernize equipment and process controls. Integrated producers that can document sustainable sourcing and track inputs end-to-end are moving upstream into technical fabrics, while smaller converters focus on rapid-turn, short-run fashion orders for domestic platforms. Collectively, these trends signal a controlled transition away from commodity yarns toward higher-value applications that better absorb rising costs.
Key Report Takeaways
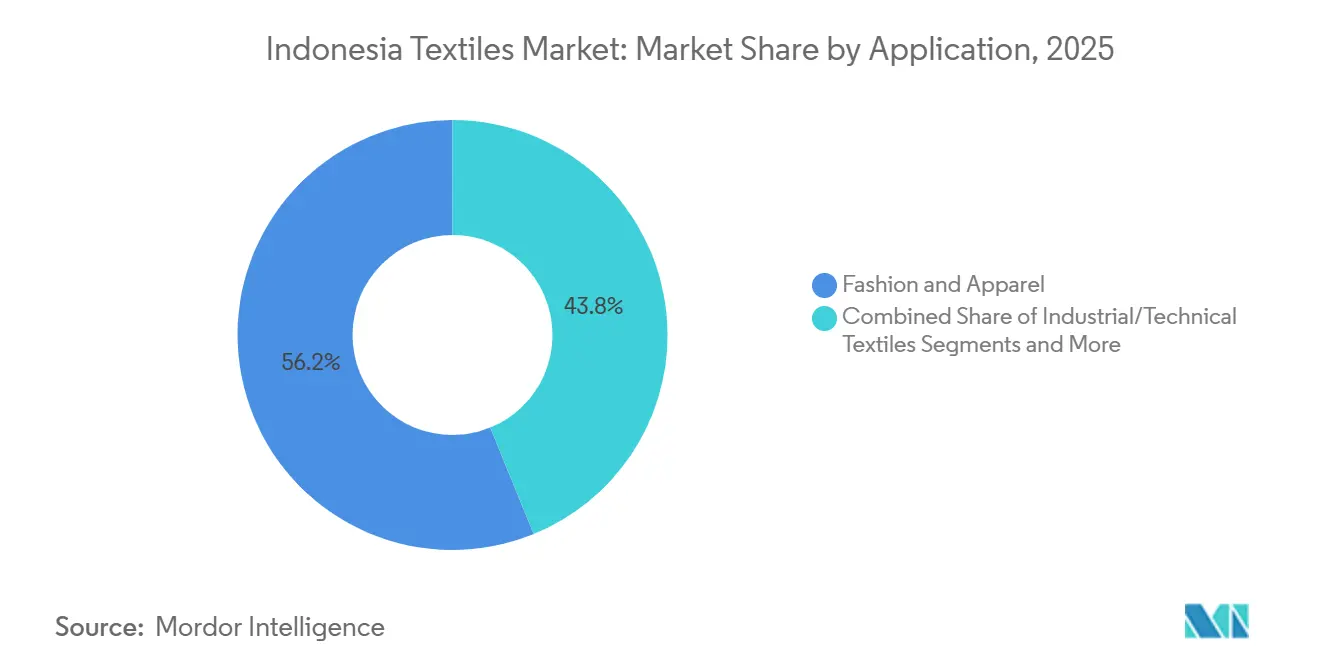
- By application, fashion and apparel captured 56.16% of Indonesia's textile market share in 2025, whereas industrial and technical textiles are advancing at a 4.12% CAGR to 2031.
- By raw material, synthetic fibers commanded 43.96% of Indonesia's textile market size in 2025, and polyester is expanding at a 4.51% CAGR through 2031.
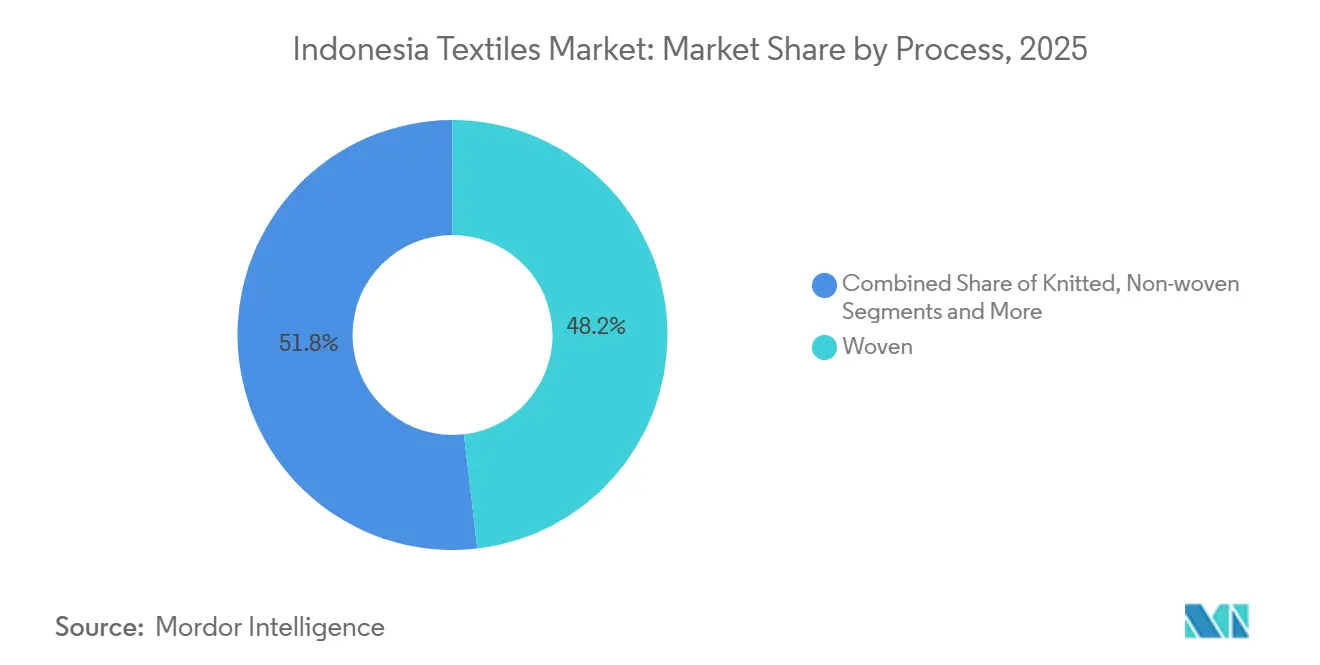
- By process, woven fabrics held 48.16% of Indonesia's textile market share in 2025; non-woven technologies are growing at a 4.05% CAGR over the same period.
- By geography, Java accounted for 58.37% of the market value in 2025, while the Rest of Indonesia is forecast to grow at a 3.71% CAGR to 2031.
Note: Market size and forecast figures in this report are generated using Mordor Intelligence’s proprietary estimation framework, updated with the latest available data and insights as of January 2026.
Indonesia Textiles Market Trends and Insights
Drivers Impact Analysis
| Driver | (~) % Impact on CAGR Forecast | Geographic Relevance | Impact Timeline |
|---|---|---|---|
| Middle-class fashion e-commerce boom | +0.4% | Nationwide, led by urban Java and Sumatra | Short term (≤ 2 years) |
| Machine-modernization subsidies under Making Indonesia 4.0 | +0.3% | Central & West Java, Banten textile clusters | Medium term (2-4 years) |
| Preferential tariffs from IA-CEPA and future CPTPP | +0.3% | Export-oriented mills in Java, Banten, Batam SEZ | Long term (≥ 4 years) |
| Brand mandates for recycled fiber content | +0.2% | Java integrated mills, Sumatra viscose producers | Medium term (2-4 years) |
| Source: Mordor Intelligence | |||
Middle-Class Fashion E-Commerce Boom Lifting Domestic Yarn & Fabric Orders
Indonesia’s fashion category led all online retail in 2024, and live-video commerce captured roughly one-quarter of gross merchandise value. Domestic converters that can deliver 500 to 2,000 meter lots within 10 days now receive rolling orders from direct-to-consumer labels on major platforms. Payment cycles shorten, improving cash flow, but order fragmentation raises planning complexity. The October 2024 removal of unregistered foreign sellers reduced price undercutting, yet parcel-level imports continue through other channels. On balance, steady urban disposable-income growth keeps online fashion a bright spot for polyester-cotton prints and dyed knits[1]Ministry of Trade, “E-Commerce Market Monitoring Report 2024,” kemendag.go.id.
Acceleration of Machine-Modernization Subsidies Under Making Indonesia 4.0
Jakarta’s IDR 20 billion program reimburses up to 25% of qualified textile equipment purchases, directly targeting the 57% of looms and spindles that are more than 15 years old. Early adopters—mainly mid-sized spinners in West and Central Java- pair the rebate with bank loans to upgrade to air-jet looms and compact-spinning lines. Domestic machine builders secure a captive market through the local-content clause, although high-precision gear still arrives from Germany and Japan on the lower 10% rebate tier. Mills must show operating profitability and valid environmental permits, conditions that exclude distressed firms most in need of upgrades. Over the medium term, the scheme is expected to lift run speeds and lower defect rates, modestly improving export competitiveness[2]Ministry of Industry, “Machinery Revitalization Scheme Guidelines 2025,” kemperin.go.id.
Preferential Tariffs From IA-CEPA and Prospective CPTPP Entry Expanding Export Margins
Under IA-CEPA, Indonesian yarn and fabrics enter Australia at zero or near-zero duty, with flexible yarn-forward rules supporting global fiber sourcing. The EU-Indonesia CEPA finalized in 2025 will phase out textile tariffs over seven years, contingent on labor and environmental compliance. Jakarta’s pending CPTPP accession would open the Canada, Japan, and Mexico markets, where Indonesian goods still face MFN tariffs. Together, the accords could raise average export margins by 2–4% points for mills capable of meeting origin and traceability documentation.
Brand Mandates for Recycled-Fiber Content Sparking PET-to-Yarn & Viscose-Recycling Investments
Global sportswear and fast-fashion buyers now demand 20–50% recycled content, prompting Indonesian fiber majors to scale bottle-to-polyester lines and closed-loop viscose. PT Indorama Polypet is piloting chemical recycling that depolymerizes post-consumer PET, while Asia Pacific Rayon markets viscose produced with renewable energy. Mechanical recycling remains limited by fiber-strength loss, yet chemical processes require USD 50–100 million per line and consistent feedstock, challenges partly offset by large buyers’ willingness to sign multi-year offtake contracts. The absence of national extended producer responsibility legislation still constrains raw material supply
Restraints Impact Analysis
| Restraint | ( ~ ) % Impact on CAGR Forecast | Geographic Relevance | |
|---|---|---|---|
| Weakening rupiah raising raw-material costs | -0.5% | All import-dependent spinners and fiber makers | Short term (≤ 2 years) |
| 2025 minimum-wage hikes in textile provinces | -0.4% | Central & West Java, Banten, North Sumatra | Medium term (2-4 years) |
| Low-value parcel imports flooding the market | -0.4% | Nationwide, acute for SME garment makers | Short term (≤ 2 years) |
| Tighter water-use permits in dyeing hubs | -0.2% | Solo, Pekalongan, Semarang | Medium term (2-4 years) |
| Source: Mordor Intelligence | |||
Weakening Rupiah Amplifying Cotton & Synthetic-Feedstock Import Costs
The rupiah fell beyond IDR 16,500 per USD by March 2025, intensifying the landed prices of imported cotton and polyester staple fiber that cover over 95% of spinning needs. Spinners operating at just 40–50% utilization lack the working capital to hedge or bulk-buy, eroding already thin margins. Although a cheaper currency theoretically aids exports, simultaneous 6.5% wage hikes nullify much of the benefit. The overall effect is a direct squeeze on cash-constrained mills[3]USDA Foreign Agricultural Service, “Indonesia Cotton and Products Update 2025,” fas.usda.gov.
Sharp Hikes in 2025 Provincial Minimum Wages Narrowing Advantage Versus Vietnam & Bangladesh
Regulation 16/2024 lifted 2025 minimum wages by 6.5% in key textile provinces, pushing Central Java pay to about USD 122 per month. This reduces Indonesia’s labor-cost gap against Vietnam, where improved logistics already offset higher wages, and keeps the country above Bangladesh’s USD 95. Large exporters shoulder the increase; smaller cut-make-trim shops face thinner spreads and higher turnover, complicating order fulfillment
Segment Analysis
By Application: Fashion Leads While Technical Textiles Accelerate
Fashion and apparel controlled a dominant 56.16% share of Indonesia textiles market size in 2025, reflecting the archipelago’s deep garment-making base. Yet margin compression and import competition have slowed its growth to low single digits. Industrial and technical textiles, though smaller, are the fastest-growing niche at a 4.12% CAGR, propelled by demand for filtration media, medical disposables, and automotive upholstery. Several OEMs now insist on local sourcing to meet domestic-content rules, opening avenues for mills able to certify flame retardancy, tensile strength, and traceability. Government incentives for hospital construction similarly expand orders for gowns and drapes, supporting capacity investments in non-woven spunbond and meltblown lines. Over the forecast horizon, technical fabrics are expected to capture incremental share as buyers seek specification-driven suppliers and as fashion volumes plateau.
A more balanced application mix also cushions the Indonesian textiles market against fashion-cycle volatility. Mills entering automotive and geotextile supply chains must adopt rigorous quality systems and often partner with global licensors for proprietary yarns or coatings. While only a handful of domestic plants presently meet airbag or seat-belt specifications, early movers report higher margins and longer contracts than basic fashion programs. The shift requires sustained R&D spending and closer collaboration with end users, but it offers a viable path to offset rising wages and tougher environmental standards.
Note: Segment shares of all individual segments available upon report purchase
Get Detailed Market Forecasts at the Most Granular Levels
Download PDF
By Raw Material: Synthetic Fiber Dominance, Polyester Momentum
Synthetic fibers secured 43.96% of Indonesia textiles market share in 2025, with polyester the standout, projected to grow at a 4.51% CAGR up to 2031. Brand-level recycled-content mandates and polyester’s cost edge over cotton underpin this momentum. Domestic PET-to-fiber projects by PT Indorama and others will eventually reduce reliance on imported recycled chips, but feedstock collection remains informal. Cotton, long favored for premium Shirting and denim, faces currency-driven cost swings and a smaller discretionary-income pool, keeping its share under pressure. Viscose from Asia Pacific Rayon is gaining traction in athleisure and home textiles where biodegradable claims resonate with EU buyers. Nylons and other engineering synthetics remain niche but carry attractive margins in tire cords and fishing gear, markets still served predominantly by imports.
Greater synthetic penetration also changes process choices: knitters use polyester-rich blends for stretch jerseys, while non-woven producers prefer polypropylene and polyester webs for hygiene applications. As sustainability auditing spreads, life-cycle analysis increasingly dictates fiber choice. Mills that can provide verifiable chain-of-custody documentation, whether for recycled polyester or responsibly sourced viscose, are likely to win share from commodity cotton spinners tethered to volatile global prices.
By Process: Woven Fabric Scale, Non-Woven Upside
Woven fabrics commanded 48.16% of Indonesia textiles market share in 2025, anchored by apparel-grade shirtings and home-textile jacquards produced on large air-jet fleets. Yet non-woven output is rising at a 4.05% CAGR as diaper, wipe, and medical-mask makers scale capacity. Spunbond lines commissioned since 2023 have rapidly filled previously import-dominated hygiene substrates, giving local roll-goods suppliers a growing captive client base. Knits still serve fast-turn fashion, but commodity jerseys face import penetration from China and Vietnam.
Capital intensity remains the key hurdle in shifting the process mix. A high-speed spunbond line costs USD 10–15 million, while a set of advanced rapier looms requires far less investment per kilogram of output. Nevertheless, the labor-light, specification-heavy nature of non-wovens appeals to investors seeking margin stability and export scalability. Mills adopting inline optical inspection and lamination units position themselves for future demand in composite geotextiles and medical barrier fabrics, underpinning the segment’s long-run growth trajectory.
Note: Segment shares of all individual segments available upon report purchase
Get Detailed Market Forecasts at the Most Granular Levels
Download PDF
Geography Analysis
Java generated 58.37% of Indonesia's textile market value in 2025, supported by dense supply chains, skilled labor, and proximity to Tanjung Priok and Tanjung Perak ports. Yet tighter effluent rules and wage growth are nudging some expansion toward lower-cost zones. Sumatra follows, buoyed by Asia Pacific Rayon’s renewable-energy viscose complex and by emergent garment clusters around Medan that feed domestic retailers. Infrastructure gaps and higher trucking costs still limit Sumatra’s scale compared with Java, but new toll roads and ferry links are gradually reducing logistical drag.
Outside the traditional belt, the Rest of Indonesia, including Sulawesi, Kalimantan, and eastern provinces are projected to log the fastest 3.71% CAGR to 2031. Government outlays on ports, power, and special economic zones encourage investors to diversify capacity, especially in non-water-intensive processes like spunbond and knitting. Tourism-rich Bali sustains artisan batik and hand-woven niches that benefit from rising inbound travel and export-handicraft demand. However, talent shortages and limited upstream suppliers mean most large mills still favor Java for complex operations, using satellite units elsewhere for finishing or assembly.
Archipelagic geography forces a hub-and-spoke model: raw fiber and chemicals land at Java ports, move to integrated complexes for spinning or polymerization, and then ship finished yarn or fabric to outer-island garment plants near their end markets. Policy makers aim to shorten these loops through localized upstream investment, but current economics continue to favor Java’s clustering advantages.
Competitive Landscape
Indonesia’s textiles sector is moderately fragmented: the top 10 public producers account for roughly 30% of revenue, leaving thousands of small and medium enterprises to serve niche and domestic channels. Vertically integrated groups leverage scale and captive power to absorb currency and wage shocks, while SMEs remain vulnerable to demand swings and import competition. Trade-linked currency risk prompted several mid-tier spinners to merge or halt operations after 2023, accelerating informal consolidation.
Sustainability credentials are now a prerequisite for export growth. PT Pan Brothers and PT Asia Pacific Fibers have each published Science-Based Targets or equivalent disclosures, unlocking preferential sourcing from global sportswear brands eager to meet Scope 3 emissions goals. Fiber makers investing in bottle-to-yarn recycling and rooftop solar arrays signal similar alignment with buyer expectations, often supported by green-loan facilities from state banks.
Technical-textile white spaces draw both new entrants and incumbents seeking higher margins. Domestic pioneers in automotive interiors and filtration media are securing multi-year contracts with regional OEMs, but capacity remains insufficient to displace the 40% import share in these categories. Meanwhile, digital printers and micro-knitters serving e-commerce brands illustrate how technology enables rapid-design cycles without massive scale, offering an alternative growth path for agile SMEs willing to embrace on-demand production.
Indonesia Textiles Industry Leaders
PT Sri Rejeki Isman Tbk
PT Pan Brothers Tbk
PT Asia Pacific Fibers Tbk
PT Trisula Textile Industries Tbk
PT Indo-Rama Synthetics Tbk
- *Disclaimer: Major Players sorted in no particular order
Need More Details on Market Players and Competitors?
Download PDF
Recent Industry Developments
- October 2025: PT Sri Rejeki Isman filed for bankruptcy with USD 1.3 billion in debt, removing a major integrated supplier and affecting 20,000+ workers
- October 2025: The Ministry of Trade banned the Temu platform for lacking a registered intermediary, part of wider efforts to curb ultra-low-cost parcel imports
- September 2024: Regulation 12/2025 tightened dyehouse effluent limits by up to 30% and introduced quarterly disclosure
- September 2024: The EU-Indonesia CEPA concluded, setting a seven-year tariff phase-out for textiles conditioned on sustainability compliance
Indonesia Textiles Market Report Scope
Any substance made of woven threads is a textile. It has numerous uses and many different forms. Textiles are a part of everyone's surroundings or circumstances. Textiles are used in various products, including clothes, furniture, bedding, carpeting, and even automotive parts.
The Indonesian textiles market is segmented by application (fashion & apparel, industrial/technical, household & home, medical & healthcare, automotive & transport, others), raw material (natural fibers, synthetic fibers, recycled fibers, others), process (woven, knitted, non-woven), and geography (Java, Sumatra, Kalimantan, Sulawesi, Rest of Indonesia). Market Forecasts are Provided in Terms of Value (USD).
By Application
| Fashion & Apparel |
| Industrial/Technical Textiles |
| Household & Home Textiles |
| Medical & Healthcare Textiles |
| Automotive & Transport Textiles |
| Others (Protective, Sports Textiles, etc.) |
By Raw Material
| Natural Fibers | Cotton |
| Wool | |
| Silk | |
| Synthetic Fibers | Polyester |
| Nylon | |
| Rayon / Viscose | |
| Acrylic | |
| Polypropylene | |
| Recycled Fibers | |
| Others (Speciality High-Performance Fibers (Aramid, Carbon, UHMWPE)) |
By Process / Technology
| Woven | |
| Knitted | |
| Non-woven | Spunlaid (Spunbond / Melt-blown) |
| Dry-laid Hydro-entangled | |
| Wet-Laid | |
| Needle-punched | |
| 3-D Weaving & Spacer Fabrics |
By Region
| Java |
| Sumatra |
| Kalimantan |
| Sulawesi |
| Rest of Indonesia |
| By Application | Fashion & Apparel | |
| Industrial/Technical Textiles | ||
| Household & Home Textiles | ||
| Medical & Healthcare Textiles | ||
| Automotive & Transport Textiles | ||
| Others (Protective, Sports Textiles, etc.) | ||
| By Raw Material | Natural Fibers | Cotton |
| Wool | ||
| Silk | ||
| Synthetic Fibers | Polyester | |
| Nylon | ||
| Rayon / Viscose | ||
| Acrylic | ||
| Polypropylene | ||
| Recycled Fibers | ||
| Others (Speciality High-Performance Fibers (Aramid, Carbon, UHMWPE)) | ||
| By Process / Technology | Woven | |
| Knitted | ||
| Non-woven | Spunlaid (Spunbond / Melt-blown) | |
| Dry-laid Hydro-entangled | ||
| Wet-Laid | ||
| Needle-punched | ||
| 3-D Weaving & Spacer Fabrics | ||
| By Region | Java | |
| Sumatra | ||
| Kalimantan | ||
| Sulawesi | ||
| Rest of Indonesia | ||
Need A Different Region or Segment?
Customize Now
Key Questions Answered in the Report
How large is the Indonesia textiles market in 2026 and how fast will it grow?
It reached USD 41.27 billion in 2026 and is forecast to expand to USD 47.36 billion by 2031, delivering a 2.79% CAGR.
Which application currently dominates volumes?
Fashion and apparel held 56.16% of 2025 value, remaining the single-largest use of yarns and fabrics.
Which raw material is growing the fastest through 2031?
Polyester, within the synthetic-fiber group, is projected to rise at a 4.51% CAGR on the back of recycled-content mandates.
Why are non-woven textiles gaining share?
Diaper, wipe, and medical-mask demand is expanding, and spunbond lines offer higher margins with lower labor intensity than traditional weaving.


