
Market Overview
| Study Period | 2020 - 2031 |
|---|---|
| Forecast Data Period | 2026 - 2031 |
| Base Year Market Size (2025) | USD 40.15 Billion |
| Market Size (2026) | USD 41.85 Billion |
| Market Size (2031) | USD 51.52 Billion |
| Growth Rate (2026 - 2031) | 4.24 % |
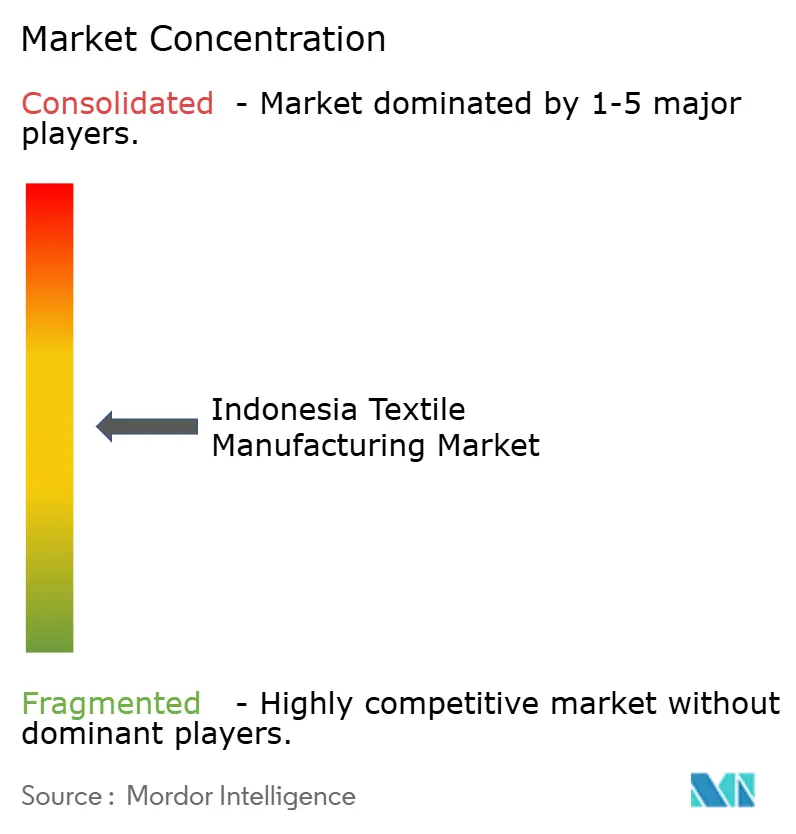
| Market Concentration | Medium |
Major Players *Disclaimer: Major Players sorted in no particular order Image © Mordor Intelligence. Reuse requires attribution under CC BY 4.0. | |
Indonesia Textile Manufacturing Market Analysis by Mordor Intelligence
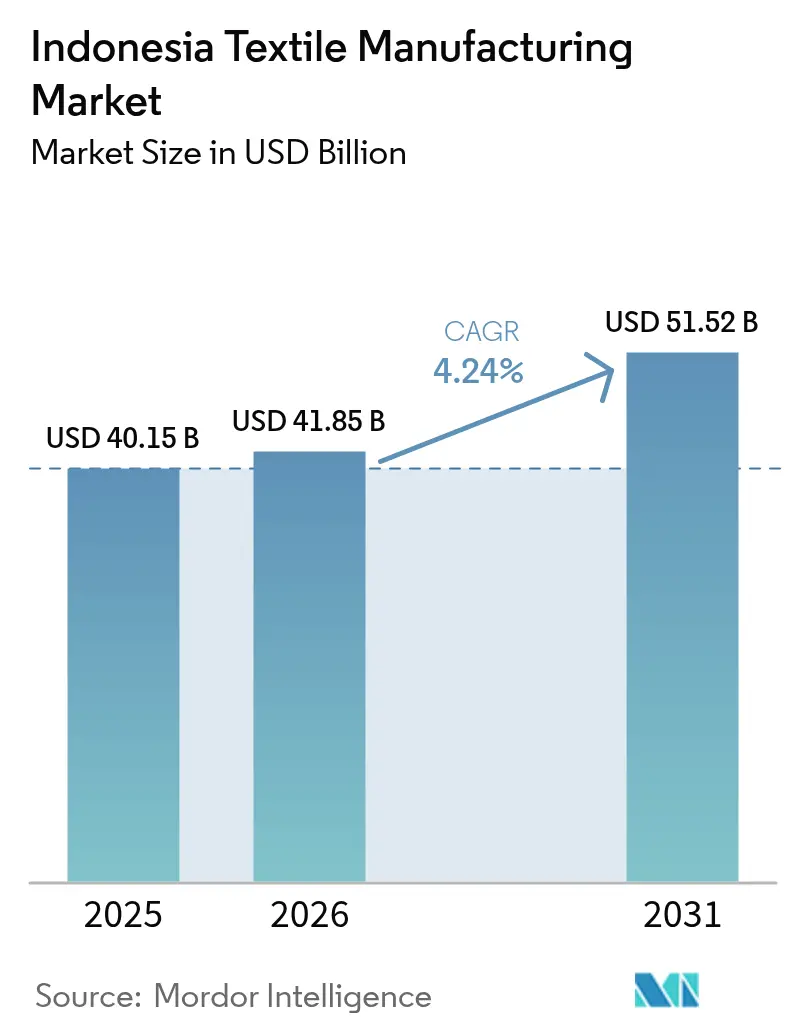
The Indonesia Textile Manufacturing Market size market size in 2026 is estimated at USD 41.85 billion, growing from 2025 value of USD 40.15 billion with 2031 projections showing USD 51.52 billion, growing at 4.24% CAGR over 2026-2031. Robust policy backing through the Making Indonesia 4.0 roadmap, a large pool of skilled labor, and resurging foreign orders position the country as a vital sourcing hub for brands looking to diversify Asian supply chains. Java’s mature industrial ecosystem, together with rising factory automation and petrochemical integration, sustains cost competitiveness even as wage pressures inch up. Expanding demand for modest wear and technical textiles continues to lift output quality, while the shift toward recycled fibers signals growing alignment with global sustainability standards[1]Ministry of Industry, “Making Indonesia 4.0 Roadmap,” Ministry of Industry, kemenperin.go.id. Despite logistics bottlenecks and import-led price competition, proactive tax incentives, green-industry certifications, and regional development programs underpin medium-term growth prospects.
Key Report Takeaways
- By region, Java held 75.88% of the Indonesia textile manufacturing market share in 2025; Sulawesi is forecast to expand at a 5.02% CAGR through 2031.
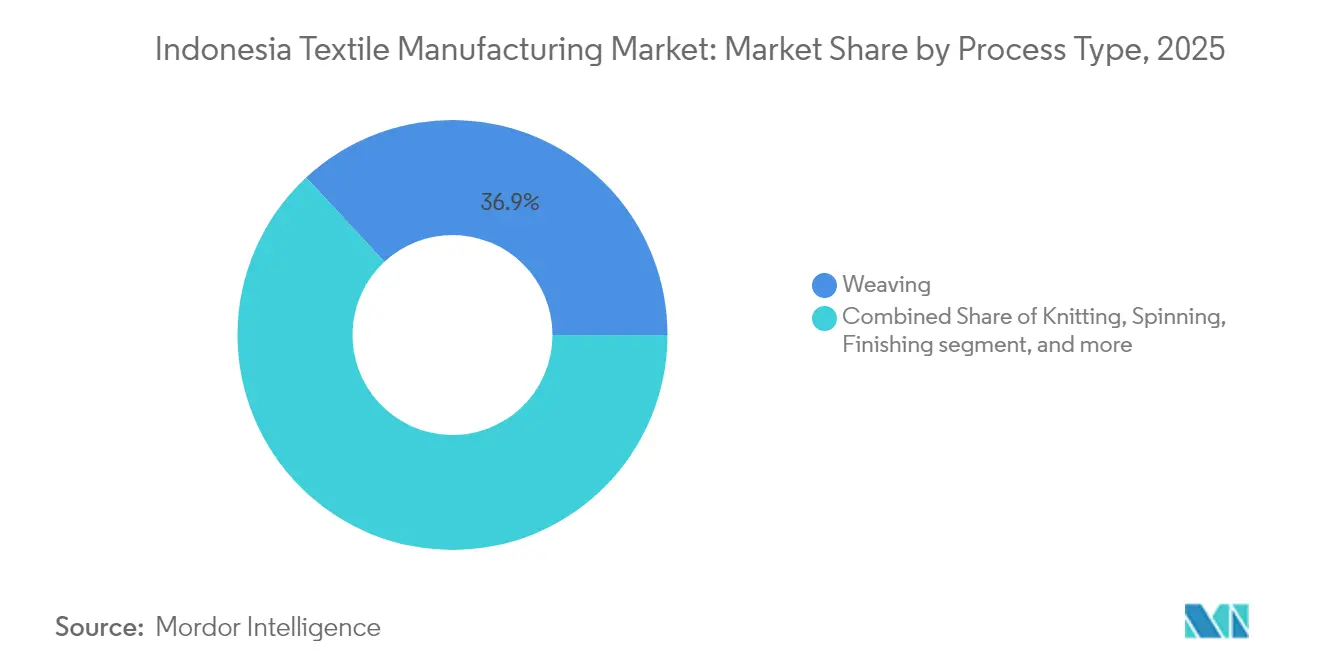
- By process type, weaving led with 36.92% revenue share in 2025, while knitting records the fastest projected CAGR at 4.93% through 2031.
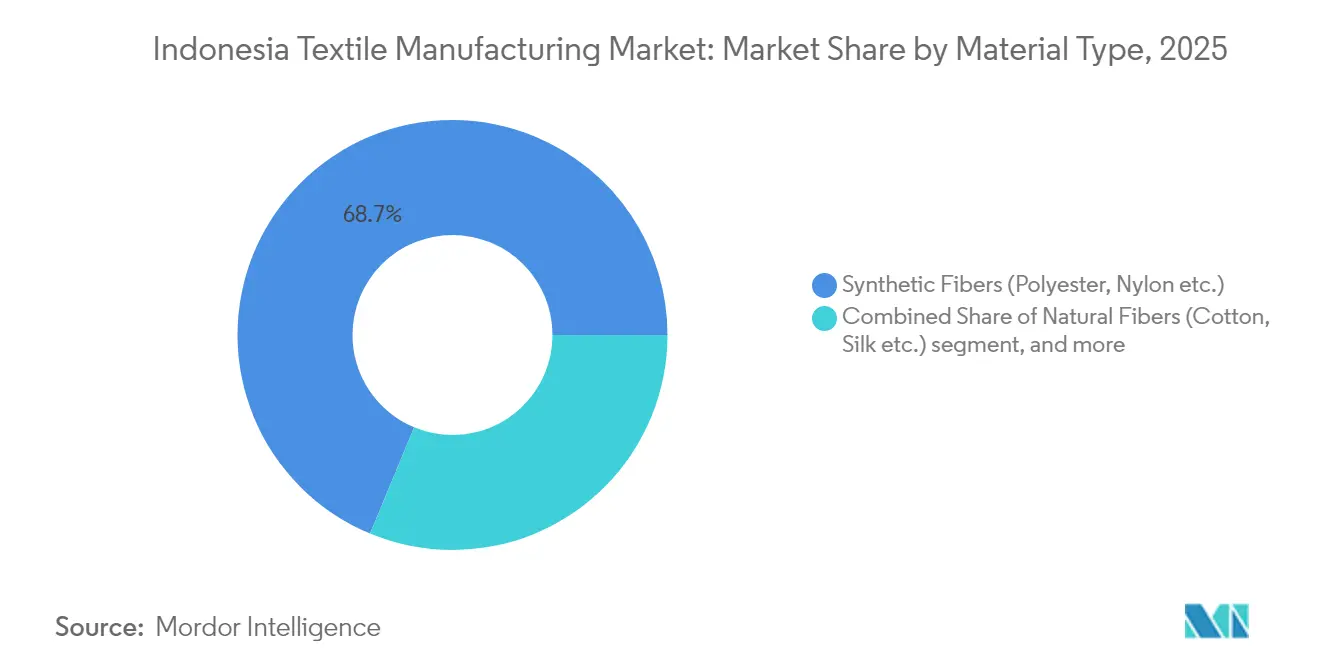
- By material type, synthetic fibers accounted for 68.74% share of the Indonesia textile manufacturing market size in 2025; regenerated and recycled fibers are advancing at a 6.19% CAGR to 2031.
- By application, apparel commanded 71.88% share of the Indonesia textile manufacturing market size in 2025, and technical textiles are growing at a 4.89% CAGR through 2031.
Note: Market size and forecast figures in this report are generated using Mordor Intelligence’s proprietary estimation framework, updated with the latest available data and insights as of 2026.
Indonesia Textile Manufacturing Market Trends and Insights
Drivers Impact Analysis*
| Driver | (%) Impact on CAGR Forecast | Geographic Relevance | Impact Timeline |
|---|---|---|---|
| Rising near-shoring of activewear orders from US & EU brands to Java clusters | +1.2% | Java hubs, spillover to Bali | Short term (≤ 2 years) |
| Boom in Muslim fashion exports driving value-added garment production | +0.9% | National, focused on Java & Sumatra | Long term (≥ 4 years) |
| Government Making Indonesia 4.0 incentives accelerating textile automation | +0.8% | Java core, expanding to Sumatra & Sulawesi | Medium term (2-4 years) |
| Surge in e-commerce-led domestic apparel demand among Gen-Z consumers | +0.7% | Urban centers in Java, Sumatra & Sulawesi | Medium term (2-4 years) |
| Import-substitution push for man-made fibers | +0.5% | Nationwide, petrochemical-linked zones | Long term (≥ 4 years) |
| Investor tax breaks for green dye-house upgrades | +0.3% | Central Java clusters | Medium term (2-4 years) |
| Source: Mordor Intelligence | |||
Rising Near-Shoring of Activewear Orders from US & EU Brands to Java Clusters
Labor cost escalation in legacy Asian hubs and the need for faster replenishment bring Western labels to Java’s large-scale plants. Pan Brothers, with annual capacity of 117 million pieces, has secured incremental contracts for performance knitwear, underscoring the pivot toward Indonesia. Close proximity among yarn, fabric, and garment units inside the island’s industrial estates compresses lead times and lowers handling expenses. Nevertheless, uncertainty over potential US tariff hikes remains a watchpoint for producers.
Boom in Muslim Fashion Exports Driving Value-Added Garment Production
Indonesia leverages cultural affinity and design talent to supply the expanding global modest-fashion segment, estimated at USD 361 billion in 2023. Showcases at New York Fashion Week have raised international visibility, allowing local brands to command higher price points. Value-added lines create stickier customer relationships and require advanced embellishment techniques, prompting mills to invest in specialty machinery and skilled artisans.
Government “Making Indonesia 4.0” Incentives Accelerating Textile Automation
Targeted fiscal relief, priority customs lanes, and training grants are spurring mills to install digital looms, automated cutting rooms, and energy-efficient dyeing lines. Early adopters such as integrated mill PT Primatexco have trimmed defect rates and cycle times, demonstrating the productivity upside that encourages peers to follow suit. Automation also helps producers meet the shorter lead times demanded by global brands, widening Indonesia’s appeal as a near-shoring destination. Alignment with the roadmap’s export-oriented goals further incentivizes capital expenditure on Industry 4.0 solutions.
Surge in E-Commerce-Led Domestic Apparel Demand Among Gen-Z Consumers
Gen-Z shoppers place frequent small-batch online orders, prompting factories to adopt on-demand manufacturing and quick-response logistics. SMEs that pivot to digital storefronts tap nationwide demand without heavy distribution overheads. The trend also accelerates adoption of localized design and data-driven inventory planning, strengthening resilience against volatile export cycles.
Restraints Impact Analysis*
| Restraint | (%) Impact on CAGR Forecast | Geographic Relevance | Impact Timeline |
|---|---|---|---|
| Illegal low-priced imports eroding SME weaving margins | -1.1% | National, severe in Java & Sumatra | Short term (≤ 2 years) |
| Chronic port & rail bottlenecks inflating inter-island logistics cost | -0.8% | Nationwide, acute in Sulawesi & eastern regions | Medium term (2-4 years) |
| Volatile PLN electricity tariffs squeezing energy-intensive spinning | -0.6% | Java and Sumatra spinning clusters | Short term (≤ 2 years) |
| Tight labour pool in West Java driving wage inflation vs. Vietnam | -0.5% | West Java and Central Java factories | Medium term (2-4 years) |
| Source: Mordor Intelligence | |||
Illegal Low-Priced Imports Eroding SME Weaving Margins
Unlawful inflows undercut local price points and have triggered factory closures and layoffs, pushing the government to tighten import permits and step up inspections. Even with 200% safeguard tariffs, weak enforcement lets counterfeit and sub-standard fabrics slip through ports, leaving community-based weaving clusters unable to recover overheads. The new Permenperin 5/2024 regulation aims to close loopholes by clarifying documentation requirements and synchronizing customs databases.
Chronic Port & Rail Bottlenecks Inflating Inter-Island Logistics Cost
Freight bills in Indonesia average 23.5% of GDP, with container dwell times at Tanjung Priok still higher than regional peers. Textile consignments from Sulawesi or Kalimantan incur added trans-shipment costs before reaching export gateways, blunting the cost advantage of cheaper land and labor outside Java[2]World Bank Group, “Improving Indonesia’s Logistics Performance,” World Bank Group, worldbank.org. Government-partnered ICT upgrades and pre-clearance pilots are underway, yet meaningful cost relief hinges on accelerated port expansion and multimodal linkages.
*Our forecasts treat driver/restraint impacts as directional, not additive. The impact forecasts reflect baseline growth, mix effects, and variable interactions.
Segment Analysis
By Process Type: Knitting Outpaces Weaving in a Comfort-Driven Era
Weaving retained a 36.92% share of the Indonesia textile manufacturing market in 2025, anchored by entrenched shuttle and rapier loom capacity across West Java clusters. Output caters mainly to shirtings and denim, segments that still support steady export volumes. Knitting, however, posts a 4.93% CAGR through 2031 as performance apparel and athleisure lines surge. Producers deploy circular knitting machines capable of smaller lot sizes and functional yarn blends, aligning with the short-run model favored by online retailers.
Knitting’s growth also reflects rising orders from sportswear labels seeking quick replenishment out of Southeast Asia. Java-based makers leverage co-located dye-houses and print shops to deliver fully packaged garments, capturing greater value than fabric-only suppliers. In the medium term, advanced knitting techniques such as seamless construction are expected to lift productivity and reduce post-production waste, reinforcing Indonesia’s competitiveness in comfort apparel.


By Textile Type: Garments Remain Core as Up-Value Strategies Mature
Garments represented 59.5% of the Indonesia textile manufacturing market share in 2025, testifying to the country’s deep sewing expertise and abundant workforce. Producers have moved beyond cut-make-trim to full-package services, offering design input, merchandising, and compliance documentation to brand customers. The fastest expansion occurs in technical and industrial textiles at 4.89% CAGR, reflecting infrastructure spending and automotive OEM localization.
Continued garment leadership also stems from Indonesia’s modest-wear niche, where brands merge traditional motifs with modern silhouettes for export markets. Integrated players that control upstream fabric and dyeing steps capture improved margins and ensure quality alignment with brand audits. Meanwhile, fabric-only producers channel more output into protective wear, filtration, and automotive components, reducing reliance on fashion cycles.
By Material Type: Recycled Fiber Momentum Signals Sustainability Shift
Synthetic fibers commanded 68.74% of the Indonesia textile manufacturing market size in 2025, underpinned by local PTA and MEG feedstock that reduce import dependence. Recycled polyester chips sourced from domestic PET bottles fuel a 6.19% CAGR for regenerated fibers, driven by brand mandates for traceable, lower-carbon inputs. Local spinners invest in bottle flake washing lines and melt-spinning systems to certify Global Recycled Standard compliance.
The government’s 35% import-substitution target bolsters demand for locally produced man-made fibers, while ongoing trials with ramie and kenaf explore bio-based alternatives. Producers balancing virgin and recycled grades safeguard supply continuity and hedge against crude-oil volatility. Sustainability labeling enhances export prospects, particularly in the EU where extended producer-responsibility schemes tighten over time.
By Application: Technical Textiles Emerge as a New Growth Lever
Apparel retained 71.88% of 2025 revenue but technical textiles grow faster at a 4.89% CAGR on the back of road-building, mining, and vehicle assembly. Domestic consumption of geotextiles, seat fabrics, and industrial filtration media has increased alongside government infrastructure roll-outs. Large mills allocate loom capacity to heavy-weave polypropylene and polyester fabrics that command premium margins over commodity garments.
Home textiles record steady demand from Indonesia’s growing middle class and hospitality projects, yet competition from imported bedding limits price recovery. Producers seeking higher yields increasingly integrate anti-microbial or water-repellent treatments, aligning with shifting consumer expectations. The technical segment’s capital intensity and performance requirements raise entry barriers, favoring established players with R&D capabilities.
Geography Analysis
Java’s entrenched industrial heritage, high-grade utilities, and deep subcontractor pool underpin its 75.88% share of the Indonesia textile manufacturing market in 2025. The island houses specialized zones such as MM2100 and Karawang Industrial City, where integrated waste-treatment and renewable-energy solutions lower operating costs and support brand sustainability audits. Nonetheless, higher minimum wages in West Java and mounting traffic congestion spur manufacturers to expand into Central Java, where municipal authorities offer quicker permitting and land-tax rebates.
Sulawesi’s 5.02% CAGR through 2031 stems from new spinning and knitting investments near Makassar that capitalize on competitive wage structures and ample industrial land. Emerging dry ports aim to shorten transit times to Tanjung Priok, though full benefits will depend on synchronized rail upgrades. Creative economy artisans in South Sulawesi supplement larger factories with niche weaving, enhancing regional jobs and preserving cultural techniques.
Sumatra and Kalimantan attract capacity tied to their petrochemical clusters and pulp-and-paper supply. Producers explore waffle-weave and non-woven lines that serve agricultural applications, taking advantage of abundant biomass and easier environmental clearance than congested Java. While logistics costs remain a hurdle, ongoing port dredging and coastal road projects are expected to narrow the gap over the forecast period, making these islands more viable for medium-scale textile ventures.
Regulatory Landscape
Indonesia’s textile and textile products (TPT) market operates under tighter import administration and trade-remedy actions aimed at curbing illegal inflows and improving local utilization. The Ministry of Industry (MoI) Regulation No. 27/2025 requires a Technical Consideration (Pertek) for TPT imports, including ready-made garments. The Ministry of Trade (MoT) Regulation No. 17/2025 places Pertek as a prerequisite for Import Approval (PI) via the National Single Window (SINSW) and INATRADE workflows.
On trade remedies, Ministry of Finance Regulation No. 98/2025 establishes safeguard duties for 16 categories of imported woven cotton fabrics, effective from January 2026, which adds protection for domestic weaving and finishing. Standards and conformity assessment continue to run through Indonesian National Standards (SNI) under the National Standardization Agency (BSN), with BBSPJI Tekstil providing testing and product certification for textile compliance needs. Separately, the Ministry of Industry has also emphasized administrative compliance such as National Industrial Information System (SIINas) reporting, which affects eligibility for facilities and engagement with government programs.
Value Chain Analysis
Indonesia’s textile manufacturing value chain spans upstream petrochemical-linked synthetics and natural-resource-based fibers through to spinning, weaving and knitting, dyeing and finishing, and finally garmenting and distribution. On the upstream side, naphtha-derived intermediates feed into PTA and MEG for polyester, while dissolving pulp from industrial forest plantations supports viscose and rayon inputs. The material mix remains dominated by synthetic fibers (68.74% share in 2025), highlighting the need for reliable chemical and polymer supply into Java-centric mills. Midstream activities cluster heavily in Java industrial estates where co-location of yarn, fabric, dye-houses, and garment units compresses lead times for export orders, and finishing becomes a key value-add step for apparel (71.88% share in 2025) as well as higher-spec technical textiles.
Distribution is shaped by export gateway dependence and domestic inter-island logistics constraints, with port and rail bottlenecks raising costs for factories outside Java and increasing trans-shipment reliance. Government programs under Making Indonesia 4.0 and related Ministry of Industry initiatives focus on machine restructuring, workforce upskilling (including BPSDMI 3in1 training), and Industry 4.0 adoption. Import controls and documentation rules, including Permenperin 5/2024 and subsequent tightening of import permits, also affect inbound yarn and fabric availability and increase compliance load. Structural stress shows up across upstream and midstream segments, where industry groups have reported factory closures and layoffs in 2024-2025, reinforcing the sector’s push toward productivity upgrades, higher-value products, and better supply-chain integration.
Competitive Landscape
Competition is balanced between a handful of vertically integrated conglomerates and thousands of SMEs. PT Indorama Polychem and PT Asia Pacific Fibres dominate upstream PTA and polyester staple fiber, giving them bargaining power over downstream buyers. Garment manufacturing, by contrast, is fragmented, with few players exceeding 2% market share individually. This dispersion limits coordinated pricing power and intensifies the scramble for export contracts, especially when illegal imports depress domestic prices.
Strategic moves center on backward integration and digital upgrades. Leading mills invest in bottle-to-fiber recycling plants, dye-house water-recycling systems, and 3D sampling to meet stricter buyer audits. Pan Brothers upgraded its ERP and RFID inventory tracking to improve transparency for European customers. Smaller firms band together in co-operatives to purchase raw materials and negotiate shipping slots, partially offsetting scale disadvantages.
Financial pressures remain evident: PT Sri Rejeki Isman (Sritex) entered bankruptcy in October 2024, prompting suppliers to reassess credit terms. Conversely, newcomers leveraging low-interest green-investment loans enter technical-textile niches that promise higher margins. Foreign joint ventures, predominantly from Japan and South Korea, continue to infuse capital and technical know-how, reinforcing Indonesia’s role in regional supply chains despite episodic macro-volatility.
Indonesia Textile Manufacturing Industry Leaders
PT Asia Pacific Fibers TBK
Indo - Rama synthetics TBK
PT Sri Rejeki Isman TBK
PT Tifico Fiber Indonesia TBK
PT Pan Brothers TBK
- *Disclaimer: Major Players sorted in no particular order

Market Opportunities and Future Outlook
Near-term whitespace concentrates in midstream capacity and capabilities that reduce reliance on imported fabrics and improve finishing performance for export-grade orders. The government’s January 2026 announcement of a USD 6 billion funding plan managed by Danantara to strengthen the midstream textile industry (yarn, fabric, dyeing, and finishing) points to policy attention on rebuilding domestic linkages and improving competitiveness in segments where fragmentation has limited scale and consistency. In parallel, the Ministry of Industry’s machine restructuring support, including a Rp50 billion allocation in May 2024 for finishing and printing companies, offers a practical route for mills to upgrade dye-house efficiency, quality systems, and compliance readiness aligned to brand audits.
Private investment is also shifting toward integrated, export-oriented manufacturing zones designed to shorten lead times and consolidate processes. In April 2026, PT Binkova Textiles Indonesia, PT Dafei Textile Indonesia, and PT Serendipity Fashion Indonesia broke ground on a vertical textile facility in Subang Smartpolitan, West Java, backed by a USD 60 million investment, indicating active build-out of end-to-end production within Java’s industrial ecosystem. Opportunities also sit in circular inputs and traceability, since regenerated and recycled fibers are the fastest-growing material category in the report’s segmentation. That dynamic is encouraging spinners and fabric makers to add certified recycling, testing, and documentation capabilities that support buyer sustainability requirements and the broader import-substitution agenda for man-made fibers.
Recent Industry Developments
- May 2026: A Semarang corruption court sentenced former Sritex executives Iwan Setiawan Lukminto and Iwan Kurniawan Lukminto to 14 and 12 years in prison, respectively, in a corruption and money-laundering case tied to loan defaults. The ruling intensified lender and buyer scrutiny of governance and financial controls across large Indonesian textile groups. It also reinforced the sector’s shift toward tighter credit terms and higher compliance requirements for vendor qualification.
- July 2025: PT Asia Pacific Fibers Tbk announced the permanent closure of its Chemical and Fiber production unit in Karawang, West Java, after a temporary suspension that started on November 1, 2024, citing high maintenance costs and lack of technical and commercial viability. Removing upstream capacity tightens domestic availability options for certain synthetic intermediates and fibers and increases reliance on imports or alternate local suppliers. The shutdown also shows how sustained margin pressure can translate into irreversible capacity rationalization.
- February 2024: The Ministry of Industry issued Permenperin 5/2024 to curb illegal textile imports by tightening documentation requirements and synchronizing customs-related databases. The regulation raised the administrative bar for importers while supporting domestic mills facing price undercutting in fabric and garment categories. It also laid groundwork for later import licensing tightening by linking enforcement to clearer permit and data-validation workflows.


Research Methodology Framework and Report Scope
Market Definition and Coverage
This market covers the value of textile manufacturing done inside Indonesia, counted as factory-gate revenue from turning fibers into yarn and then into fabric and related finished textile outputs.
Scope exclusions: We exclude retail apparel sales, export logistics services, and upstream petrochemical feedstock production so the totals stay tied to manufacturing output.
Segmentation Overview
- By Process Type
- Spinning
- Weaving
- Knitting
- Finishing
- Other Processes (non-woven)
- By Textile Type
- Fiber
- Yarn
- Fabric
- Garments
- Other Textiles
- By Material Type
- Natural Fibers (Cotton, Silk etc.)
- Synthetic Fibers (Polyester, Nylon etc.)
- Others (Regenerated & Recycled Fibers, Speciality Fibers)
- By Application
- Apparel
- Home Textiles
- Technical/Industrial Textiles
- Other Applications
- By Region (Indonesia)
- Java
- Sumatra
- Others (Kalimantan, Sulawesi, Bali, etc.)
Data Sources, Market Sizing, and Validation
Desk Research
Desk work started with building the industry structure and the measurable data series that can be tracked year to year. We referred to public sources such as Statistics Indonesia (BPS) industrial surveys, Indonesia Customs trade statistics, UN Comtrade, and the World Bank macro indicators to understand production intensity, trade flows, and demand signals.
To translate these signals into market value, we also reviewed sources such as Ministry of Industry releases, association publications for textiles and garments, peer-reviewed papers on textiles and synthetic fibers, and public company filings and investor presentations. Select paid subscriptions were used only to speed up company financials and news tracking, and to check patent activity where it impacts process upgrades. The sources listed here are illustrative, and many other public and paid references were used for cross-checks, clarifications, and final validation.
Primary Interviews and Surveys
Primary calls and surveys were used to test assumptions that desk sources do not state clearly, especially factory utilization, product mix shifts, and typical price movements at the mill and finishing stage. We spoke with a mix of manufacturers, input suppliers, traders, and downstream buyers across key producing islands, and then reconciled differences before freezing the final model.
Distribution of primary research fieldwork respondents
| Company type | Respondent position |
|---|---|
| Top tier: 32% | CXOs: 14% |
| Mid tier: 54% | Functional/Unit leaders: 31% |
| Smaller Players: 14% | Managers: 55% |
Market-Sizing & Forecasting
The core sizing uses a top-down build where national manufacturing output signals are reconstructed into textile value added and then converted into market value at factory-gate pricing. The totals are then stress-tested with selective bottom-up approximations, such as sampling average selling prices multiplied by plausible production volumes for key product lines, followed by channel checks with traders and large buyers to adjust any drift.
Inputs used in the model include textile and apparel production indices, import and export values for yarn and fabrics, capacity additions or shutdowns reported by industry bodies, utilization rates shared by interviewees, and indicative price trends for yarn and common fabric categories. For forecasting, scenario analysis was used because demand and pricing can swing with global orders and currency movement, and then the chosen path was aligned with what operators described as realistic. Where bottom-up checks had gaps, we used conservative ranges and applied them only as validation guards rather than as the main build.
Data Validation & Update Cycle
Model outputs are checked against independent signals, including trade balances for major textile lines, production trend direction, and whether implied pricing looks realistic versus what interviews suggested. When an outlier appears, we revisit the assumptions, re-check unit conversions, and re-contact sources where the variance is material.
Each draft goes through multi-step analyst review before sign-off, and the report is refreshed annually with interim updates when major events occur, such as policy shifts or sharp demand changes. Right before delivery, a final pass is done so clients receive the most current view available at the time.
Mordor Intelligence's Indonesia Textile Manufacturing Industry Study Market Estimate Compared With Other Published Estimates
Published market values for Indonesia textile manufacturing can look far apart because different studies define what counts as manufacturing revenue and what is treated as downstream trade or retail. Differences also show up when one estimate mixes machinery spend, services, or apparel retail into the same number, or when currency timing and inflation handling are not explained.
The largest gaps usually come from scope and pricing logic, especially whether figures are factory-gate only or include retail markups, and whether yarn and fabric flows are netted against re-exports. Another driver is how the forecast path is chosen, since some publishers lean on aggressive demand recovery assumptions without validating utilization and order trends through industry interviews.
Benchmark comparison
| Source | Market Size | Gaps in Research Methodology |
|---|---|---|
| Mordor Intelligence | USD 40.15 B (2025) | |
| Industry Publisher A | USD 42.00 B (2025) | Uses a wider process and equipment framing, which can pull machinery and broader textile categories into the value line, pushing totals above a factory-gate manufacturing-only view. |
| Market Publisher B | USD 6.50 B (2024) | Appears to apply a narrower revenue boundary and a different value chain cut, which can exclude large parts of yarn and fabric manufacturing when the focus shifts toward select textile outputs. |
The spread in the table is mainly explained by what gets counted as manufacturing output, how prices are applied along the chain, and whether adjacent spending is included. Keeping the estimate anchored to factory-gate revenue from core spinning through finishing, and checking utilization and trade signals before freezing assumptions, is the choice applied by Mordor Intelligence.


Key Questions Answered in the Report
What is the current size of the Indonesia textile manufacturing market in 2026?
It stands at USD 41.85 billion, with a forecast to reach USD 51.52 billion by 2031.
Which region dominates Indonesia’s textile output?
Java accounts for 75.88% of national revenue owing to its dense industrial clusters and export logistics.
Which process segment is growing the fastest?
Knitting records the highest CAGR at 4.93% through 2031 as demand for activewear surges.
How significant are recycled fibers in the material mix?
Regenerated and recycled fibers show a 6.19% CAGR, reflecting stronger sustainability mandates.
What are the main challenges facing Indonesian textile SMEs?
Illegal low-priced imports and high logistics costs squeeze margins and erode competitiveness.
Page last updated on:


 Your data is secure and never sold or shared.


