
Market Overview
| Study Period | 2020 - 2031 |
|---|---|
| Forecast Data Period | 2026 - 2031 |
| Historical Data Period | 2020 - 2024 |
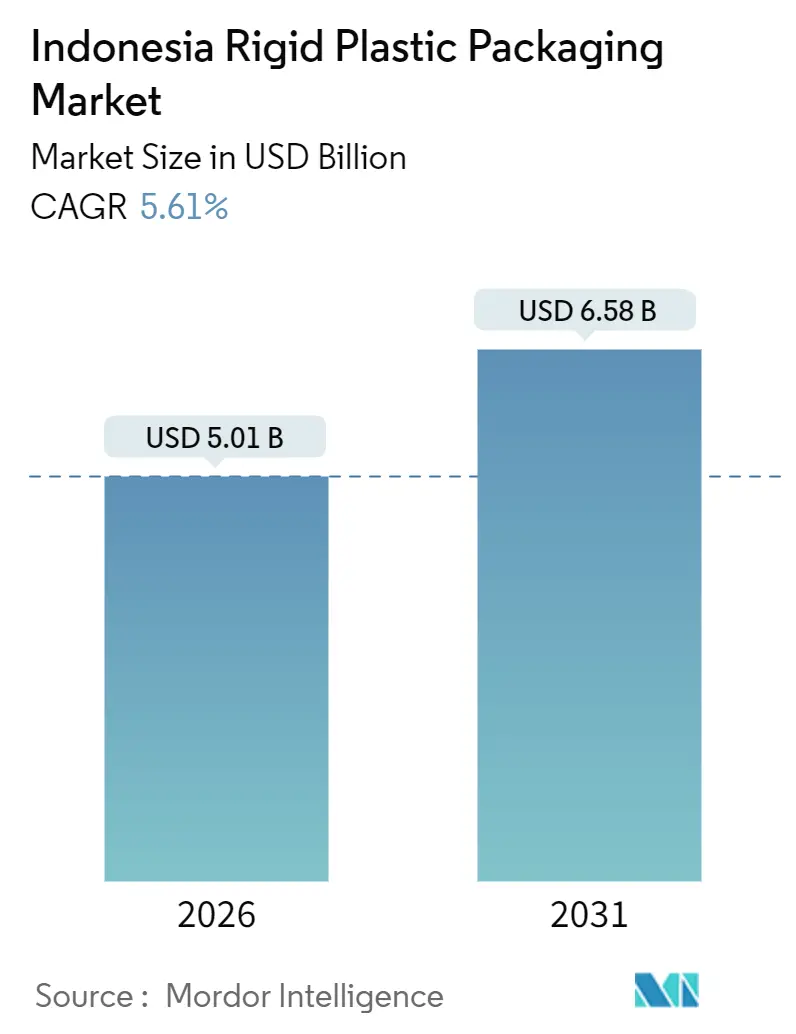
| Market Size (2026) | USD 5.01 Billion |
| Market Size (2031) | USD 6.58 Billion |
| Growth Rate (2026 - 2031) | 5.61 % |
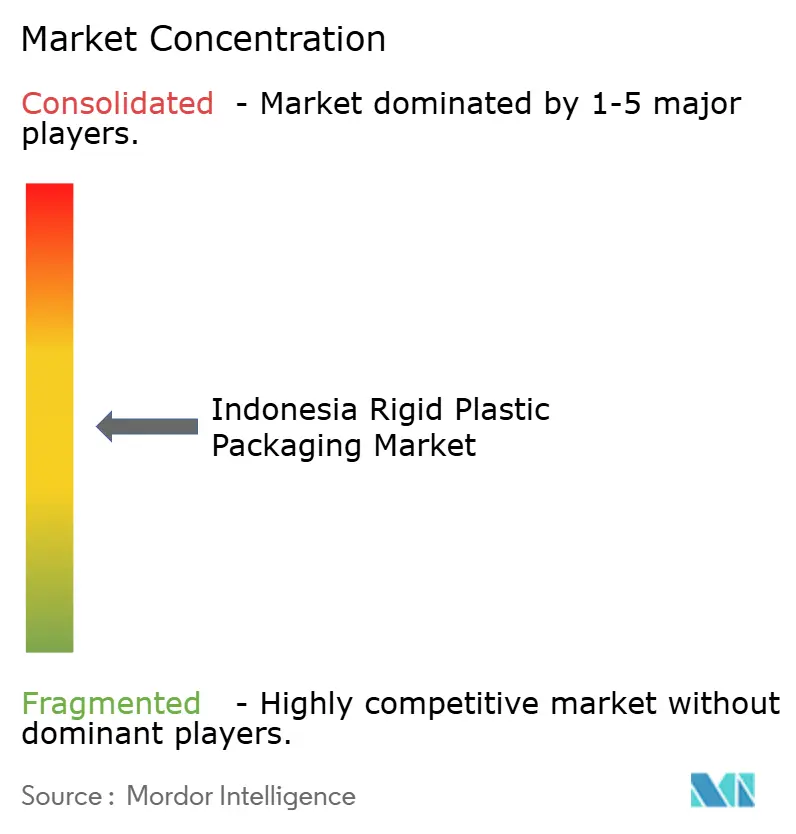
| Market Concentration | Medium |
Major Players *Disclaimer: Major Players sorted in no particular order Image © Mordor Intelligence. Reuse requires attribution under CC BY 4.0. | |
Indonesia Rigid Plastic Packaging Market Analysis by Mordor Intelligence
The Indonesia rigid plastic packaging market size stands at USD 5.01 billion in 2026 and is projected to reach USD 6.58 billion by 2031, expanding at a 5.61% CAGR during the forecast period. Demographic growth, with an urbanization level already above 57%, and a middle-class population approaching 135 million individuals, is sustaining double-digit gains in packaged-food and beverage consumption, which together absorb the majority of rigid-packaging volumes. Retail consolidation and last-mile e-commerce logistics raise the technical bar for tamper-evident closures, impact-resistant bottles, and barcode-ready labels, steering converters toward high-precision injection and stretch-blow moulding. Brand owners are rapidly lightweighting polyethylene terephthalate (PET) formats. Preform weights have decreased by 15% since 2023, as manufacturers experiment with post-consumer resin blends to comply with a 30% recycled-content mandate scheduled for 2030. Meanwhile, Chandra Asri Petrochemical’s capacity additions, along with Indorama Ventures Indonesia’s USD 100 million PET debottlenecking, reduce exposure to resin imports and moderate feed-stock price spikes.
Key Report Takeaways
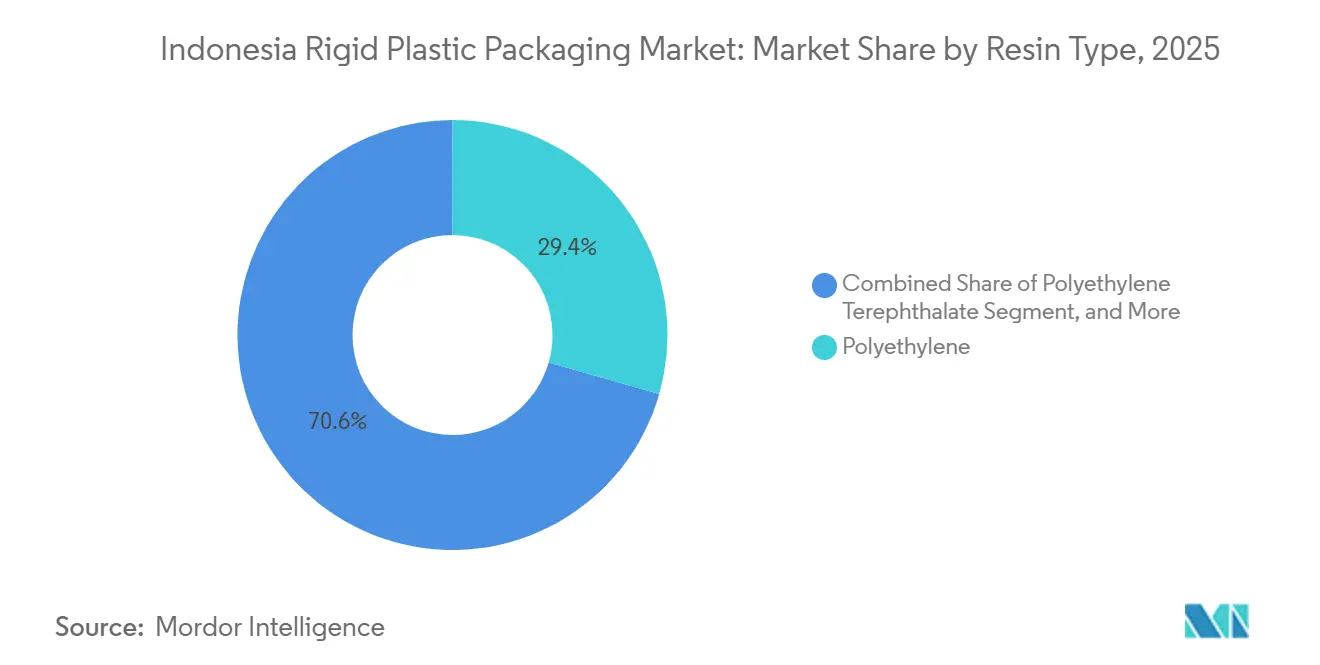
- By resin type, polyethylene commanded 29.43% of Indonesia rigid plastic packaging market share in 2025, while PET is forecast to advance at a 5.94% CAGR through 2031.
- By product type, bottles and jars led with 45.65% revenue in 2025, whereas caps and closures are poised to grow fastest at a 6.32% CAGR through 2031.
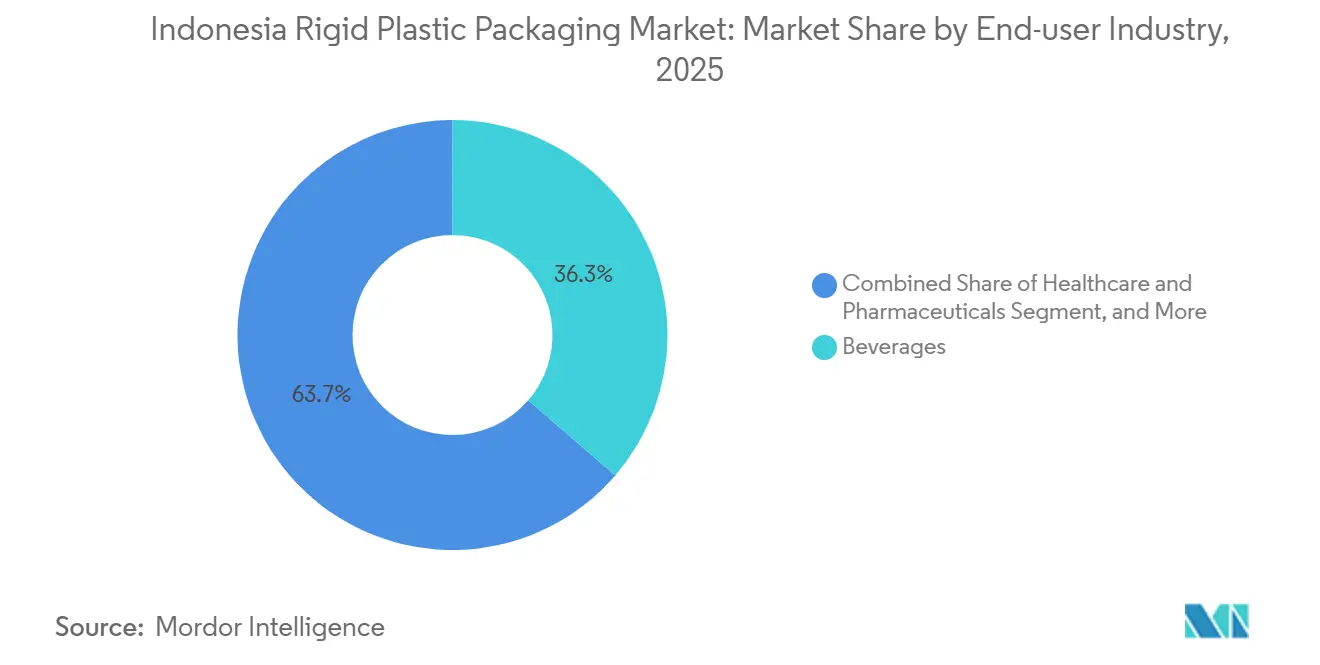
- By end-user industry, beverages captured 36.34% of demand in 2025, and healthcare and pharmaceuticals record the highest projected CAGR at 5.87% through 2031.
- By manufacturing process, injection moulding held 25.77% of Indonesia rigid plastic packaging market size in 2025, with thermoforming expected to expand at a 6.55% CAGR through 2031.
Note: Market size and forecast figures in this report are generated using Mordor Intelligence’s proprietary estimation framework, updated with the latest available data and insights as of January 2026.
Indonesia Rigid Plastic Packaging Market Trends and Insights
Drivers Impact Analysis*
| Driver | (~) % Impact on CAGR Forecast | Geographic Relevance | Impact Timeline |
|---|---|---|---|
| Rising Consumption of Packaged Food and Beverages | +1.8% | Java, Sumatra, Kalimantan urban centers | Medium term (2-4 years) |
| Growing Urban Middle-Class Purchasing Power | +1.5% | Major metros nationwide | Long term (≥ 4 years) |
| Expansion of Modern Retail and E-commerce Channels | +1.2% | Tier-2 and tier-3 cities | Short term (≤ 2 years) |
| Preference for Lightweight PET over Glass | +0.9% | Beverage-focused nationwide | Medium term (2-4 years) |
| Domestic Petrochemical Capacity Expansion Incentives | +0.6% | Cilegon and Merak industrial zones | Long term (≥ 4 years) |
| Brand-Led Refillable Rigid Packaging Pilots | +0.3% | Jakarta, Bali, Surabaya | Long term (≥ 4 years) |
| Source: Mordor Intelligence | |||
Rising Consumption of Packaged Food and Beverages
Indonesia’s packaged-food outlays are projected to grow from USD 41.4 billion in 2023 to an estimated USD 66.7 billion by 2028, driving demand for HDPE dairy bottles, polypropylene snack jars, and PET beverage containers. Per-capita spending on processed food increased by 12% from 2024 to 2025, as dual-income households sought products with longer shelf lives and greater convenience. Bottled water alone consumed 300,000 tonnes of PET in 2024, while carbonated soft drinks added 200,000 tonnes, together half of PET usage. Quick-service restaurants utilize thin-wall trays and tamper-evident lids, thereby boosting the adoption of thermoformed trays. The migration from wet markets to supermarkets reinforces consumer perceptions that rigid plastic is equivalent to food safety, a trend supported by labeling rules from the National Agency of Drug and Food Control.
Growing Urban Middle-Class Purchasing Power
Households earning USD 5,000-15,000 annually numbered 135 million by 2030 and buy three times more branded packaged goods than lower-income groups.[1]International Monetary Fund, “Indonesia Staff Concluding Statement,” imf.org GDP per capita reached USD 4,925 in 2024, and sustained 5% economic growth fuels discretionary purchases of cosmetics, premium beverages, and personal-care items packaged in rigid formats.
Expansion of Modern Retail and E-Commerce Channels
Modern retail outlets are expected to increase from 41,000 in 2020 to 52,000 by 2025, and Alfamart and Indomaret, together, operate more than 40,000 stores.[2]Indonesia Retailers Association, “Modern Retail Landscape Report 2024,” aprindo.org Uniform shelf architecture forces suppliers to standardize bottle heights and tray footprints, favoring rigid over flexible formats. E-commerce’s 23% penetration of retail sales in 2024 intensifies the need for impact-resistant bottles and tamper-evident closures. Danone-AQUA’s high-speed palletizing line, commissioned in 2024, cut breakage from 2.1% to 0.4% and trimmed reverse-logistics costs by 35%, illustrating how automation strengthens the Indonesia rigid plastic packaging market.
Preference for Lightweight PET over Glass
The average weight of PET bottles dropped from 28 g to 23.8 g for a 600 ml unit between 2020 and 2024, resulting in a savings of USD 0.02 in resin per bottle and 8% in transport fuel per truckload.[3]Coca-Cola Company, “Recycled PET Bottles in Indonesia,” coca-colacompany.com Coca-Cola Amatil introduced 100% recycled-PET bottles in November 2024, displacing 12,000 tonnes of virgin resin within six months.
Restraints Impact Analysis*
| Restraint | (~) % Impact on CAGR Forecast | Geographic Relevance | Impact Timeline |
|---|---|---|---|
| Competition from Flexible Packaging | -0.7% | Snack-food and condiment segments | Short term (≤ 2 years) |
| Volatility in Crude-Derived Resin Prices | -1.1% | Nationwide | Short term (≤ 2 years) |
| Provincial Bans on Single-Use Plastics | -0.5% | Bali, Jakarta, Bogor | Medium term (2-4 years) |
| Poor Post-Consumer Recycling Infrastructure | -0.4% | Rural and outer-island regions | Long term (≥ 4 years) |
| Source: Mordor Intelligence | |||
Volatility in Crude-Derived Resin Prices
Polyethylene and polypropylene costs track Brent crude with a three-month lag, exposing converters to swings of USD 15 per barrel that can compress margins by six percentage points. Southeast-Asian polypropylene traded at USD 930-970 per tonne CFR in December 2024, and every USD 10 rise in crude lifts naphtha costs by USD 7 per tonne, eroding profitability for plants running on 60-day payment terms. Natural-gas spikes in 2025 forced ethylene crackers to curtail output by 12%, tightening resin supply and disrupting delivery schedules for Indonesia rigid plastic packaging market customers.
Provincial Bans on Single-Use Plastics
Bali, Jakarta, and Bogor restrict single-use bags and styrofoam, creating a complex compliance mosaic across 514 districts. Jakarta’s IDR 200 per-bag levy raised USD 1.1 million in 2024, yet only 40% of minimarkets comply. West Java’s draft ban could affect 49 million residents, driving converters toward refillable or compostable formats that often add USD 0.15 per liter in distribution costs. A lack of a national deposit-return scheme and limited waste-collection coverage mean that regular pickup reaches only 68% of urban households, slowing the transition to a circular economy.
*Our forecasts treat driver/restraint impacts as directional, not additive. The impact forecasts reflect baseline growth, mix effects, and variable interactions.
Segment Analysis
By Resin Type: Polyethylene Anchors Volume, PET Drives Innovation
Polyethylene accounted for 29.43% of Indonesia rigid plastic packaging market share in 2025 thanks to high-density grades used for detergent bottles and dairy containers. High-density polyethylene alone served 210,000 tonnes of household-chemical and industrial-chemical demand in 2024. Polyethylene terephthalate is projected to grow at 5.94% through 2031, the fastest among resins, buoyed by bottled-water orders that already consume 300,000 tonnes annually. Indorama Ventures’ ongoing debottlenecking will lift domestic food-grade PET capacity by 150,000 tonnes by 2026, easing dependence on imports and encouraging bottle-to-bottle recycling.
Indonesia rigid plastic packaging market converters rely on Chandra Asri Petrochemical for roughly 40% of polyethylene and 32% of polypropylene supply, creating a quasi-oligopoly that stabilizes pricing yet limits bargaining leverage. Lightweighting remains a critical competitive lever; PT Berlina’s 15% preform weight drop between 2023 and 2024 saved 4,200 tonnes of resin and USD 8.4 million for core beverage clients, underscoring how engineering gains directly affect customer retention.


By Product Type: Bottles Dominate, Closures Accelerate
Bottles and jars generated 45.65% of 2025 revenue, with PET beverage bottles alone representing 28%. Caps and closures are the fastest movers, set to expand 6.32% annually through 2031 as child-resistant and sports-cap variants become regulatory and marketing necessities. Indo Cap Closures’ new compression-moulding lines, installed in 2024, raise closure capacity to 2 billion units per year and allow pharmaceutical customers to meet ISO 15378 traceability rules.
Indonesia rigid plastic packaging market players also emphasize tray and container innovation. Thermoformed polypropylene trays weigh 12 g versus 18 g for an injection-moulded equivalent, translating to a USD 0.04 cost advantage per unit that appeals to quick-service restaurants and ready-meal brands. Intermediate bulk containers and drums, at 9% of product revenue, address industrial chemicals and lubricants, while niche items such as pallets and crates account for the remaining 7%.
By End-User Industry: Beverages Lead, Healthcare Surges
Beverages accounted for 36.34% of the rigid-packaging market in 2025, comprising bottled water, carbonated drinks, and ready-to-drink tea and coffee. Per-capita bottled water usage reached 28 liters in 2024 and is increasing at a rate of 6% annually, promising steady demand for PET. Healthcare and pharmaceuticals, which are projected to grow at 5.87% through 2031, rely on autoclavable polypropylene vials and tamper-evident HDPE bottles. Notably, Kalbe Farma alone sourced 8,000 tonnes of rigid containers in 2024.
Food applications accounted for a significant share of market demand, driven by polypropylene confectionery jars and HDPE dairy bottles.
By Manufacturing Process: Injection Moulding Leads, Thermoforming Gains
Injection moulding covered 25.77% of Indonesia rigid plastic packaging market size in 2025, valued for precision and cycle-time efficiency in closures and pharmaceutical vials. Thermoforming, however, is set to grow fastest at 6.55% through 2031 as brands pursue thin-wall trays that reduce resin usage by 20-25%. PT Hokkan Deltapack’s 2024 thermoforming line produces 400,000 trays daily for quick-service chains, illustrating scale advantages.
Blow moulding, split between extrusion and stretch-blow techniques, maintained a 23% share by serving PET bottles and HDPE containers. Compression moulding covers thick-walled closures, while extrusion dominates intermediate bulk containers. Automation upgrades, such as servo-driven stretch-blow moulders at Indorama, cut energy use by 18% and boost conversion yields, reinforcing capital-intensive barriers to entry.
Geography Analysis
Java accounts for 58% of Indonesia rigid plastic packaging market demand because of its dense population and integrated petrochemical cluster in Cilegon and Merak. Jakarta, Surabaya, and Bandung anchor this volume, while proximity to Chandra Asri’s cracker ensures consistent resin supply and shorter delivery cycles. Sumatra contributes 22%, led by Medan and surrounding palm-oil hubs that need rigid HDPE drums for processing chemicals. Inter-island shipping inefficiencies add USD 0.03 per PET bottle when supplying Makassar from Java, encouraging regional plant investments.
Kalimantan and Sulawesi together represent 12%. Coal-mining centers in East Kalimantan rely on intermediate bulk containers, and Makassar’s growing urban base fuels demand for beverage bottles and personal-care jars. Bali, though smaller in population, has a per-capita packaging intensity 40% above the national average because tourism drives bottled-water and takeaway food sales. Eastern provinces, including Papua, Maluku, and Nusa Tenggara, account for only 6%, constrained by fragmented logistics and lower incomes that favor flexible pouches.
Modern-trade retailers accelerated store openings outside Java, pushing converters to consider satellite plants. PT Solusi Prima Packaging’s upcoming Balikpapan blow-moulding site reflects this shift and will cut freight costs for East-Kalimantan customers by one-third. Waste-collection coverage remains patchy outside metros, limiting post-consumer-resin supply and complicating compliance with the 30% recycled-content mandate, a barrier that will persist until municipal pickup surpasses 70% in outer islands.
Regulatory Landscape
Indonesia’s regulatory framework for rigid plastic packaging is shaped by food-contact controls, national standards, and producer-responsibility rules. BPOM's Regulation No. 11/2026, effective June 30, 2026, tightens substance lists and migration limits that affect resins and additives used in bottles, jars, trays, and closures for food and beverages.
Standards and waste governance rely on BSN's SNI framework, including SNI 8424:2023 for recycled PET resin with SPPT SNI certification. For end-of-life obligations, MoEF Regulation P.75/2019 sets the Roadmap to Waste Reduction by Producers, with a 30% packaging waste reduction target by 2029 and signaling in 2026 for stricter enforcement of corporate packaging waste management, including design-for-recycling and traceability expectations.
Value Chain Analysis
The value chain starts with upstream resin and additive supply, where domestic petrochemical production such as Chandra Asri for polyethylene and polypropylene shapes price formation and availability for converters. Midstream, converters use injection moulding, blow moulding, and thermoforming to produce bottles and jars, caps and closures, trays and containers, and industrial formats, with scale players such as PT Berlina Tbk and Indorama Ventures Indonesia complemented by a long tail of regional converters and specialist molders.
Downstream, rigid packs move through brand owners in beverages, food, healthcare and pharmaceuticals, personal care, and industrial chemicals into modern retail and e-commerce networks, where damage resistance and closure integrity matter. Circularity and compliance are increasingly built into day-to-day operations across the chain: MoEF’s P.75/2019 EPR roadmap and SE 11/2025 inventory and reporting framework push producers to quantify packaging types and volumes and to partner with waste banks and licensed recyclers to secure post-consumer resin and certification across procurement, conversion, and distribution.
Competitive Landscape
The five largest converters captured 42% of Indonesia rigid plastic packaging market revenue in 2025, leaving 58% to more than 200 smaller players. Upstream, Chandra Asri controls 40% of polyethylene and 32% of polypropylene, creating a feed-stock bottleneck that shapes downstream pricing. Its acquisition of Shell’s Singapore refinery adds a 1.1-million-tonne cracker that will backstop regional shortfalls and potentially stabilize resin pricing once integration completes in 2026.
Competitive playbooks center on lightweighting, recycled-content integration, and automation. PT Berlina’s 4,200-tonne PET-savings program secured a multiyear contract renewal with Coca-Cola. Indorama Ventures’ USD 100 million PET expansion couples virgin-material debottlenecking with bottle-to-bottle recycling, enabling beverage brands to audit supply chains for traceability. Servo-driven injection presses and collaborative robots are spreading; PT Hasil Raya Industries cut labor costs 28% after its 2024 automation retrofit, widening its margin lead over smaller regional converters that still run hydraulic machines from the 1990s.
White-space opportunities persist in pharmaceutical cold-chain vials and refillable personal-care bottles. However, achieving ISO 15378 certification and installing cleanrooms require capital outlays many small converters cannot fund. Waste-management startups provide feed-stock to meet recycled-content targets but cannot yet scale beyond Java, leaving outer islands underserved. The resulting landscape favors gradual consolidation, with regional specialists either moving up the value chain or becoming acquisition targets for large multinationals seeking capacity and geographic spread.
Indonesia Rigid Plastic Packaging Industry Leaders
PT. Indorama Ventures Indonesia
PT. Berlina Tbk
PT Indo Tirta Abadi
Indo Cap Closures
PT.Solusi Prima Packaging
- *Disclaimer: Major Players sorted in no particular order

Market Opportunities and Future Outlook
A primary opportunity is building certified, food-grade recycled-content supply chains that meet tightening food-contact requirements while aligning with producer waste-reduction obligations. BPOM Regulation No. 11/2026 increases the need for documented substance compliance and migration performance in food packaging, and BSN's SNI 8424:2023 for recycled PET resin provides a clearer qualification path for rPET suppliers and packaging converters targeting bottle-to-bottle applications.
Another opportunity is tied to domestic feedstock and circular-economy capacity additions that reduce reliance on imported materials and improve availability of packaging-grade polymers. Indorama Ventures Indonesia’s bottle-to-bottle recycling unit adjacent to its Purwakarta PET site was under development in November 2025, with a design for 30,000 tonnes per year of post-consumer resin by Q4 2026. The announced large-scale PET raw material factory project in Cilegon by Lintas Citra Pratama (investment around IDR 5.01 trillion, 720,000 tonnes per year) also points to expanding upstream options. Separately, Indonesia’s 2025-2045 Circular Economy Roadmap prioritizes plastics with eco-design and recycling ecosystem scale-up, which creates white space for converters that can deliver mono-material designs, traceability, and recycled-content integration without compromising shelf-life and distribution performance.
Recent Industry Developments
- July 2026: Indonesia, through policy communications covered by Antara, advanced moves toward making corporate packaging waste management mandatory as part of tighter Extended Producer Responsibility enforcement. This increases compliance pressure on rigid plastic packaging users and suppliers to formalize EPR plans, reporting, and downstream collection partnerships, lifting demand for design-for-recycling and recycled-content capable formats.
- November 2025: Indorama Ventures Indonesia broke ground on a bottle-to-bottle recycling unit adjacent to its Purwakarta PET plant, designed to process 30,000 tonnes of post-consumer resin annually by Q4 2026. The project strengthens local rPET availability for beverage and food-grade rigid packaging, supporting brand audits on recycled-content and traceability.
- November 2024: Coca-Cola Amatil Indonesia introduced 100% recycled-PET bottles for Coca-Cola, Sprite, and Fanta lines, reducing virgin-PET imports by 12,000 tonnes within six months. This move validated higher-rPET-content rigid packaging at scale and increased pull-through demand for certified recycled PET resin and compatible preforms and closures.


Research Methodology Framework and Report Scope
Market Definition and Coverage
For this study, we define the Indonesia rigid plastic packaging market as the value of rigid plastic packs used to contain, protect, and distribute products in Indonesia. We count at the packaging level across key applications.
Scope exclusions: We exclude flexible plastic packaging formats, and we exclude packaging made primarily from paper, metal, or glass.
Segmentation Overview
- By Resin Type
- Polyethylene
- High-Density Polyethylene (HDPE)
- Low-Density Polyethylene (LDPE)
- Linear Low-Density Polyethylene (LLDPE)
- Polyethylene Terephthalate
- Polypropylene
- Polystyrene and EPS
- Other Resin Types
- Polyethylene
- By Product Type
- Bottles and Jars
- Trays and Containers
- Caps and Closures
- Intermediate Bulk Containers (IBCs)
- Drums
- Other Product Types
- By End-user Industry
- Food
- Candy and Confectionery
- Dairy and Frozen
- Meat, Poultry and Seafood
- Other Food Types
- Beverage
- Healthcare and Pharmaceuticals
- Cosmetics and Personal Care
- Industrial Chemicals
- Building and Construction
- Other End-user Industries
- Food
- By Manufacturing Process
- Injection Moulding
- Blow Moulding
- Thermoforming
- Compression Moulding
- Extrusion
- Other Manufacturing Process
Data Sources, Market Sizing, and Validation
Desk Research
Desk research starts with building a clean demand map for rigid plastic packaging in Indonesia, then checking it against public signals that track packaged consumption and plastics activity. We typically refer to sources such as Statistics Indonesia (BPS) for manufacturing and consumption indicators, UN Comtrade for trade flows of plastics and packaging-related goods, and World Bank or IMF datasets for macro and currency context that affects price translation.
To keep the model grounded, we also review sources such as Indonesia customs-facing trade publications, packaging and plastics association releases, and peer-reviewed papers on polymers, recycling, and packaging trends in Southeast Asia. Company annual reports, investor presentations, and audited financial statements help confirm product mix and exposure to key end-use sectors. Where helpful, we also use paid subscriptions for company financials and intelligence, plus import or export shipment-level checks to sanity-test directionally. The examples listed here are not exhaustive, and many other public sources were also used to collect data, validate assumptions, and clarify definitions.
Primary Interviews and Surveys
Primary work is used to test what desk sources cannot show clearly, mainly the split of volumes by packaging format and how pricing moves with resin costs and lightweighting. We speak with converters, resin-linked supply chain participants, brand owners, and distributors in Indonesia so that our assumptions on utilization, yields, and typical pack pricing can be confirmed. When different answers show up, we re-check the definitions with respondents and then adjust the model so the final totals stay consistent across end uses and product types.
Distribution of primary research fieldwork respondents
| Company type | Respondent position |
|---|---|
| Top tier: 38% | CXOs: 13% |
| Mid tier: 41% | Functional/Unit leaders: 33% |
| Smaller Players: 21% | Managers: 54% |
Market-Sizing & Forecasting
Sizing starts from a top-down build where packaged demand in Indonesia is reconstructed through end-use output and packaged consumption indicators, then translated into rigid pack needs by format intensity. We corroborate the results using selective bottom-up approximations, such as sampling pack prices and typical annual output for a set of converters, followed by channel checks on where demand is concentrated.
Key inputs that shape the model include polymer price movements (PET, PP, PE, and PS), import and export trends for plastics and packaging-related items, food and beverage production and consumption indicators, healthcare and personal care output signals, and capacity utilization direction from industry discussions. Because not every converter discloses volumes, we handle gaps through category-level intensity factors and price bands that are stress-tested with interview feedback.
For forecasting, scenario analysis is used so that resin price direction, lightweighting pace, and adoption of recycled content can be varied without breaking the demand logic. Growth rates are then aligned with what industry participants expect for packaged goods demand in Indonesia, before the final curve is smoothed to avoid unrealistic year-to-year jumps.
Data Validation & Update Cycle
Validation is done through several passes. We compare model outputs with independent signals like polymer trade direction, packaged-goods activity, and observed pricing bands discussed in interviews. Outliers are flagged, and we review the drivers behind variance, then run a second check on calculations and unit consistency before sign-off.
The report is refreshed annually, and interim checks are triggered when material events occur, such as sharp resin price moves, policy changes affecting packaging, or major capacity additions. Before delivery, a final analyst pass is completed so clients receive the most current view based on the latest available public data and expert feedback.
Mordor Intelligence's Indonesia Rigid Plastic Packaging Market Estimate Compared With Other Published Estimates
Published market sizes for Indonesia rigid plastic packaging can differ even when the topic sounds identical, because the cut of what counts as rigid packaging and the way pricing is converted into USD are not consistent. Differences also show up when one estimate is anchored to a specific year with stable pricing, while another blends different time windows.
The spread is often driven by how average selling prices are built, especially when resin-linked inputs move quickly, and by whether values are normalized to a common currency timing before totals are reported. By refreshing key price assumptions on a set cadence and re-checking anomalies against trade and consumption signals before publication, Mordor Intelligence reduces drift that can come from stale FX timing and uneven ASP updates.
Benchmark comparison
| Source | Market Size | Gaps in Research Methodology |
|---|---|---|
| Mordor Intelligence | USD 5.01 B (2026) | |
| Regional Consultancy A | USD 4.50 B (2023) | Uses an earlier base year and may reflect a narrower value capture tied closely to food and beverage demand, with limited visibility on later price changes and format expansion. |
| Industry Publication B | USD 5.60 B (2026) | Appears to apply higher pack-price progression assumptions into 2026 without clearly normalizing resin and FX timing, which can overstate value when polymer costs spike. |
The table shows that timing and price translation can move the value materially, even if the physical packaging use is similar. Our approach keeps the estimate traceable to clear price bands, demand indicators, and repeatable checks, which makes it easier for decision-makers to explain and reuse the number in planning.


Key Questions Answered in the Report
What is the current value of the Indonesia rigid plastic packaging market?
The market is valued at USD 5.01 billion in 2026 and is forecast to reach USD 6.58 billion by 2031.
Which resin is growing fastest in Indonesian rigid packaging?
Polyethylene terephthalate (PET) is projected to grow at 5.94% annually through 2031 because of surging bottled-water demand.
How are provincial plastic bans affecting packaging suppliers?
Bans in Bali, Jakarta, and Bogor push converters toward refillable or recycled-content formats and increase compliance complexity and costs.
Which end-use sector shows the highest growth potential?
Healthcare and pharmaceuticals are expected to expand at a 5.87% CAGR as universal health coverage broadens medicine access.
What manufacturing process is gaining share?
Thermoforming is advancing at 6.55% per year, driven by thin-wall food trays that save up to 25% in material.
How concentrated is Indonesia’s rigid plastic packaging supplier base?
The top five converters control around 42% of revenue, indicating moderate concentration that still allows niche players to compete.
Page last updated on:


 Your data is secure and never sold or shared.


