
Market Overview
| Study Period | 2020 - 2031 |
|---|---|
| Forecast Data Period | 2026 - 2031 |
| Base Year Market Size (2025) | USD 3.77 Billion |
| Market Size (2026) | USD 4.04 Billion |
| Market Size (2031) | USD 5.67 Billion |
| Growth Rate (2026 - 2031) | 7.05 % |
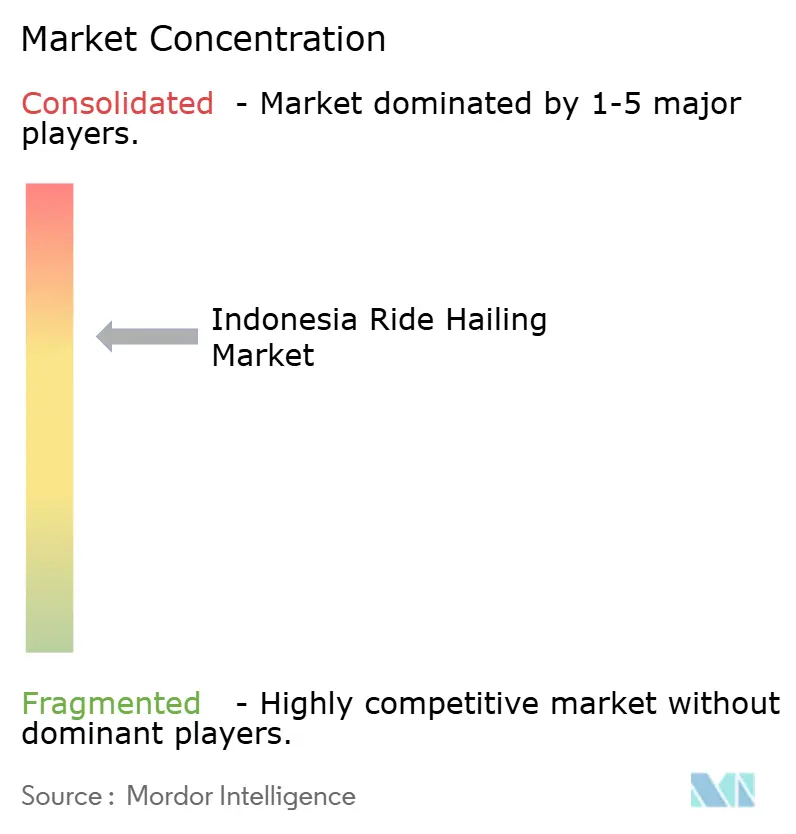
| Market Concentration | Medium |
Major Players *Disclaimer: Major Players sorted in no particular order Image © Mordor Intelligence. Reuse requires attribution under CC BY 4.0. | |
Indonesia Ride Hailing Market Analysis by Mordor Intelligence
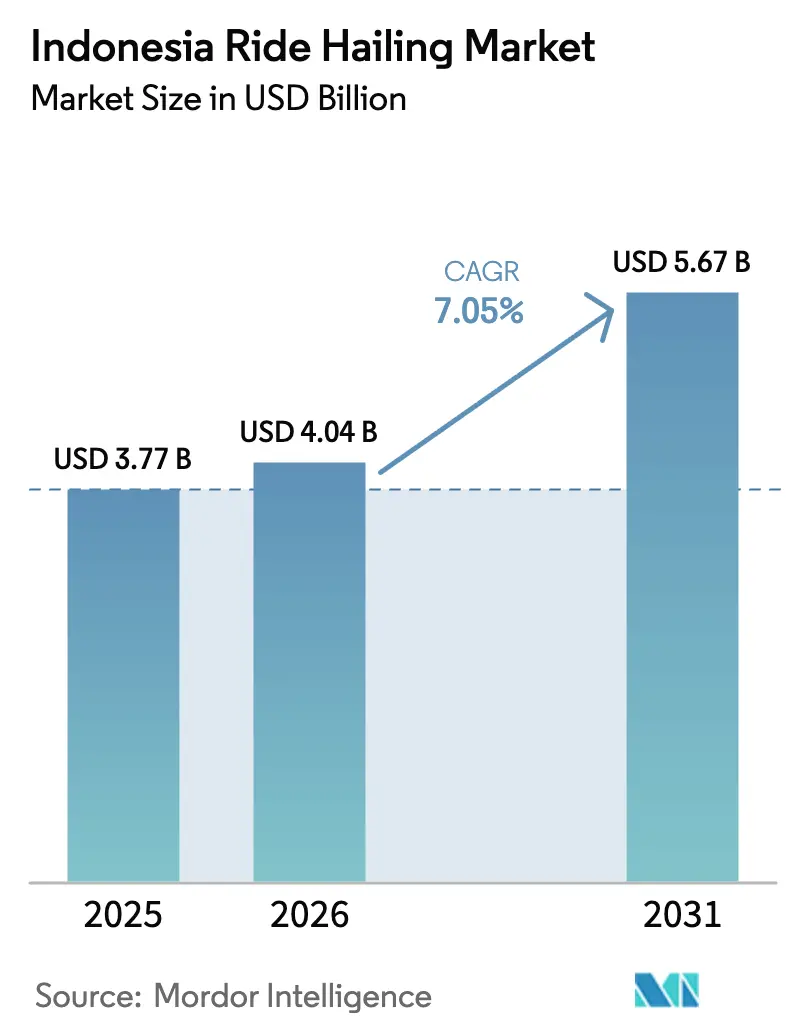
The Indonesian ride-hailing market size was valued at USD 3.77 billion in 2025 and estimated to grow from USD 4.04 billion in 2026 to reach USD 5.67 billion by 2031, at a CAGR of 7.05% during the forecast period (2026-2031). This growth trajectory is underpinned by resilient post-pandemic demand, GoTo and Grab’s pivot toward sustainable unit economics, and accelerating electrification initiatives that lower operating costs and emissions. Two-wheeler services reinforce the market’s mass-appeal value proposition in congested cities, while battery-swap networks mitigate range anxiety for electric fleets. Autonomous vehicle pilots, first-/last-mile integrations with rail and bus systems, and bundled corporate subscription plans expand use cases for the Indonesian ride-hailing market, positioning platforms to capture incremental trips as urbanization intensifies. Regulatory headwinds, including commission caps, potential fuel-subsidy removals, and antitrust scrutiny, temper margins but have not derailed the sector’s steady migration toward profitability.
Key Report Takeaways
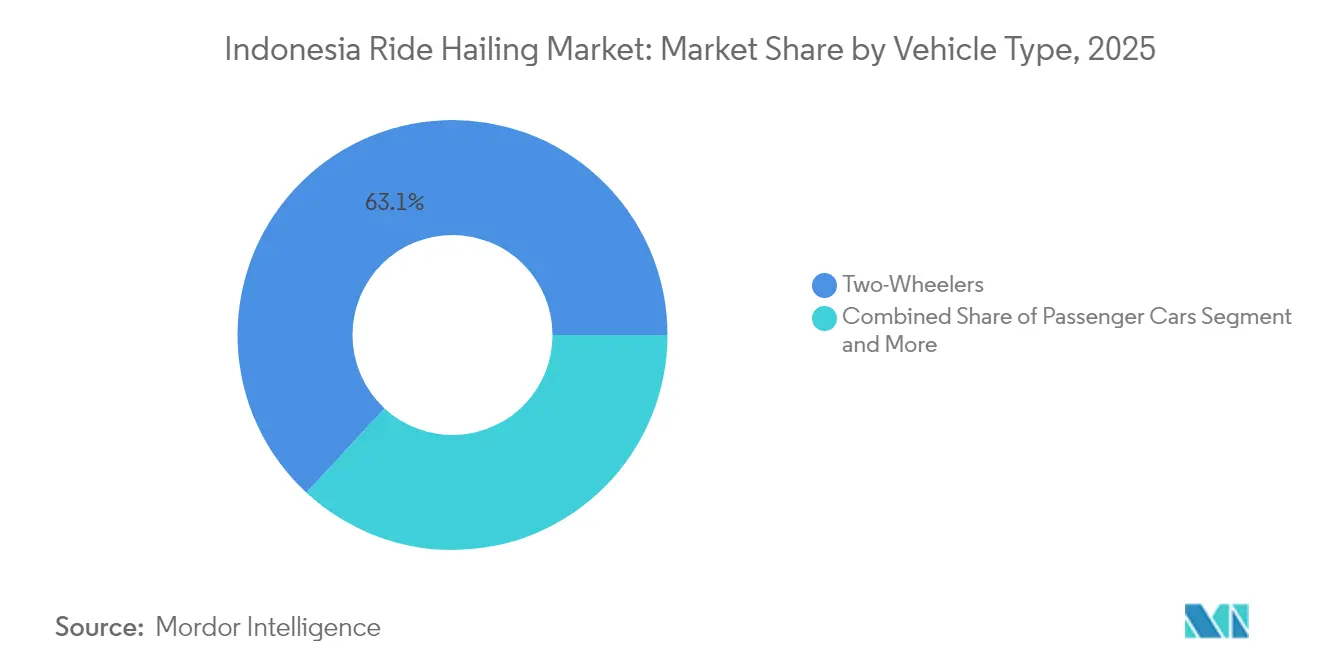
- By vehicle type, two-wheelers captured 63.12% of the Indonesian ride-hailing market share in 2025 and are projected to advance at a 7.08% CAGR during the forecast period (2026-2031).
- By propulsion, internal combustion engines held 99.18% of the Indonesian ride-hailing market size in 2025, while battery-electric vehicles are forecast to post the highest 7.13% CAGR during the forecast period (2026-2031).
- By service type, e-hailing commanded 86.05% of the Indonesian ride-hailing market share in 2025, and robo-taxis are expected to record the fastest 7.15% CAGR during the forecast period (2026-2031).
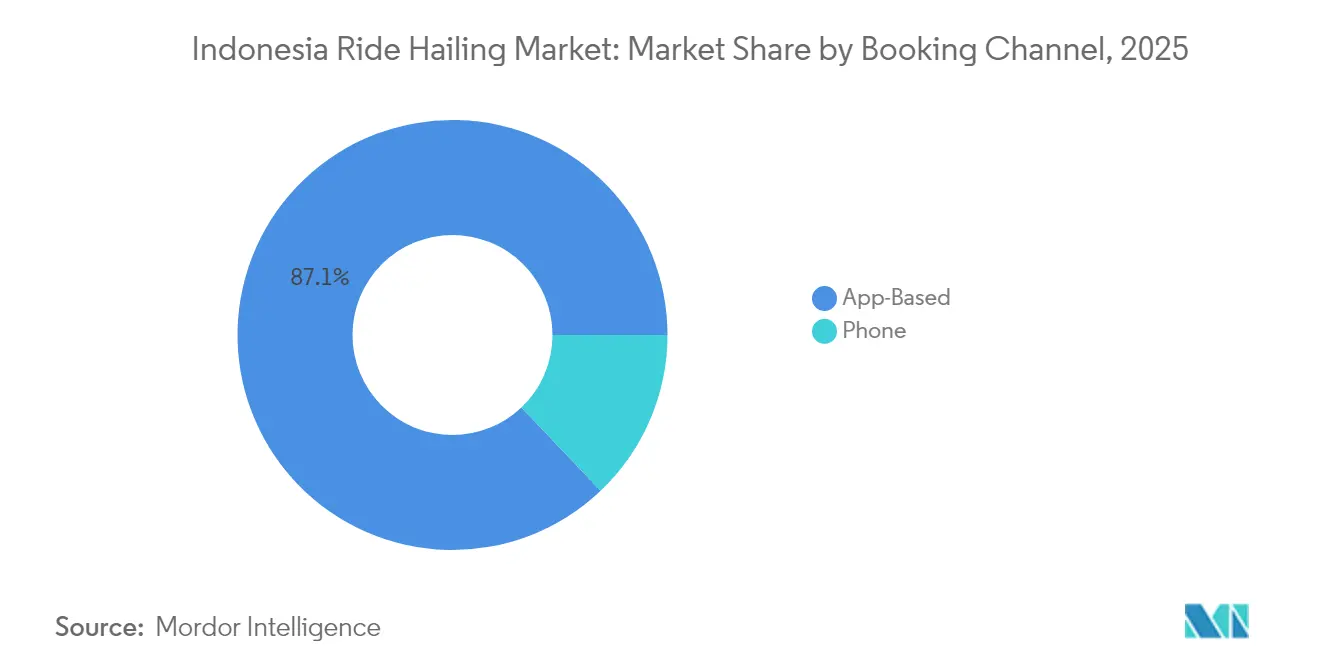
- By booking channel, app-based reservations accounted for 87.10% of the Indonesian ride-hailing market size in 2025 and are expected to grow at a 7.14% CAGR during the forecast period (2026-2031).
- By end-user, personal riders account for 76.85% of the Indonesian ride-hailing market share in 2025, while corporate and institutional customers are forecast to expand at a 7.16% CAGR during the forecast period (2026-2031).
Note: Market size and forecast figures in this report are generated using Mordor Intelligence’s proprietary estimation framework, updated with the latest available data and insights as of 2026.
Indonesia Ride Hailing Market Trends and Insights
Drivers Impact Analysis*
| Driver | (~) % Impact on CAGR Forecast | Geographic Relevance | Impact Timeline |
|---|---|---|---|
| Rapid Urbanisation | +1.8% | Java-centric, Jakarta metropolitan area | Medium term (2-4 years) |
| Government EV Incentives | +1.5% | National, early adoption in Jakarta, Surabaya | Long term (≥ 4 years) |
| High Smartphone / E-Wallet Penetration | +1.2% | National, urban concentration | Short term (≤ 2 years) |
| Public-Transport Integration Boosts First | +0.9% | Jakarta, Bandung, Surabaya | Medium term (2-4 years) |
| Dense Battery-Swap Station Roll-Out Along Ojek Corridors | +0.8% | Jabodetabek, expanding to major cities | Long term (≥ 4 years) |
| Subscription Bundles For SME Employee | +0.6% | Urban centers, industrial zones | Medium term (2-4 years) |
| Source: Mordor Intelligence | |||
Rapid Urbanization & Chronic Traffic Congestion
In 2024, Jakarta drivers spent hours stuck in traffic, marking a significant increase in congestion compared to 2023. This delay ranked Jakarta as the tenth most congested city worldwide. Such traffic woes keep on-demand mobility at the forefront of commuters' minds, increasingly seeking time savings through optimized routing. With Indonesia boasting a high urbanization rate, demand is heavily concentrated in Java, the epicenter of the country's ride-hailing market. In July 2024, new toll roads, including the Cimanggis-Cibitung corridor, opened up previously underserved suburbs. However, these routes still direct riders back into the city's congested core. While fuel prices are set to rise due to subsidy reforms announced in September 2025, shared two-wheeler rides continue to be a cost-effective choice for daily commuters, solidifying their habitual use.
Government EV Incentives For Two-Wheel Ride-Hailing Fleets
Indonesia's roadmap to achieving net-zero emissions by 2060 includes tax incentives and subsidies for fleets transitioning to electric motorcycles. In the first half of 2025, electric vehicles (EVs) made up a significant portion of active two-wheelers in ride-hailing, a figure that has doubled, in part due to Grab's fleet of electric vehicles, which has successfully reduced CO₂ emissions. With battery-swap stations established nationwide, mostly in Java, charging downtimes are minimized, leading to increased vehicle utilization. Additionally, regulations set by the Ministry of Transportation ensure standardized safety measures and conversion protocols.
High Smartphone / E-Wallet Penetration
With multiple internet users and mobile connections, Indonesia’s app-centric population provides the digital rails for the Indonesian ride-hailing market. QRIS standards and e-wallet ubiquity enable cashless transactions that shorten booking flows and support dynamic pricing [1]. GoPay surpassed 20 million downloads by March 2024, illustrating the cross-sell potential between fintech and mobility. Government API standardization through Telkomsel’s CAMARA-compliant framework further lowers integration costs for third-party developers, enhancing feature velocity on ride-hailing super-apps.
Public-Transport Integration Boosts First / Last-Mile Demand
In its inaugural month, Gojek's GoTransit partnership with KRL commuter rail saw a remarkable trip surge. Many GoRide journeys in Jakarta commence or conclude at a train or bus station. The JakLingko integrated fare card and an MRT ridership boasting millions of monthly users channel untapped demand into multi-modal journeys. Data-sharing agreements, formalized through provincial MOUs in June 2025, empower ride-hailing platforms with enhanced insights into peak-hour flows, enabling them to allocate incentives strategically.
Restraints Impact Analysis*
| Restraint | (~) % Impact on CAGR Forecast | Geographic Relevance | Impact Timeline |
|---|---|---|---|
| Price-War Duopoly and Looming Grab–Goto Consolidation Scrutiny | -1.1% | National, regulatory focus on Jakarta | Short term (≤ 2 years) |
| Driver Protests and Regulator-Capped Commissions Squeeze Margins | -0.8% | Urban centers, strongest in Jakarta | Medium term (2-4 years) |
| Swappable-Battery Quality Issues | -0.6% | Java-centric, battery-swap station locations | Medium term (2-4 years) |
| Patchy 4G/5G Coverage Outside Java | -0.4% | Outer islands, rural areas beyond Java | Long term (≥ 4 years) |
| Source: Mordor Intelligence | |||
Swappable-Battery Quality Issues Cause Service Downtime
Battery swap networks are grappling with higher failure rates than traditional plug-in chargers. This discrepancy results in unexpected downtimes, adversely affecting drivers' earnings and the overall reliability of the platform. A pilot project by Oyika in Jakarta underscores the vulnerability of these systems; a single station's failure during peak hours can send ripples through the entire network, disrupting services for riders.
These outages resonate even more in Java, where most swap sites are located. The involvement of proprietary batteries from suppliers such as SWAP Energy, Volta Indonesia, and Electrum adds another layer of complexity to quality control. As the Ministry of Transportation works on drafting safety regulations, operators are left in a lurch, uncertain about the potential retroactive compliance costs. This ambiguity poses a risk of temporary halts in network operations as they scramble to make necessary upgrades.
Patchy 4G/5G Coverage Outside Java Limits App Bookings
For ride-hailing services, consistent connectivity is paramount for GPS navigation, pricing accuracy, and seamless cashless transactions. However, network quality takes a hit outside the bustling region of Java. The outer islands grapple with sporadic 4G connectivity and a scarcity of 5G, leading to user frustrations and a dip in driver acceptance rates. While Telkomsel concentrates its efforts on urban areas within Java, rural regions are left waiting. As a result, ride-hailing platforms are strategically focusing on areas with reliable connectivity, inadvertently stunting growth in provinces that remain underserved. Although the government is making strides to address the digital divide, progress has been sluggish. This delay means that expansions into the outer islands hinge on the outcomes of future spectrum auctions and the construction of new towers.
*Our forecasts treat driver/restraint impacts as directional, not additive. The impact forecasts reflect baseline growth, mix effects, and variable interactions.
Segment Analysis
By Vehicle Type: Two-Wheelers Anchor Mass Mobility
Two-wheelers captured 63.12% of Indonesia's ride-hailing market share in 2025 as nimble motorcycles navigate Jakarta’s average speeds more effectively than cars. The segment is projected to grow at a 7.08% CAGR, outpacing the broader Indonesia ride-hailing market through 2031. Internal combustion engine (ICE) bikes lead the market in volume. Yet, electric scooters are carving out a significant niche in the active ride-hailing arena. These scooters outpace traditional four-wheelers, completing notably more trips on average. Adoption lags in rural areas, but suburban regions are witnessing robust growth, fueled by enhanced connectivity from new toll-road infrastructure. This growth spurt opens doors for two-wheeler operators to tap into rising demand.
Vans, MPVs, and minibuses serve demand for niche group travel and airport shuttles. Passenger cars cater to comfort-seeking users on longer intra-city routes, but traffic and parking constraints keep growth muted. Three-wheelers and buses remain peripheral to the Indonesian ride-hailing market, constrained by regulatory licensing and low consumer familiarity.

By Propulsion Type: Electric Momentum Builds
Internal-combustion engines retained 99.18% of the Indonesian ride-hailing market size in 2025 but face gradual displacement. Battery-electric rides are forecast to post a 7.13% CAGR to 2031, reinforced by tax waivers and falling battery costs. Under Indonesia's Permenhub No. 39/2023, government-approved ICE-to-EV conversion kits have slashed the upfront costs for drivers, paving the way for broader electrification. At the same time, battery-swap-ready scooters from companies like Electrum and NIU are cutting down downtime by avoiding lengthy charging sessions.
While hybrid two-wheelers boast technological promise, their higher purchase price is likely to keep them as a niche solution, overshadowing the operational savings they provide. On the other hand, CNG and LPG alternatives are only gaining traction in certain areas, primarily limited by the presence of localized refueling infrastructure.
By Service Type: E-Hailing Dominance, Robo-Taxi Emergence
E-hailing held 86.05% of the Indonesian ride-hailing market share in 2025, thanks to established brand familiarity and wide driver networks. Autonomous pilots such as Grab’s low-speed shuttle trials push robo-taxis toward a 7.15% CAGR, though volumes remain embryonic.
Peer-to-peer car-sharing suffers from insurance hurdles, while monthly ride packages find traction among enterprise clients seeking budget certainty. AI-driven matching engines and fraud detection boost service reliability, keeping incumbent platforms sticky even as entrants tout novel propositions.
By Booking Channel: Apps Solidify Pre-Eminence
App channels processed 87.10% of the Indonesian ride-hailing market size in 2025 and are projected to grow at a 7.14% CAGR. Features like predictive ETA, multi-modal trip planning, and embedded BNPL options significantly boost user engagement by offering convenience and flexibility. While phone bookings remain common among digitally excluded groups, their prevalence wanes with the rise of affordable smartphones in rural regions, enabling broader digital adoption. With the adoption of CAMARA-standard APIs bolstering security, financial institutions are increasingly integrating mobility services into their super-apps. This integration not only enhances user experience but also amplifies the dominance of app-based services in the mobility market.
By End-User: Corporate Segment Accelerates
Personal riders formed 76.85% of trips in 2025, but corporate/institutional demand is expanding fastest at 7.16% CAGR. Companies replace fleet leases with on-demand mobility to reduce parking costs and simplify expense reconciliation. GoCorp and emerging white-label ride solutions integrate HR systems, offering policy-based booking controls and centralized invoicing.
Sector-specific use cases—from patient transfers in healthcare to test-drive pickups in automotive—multiply addressable B2B volumes. The Indonesian ride-hailing industry benefits from this diversification as corporate customers exhibit higher ride frequency and stickier contracts.
Geography Analysis
Java accounts for most rides, infrastructure, and revenue, reflecting three-fifths of swap-station deployments and the densest smartphone penetration. Jakarta alone generated the largest share of the Indonesian ride-hailing market size in 2025, propelled by congestion hours annually that incentivize shared trips. MRT and TransJakarta hubs act as multipliers, with 1-in-5 GoRide journeys now linked to rail or bus nodes .
Secondary hubs such as Surabaya and Bandung record double-digit trip growth on the back of new arterial roads and widening 4G/5G coverage. Battery-swap networks have started branching into these cities, shortening adoption lags compared with Jakarta’s early EV roll-out.
Outer-island provinces remain relatively underpenetrated due to sparse populations and limited digital infrastructure, yet targeted scholarship programs have seeded driver supply in multiple smaller cities. Government road projects that cut travel times—like the Cimanggis-Cibitung link—extend platform viability into suburban districts, rebalancing geographic revenue concentration over time.
Regulatory Landscape
Indonesia has tightened oversight of online motorcycle taxis (ojol) through a new fee regime. Presidential Regulation (Perpres) No. 27/2026 sets a maximum 8% platform commission for motorcycle ride-hailing, effective July 1, 2026, with the Ministry of Transportation operationalizing enforcement via Decision KP-PHB 532/2026. The cap applies to two-wheeler services, and the government has communicated fare stability for basic services, leaving more room for premium offerings.
Regulation is also expanding into platform governance and worker protections. A Trade Ministry regulation dated June 4, 2026 placed ride-hailing platforms under the PMSE (Electronic Systems Trading Activities) umbrella, requiring permitting and greater transparency around platform fees. Separately, Indonesia’s legislature has discussed amendments to the Road Traffic and Transportation Law (UU LLAJ) to recognize ride-hailing motorcycles as public transportation, with the policy direction including stronger obligations around driver welfare such as accident and health insurance coverage.
Value Chain Analysis
The value chain is organized around multi-sided platforms (Gojek, Grab, Maxim, inDrive, and others) that aggregate demand via apps, match riders and drivers through dispatch algorithms, and process payments largely through integrated e-wallet rails, such as GoPay in the GoTo ecosystem. Drivers and vehicle supply are the main service layer, covering motorcycle and car owner-operators, while vehicle OEMs and EV ecosystem players, including battery-swap networks and conversion-kit providers, support fleet availability and uptime, especially in Java where swap infrastructure is densest.
In 2026, monetization and cost allocation across the chain shifted under policy changes. The 8% commission cap on motorcycle ride-hailing, with drivers retaining 92% of fare revenue, compresses platform take rates and increases reliance on adjacent revenue streams, including payments, financial services, and B2B programs, alongside operational efficiency. Compliance also increases the need to formalize driver protection costs, including mandated insurance coverage, which becomes part of unit economics alongside incentives, customer support, safety operations, and partnerships with local authorities for enforcement and traffic-safety programs.
Competitive Landscape
In Indonesia's ride-hailing arena, companies such as GoTo and Grab reign supreme, and their combined heft creates network effects that ward off potential challengers. In 2024, both companies pivoted from offering volume subsidies to honing in on take-rate optimization. By Q3 2024, GoTo boasted an adjusted EBITDA while witnessing an uptick in on-demand GTV. Meanwhile, Grab is weaving a multi-vertical tapestry, intertwining mobility, food delivery, and payment services to amplify user lifetime value.
Technology is now the primary battleground. GoTo’s Bahasa-native Sahabat-AI engine personalizes promotions, whereas Grab deploys machine-learning models to predict demand spikes and pre-position drivers, compressing waiting times. InDrive differentiates with rider-driver fare negotiation and a commission ceiling below 10%, attracting cost-sensitive drivers [3]. Xanh SM’s December 2024 EV taxi launch introduces a sustainability-led narrative that appeals to corporates with ESG targets.
Regulators enforce one-fifth commission caps plus mandatory welfare contributions, preserving room for challenger models yet limiting pricing wars. Antitrust oversight of potential consolidation keeps strategic options fluid; any merger would trigger stringent remedies, ensuring the Indonesian ride-hailing market remains contestable even as incumbents edge toward profitability.
Indonesia Ride Hailing Industry Leaders
-
PT Aplikasi Karya Anak Bangsa (Gojek)
-
Grab Holdings Inc.
-
Maxim Rides Indonesia
-
inDrive
-
Blue Bird Group (MyBluebird)
- *Disclaimer: Major Players sorted in no particular order
Market Opportunities and Future Outlook
Regulatory formalization creates whitespace for driver-focused financial services, training, and compliance tooling. As policymakers move to classify ride-hailing motorcycles closer to public transportation and position drivers as micro-entrepreneurs, programs such as KUR (People’s Business Credit), including unsecured loans up to Rp 100 million, offer a clearer pathway for platforms and partners to bundle vehicle financing, insurance, and maintenance packages for drivers. The same structure can be applied to electrification, where upfront vehicle cost and downtime are persistent barriers, by tying credit terms to standardized service networks.
The July 2026 8% commission ceiling for motorcycle ride-hailing also narrows fee-based differentiation among platforms and shifts competition toward service quality, safety, and broader ecosystem integration (payments and wider super-app services). In parallel, the June 4, 2026 Trade Ministry recognition for ride-hailing platforms under PMSE brings additional platform-governance requirements, including fee transparency, and reinforces commercial adjacency through digital-trade rules that prioritize visibility for local MSME products within platforms, supporting new merchant monetization models alongside mobility demand in dense urban corridors.
Recent Industry Developments
- July 2026: Gojek, Grab, Maxim and other platforms commenced implementation of an 8% maximum commission cap for motorcycle ride-hailing services nationwide, effective July 1, 2026. The change tightens margins for platforms that rely on driver incentives, while reducing near-term price competition.
- June 2026: GoTo, Grab, Maxim, inDrive, Blue Bird Group launched the Jakarta Ojol Pelopor KITA safety program with authorities. The collaboration strengthens safety branding and could affect operating costs and driver engagement, potentially differentiating platforms in a crowded market.
- April 2026: Indah Logistik Group (Josal) expanded ride-hailing services in the Mamminasata urban area (Makassar, Maros, Sungguminasa, Takalar). The expansion increases city coverage, adds competitive pressure in Makassar, and broadens network effects and partnerships.
Research Methodology Framework and Report Scope
Market Definition and Coverage
For this study, the market is defined as the value generated from app-based passenger ride-hailing trips within Indonesia, covering bookings that match riders with drivers and complete paid passenger journeys.
Scope exclusions: This sizing excludes food delivery, parcel delivery, and other non-passenger on-demand services even when they are offered inside the same super-app.
Segmentation Overview
- By Vehicle Type
- Two-Wheelers
- Three-Wheelers
- Passenger Cars
- Vans & MPVs
- Buses & Shuttles
- By Propulsion Type
- Internal-Combustion (ICE)
- Hybrid
- Battery-Electric
- CNG / LPG
- By Service Type
- E-Hailing
- Car-Sharing (Peer-to-Peer)
- Robo-Taxi
- Subscription-Based Ride Packages
- By Booking Channel
- App-Based
- Phone
- By End-User
- Personal
- Corporate / Institutional
Data Sources, Market Sizing, and Validation
Desk Research
Desk research is used to set the basic shape of demand and supply before modeling starts, so we are not guessing volumes, pricing, or policy effects. Public sources were reviewed for mobility indicators, inflation and fuel context, and digital adoption, using references such as Statistics Indonesia (BPS), Bank Indonesia, the Ministry of Transportation, and the World Bank, along with city-level transport agencies where available.
We also screened company filings, investor presentations, reputable press coverage, association publications, and academic papers on urban mobility and platform work to cross-check take rates, incentive patterns, and pricing moves. For structured validation, we used paid subscriptions for company financials and news intelligence, plus patent databases to track electrification and app feature direction where it impacts operating cost. This desk research list is illustrative only, and many other public sources were used for data collection, validation, and clarification.
Primary Interviews and Surveys
Primary work focused on validating what matters most to value sizing, which is ride frequency, typical fare levels, platform commissions, and incentive intensity by city and by rider cohort. We spoke with a mix of operators, driver groups, fleet partners, and mobility ecosystem experts, and then used surveys to confirm how booking behavior and payment methods are shifting across major urban centers and secondary cities.
To reduce over-reliance on any single viewpoint, assumptions were revisited when large gaps appeared between desk signals and interview inputs, and follow-up checks were done to pin down the most realistic base case.
Distribution of primary research fieldwork respondents
| Company type | Respondent position |
|---|---|
| Top tier: 34% | CXOs: 12% |
| Mid tier: 52% | Functional/Unit leaders: 36% |
| Smaller Players: 14% | Managers: 52% |
Market-Sizing & Forecasting
Sizing starts with a top-down demand pool build where trip demand is reconstructed from urban population concentration, smartphone and digital payment penetration, and observed usage intensity from primary checks, which is then translated into value using average fare per trip and platform commission structure. After that, the output is corroborated with selective bottom-up approximations using sampled city-level trip density checks, inferred driver earnings ranges, and platform revenue signals from public financial disclosures, and then totals are adjusted if the two views do not line up.
Inputs that were tracked include average trip distance in dense cities, peak versus off-peak pricing behavior, changes in fuel and vehicle operating costs that affect fare floors, the share of two-wheeler versus four-wheeler rides, and the mix of cash versus digital payments as it influences realized pricing and promotions. When localized data is missing for smaller cities, gaps are handled by using calibrated ratios from similar city clusters and then re-checking them through expert feedback.
For forecasting, scenario analysis is used because regulation, incentive pullbacks, and electrification pace can move pricing and trip growth differently year to year. The scenarios are anchored to a base case validated in interviews, and they are stress-tested against macro indicators such as inflation, household spending signals, and mobility substitution trends.
Data Validation & Update Cycle
Validation is done through several layers so that outliers do not quietly flow into the final number. Model outputs are checked against independent signals such as mobility demand discussions in public sources, reported platform performance direction, and any visible pricing resets, and then the biggest variances are investigated before sign-off.
Where a figure looks inconsistent, assumptions are revisited, and targeted re-contacts are triggered to confirm whether the change is real or simply a timing or definition issue. Reports are refreshed annually, and interim updates are made when material events occur that can shift demand, fare levels, or commission behavior. Before delivery, an analyst performs a fresh pass to ensure clients receive the most current view.
Mordor Intelligence's Indonesia Ride Hailing Market Sizing Compared With Other Published Estimates
Published numbers for Indonesia ride-hailing can look far apart because the label is used differently across sources, and the underlying metric can shift between platform revenue, total rider spend, or a broader super-app transaction value. Differences also come from how aggressively promotions are treated, whether cash-based trips are assumed to be fully captured, and how currency timing is handled when converting to USD.
The biggest gap driver in this market is scope and metric choice, since some estimates fold online transportation together with food delivery under an "ojol" GMV view, which inflates the total versus passenger-only ride value. Another recurring driver is refresh cadence, where recent fare and incentive normalization changes can move the base year, a spread explained by counting only completed passenger ride transactions and separating GMV from revenue in the model, as applied by Mordor Intelligence.
Benchmark comparison
| Source | Market Size | Gaps in Research Methodology |
|---|---|---|
| Mordor Intelligence | USD 3.77 B (2025) | |
| Policy Think Tank A | USD 3.51 B (2024) | Often presented as estimated annual industry revenue for an earlier year, which can understate value if fare increases and post-2024 trip recovery are not rolled forward consistently. |
| Digital Economy Tracker B | USD 9.00 B (2024) | Uses GMV for combined online transportation and food delivery, so the number reflects broader transaction value rather than passenger ride-hailing value only. |
The comparison shows that most of the spread is explainable once you separate passenger ride value from broader GMV, and once the base year is aligned to the same pricing and incentive environment. By keeping the inputs tied to trip demand and realized fare assumptions that can be re-checked, the estimate stays transparent and repeatable for planning.
Key Questions Answered in the Report
How large is the Indonesian ride-hailing market in 2026?
The Indonesian ride-hailing market size is USD 4.04 billion in 2026, with a 7.05% CAGR outlook to 2031.
Which vehicle type dominates ride-hailing in Indonesia?
Two-wheelers lead with 63.12% share in 2025, favored for maneuverability in congested streets.
What is driving electric vehicle adoption in Indonesian ride-hailing?
Government tax waivers, battery-swap roll-outs, and operator cost savings propel a 7.13% CAGR for electric rides.
How are corporate users shaping demand?
Corporate and institutional clients purchasing subscription bundles are the fastest-growing segment at 7.16% CAGR through 2031.
Which booking channel is preferred by Indonesian riders?
App-based bookings command 87.10% of transactions, thanks to cashless payments and real-time tracking.
Are autonomous taxis a realistic near-term prospect in Indonesia?
Robo-taxis are in pilot phase but are forecast to post a 7.15% CAGR, supported by growing consumer familiarity and evolving regulations.