
Market Overview
| Study Period | 2021 - 2031 |
|---|---|
| Forecast Data Period | 2026 - 2031 |
| Base Year Market Size (2025) | USD 1.04 Billion |
| Market Size (2026) | USD 1.11 Billion |
| Market Size (2031) | USD 1.56 Billion |
| Growth Rate (2026 - 2031) | 6.94 % |
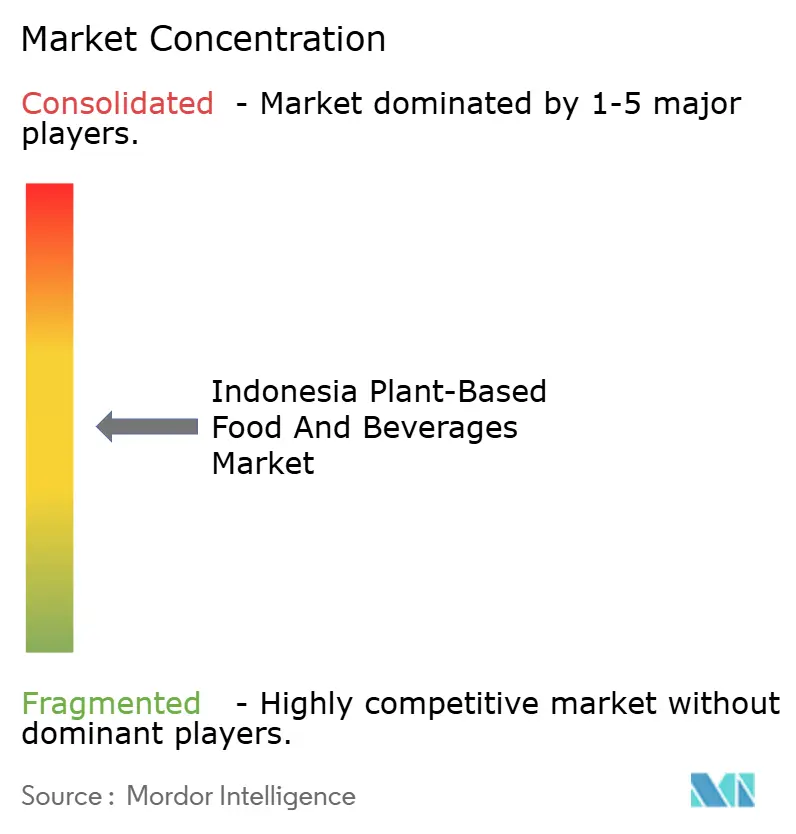
| Market Concentration | Medium |
Major Players *Disclaimer: Major Players sorted in no particular order Image © Mordor Intelligence. Reuse requires attribution under CC BY 4.0. | |
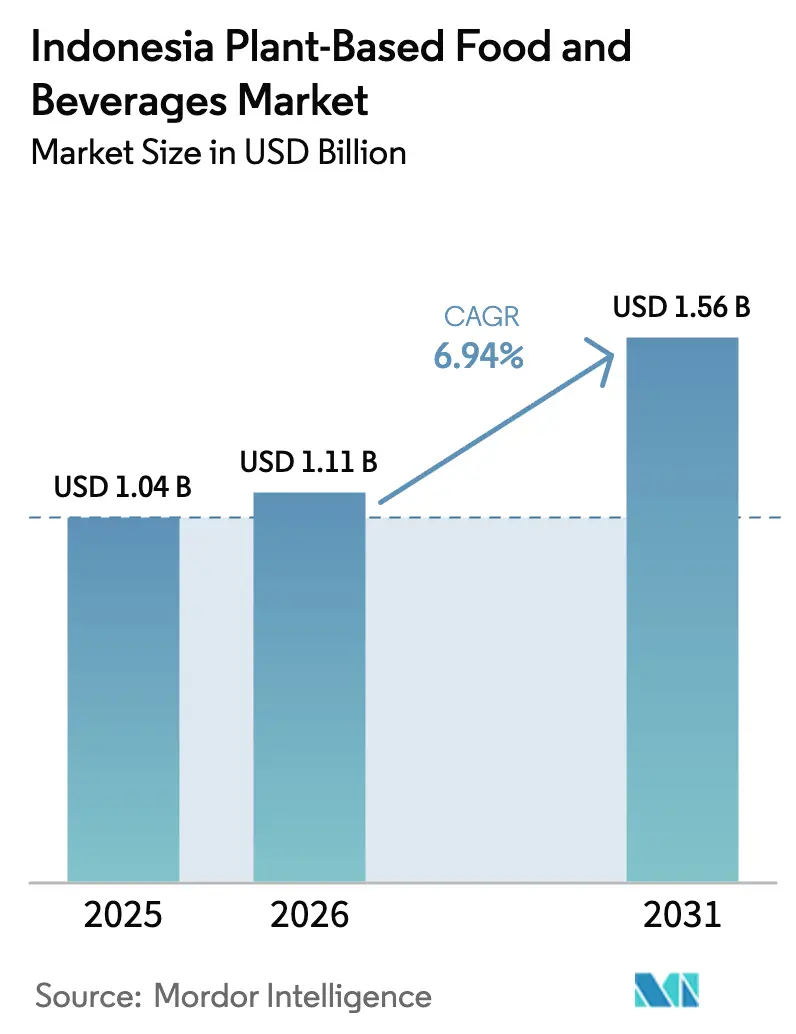
Indonesia Plant-Based Food And Beverages Market Analysis by Mordor Intelligence
Indonesia plant-based food and beverages market size in 2026 is estimated at USD 1.11 billion, growing from 2025 value of USD 1.04 billion with 2031 projections showing USD 1.56 billion, growing at 6.94% CAGR over 2026-2031. This growth trajectory reflects Indonesia's unique position as the world's largest Muslim-majority nation embracing plant-based alternatives while navigating complex halal certification requirements and deeply rooted culinary traditions. The market's expansion coincides with Indonesia's broader food security initiatives, as the government pursues agricultural self-sufficiency through its Swasembada Pangan program, targeting increased domestic production of key commodities, including soybeans and other plant proteins [1]. Dairy-alternative beverages hold the largest revenue share, while meat substitutes post the fastest growth as local innovators scale through food-service partnerships. Ingredient diversification beyond soy, an improving cold-chain network, and the integration of halal compliance into product design further sustain growth momentum. Competition remains fragmented, creating room for regional specialists to flourish alongside global multinationals.
Key Report Takeaways
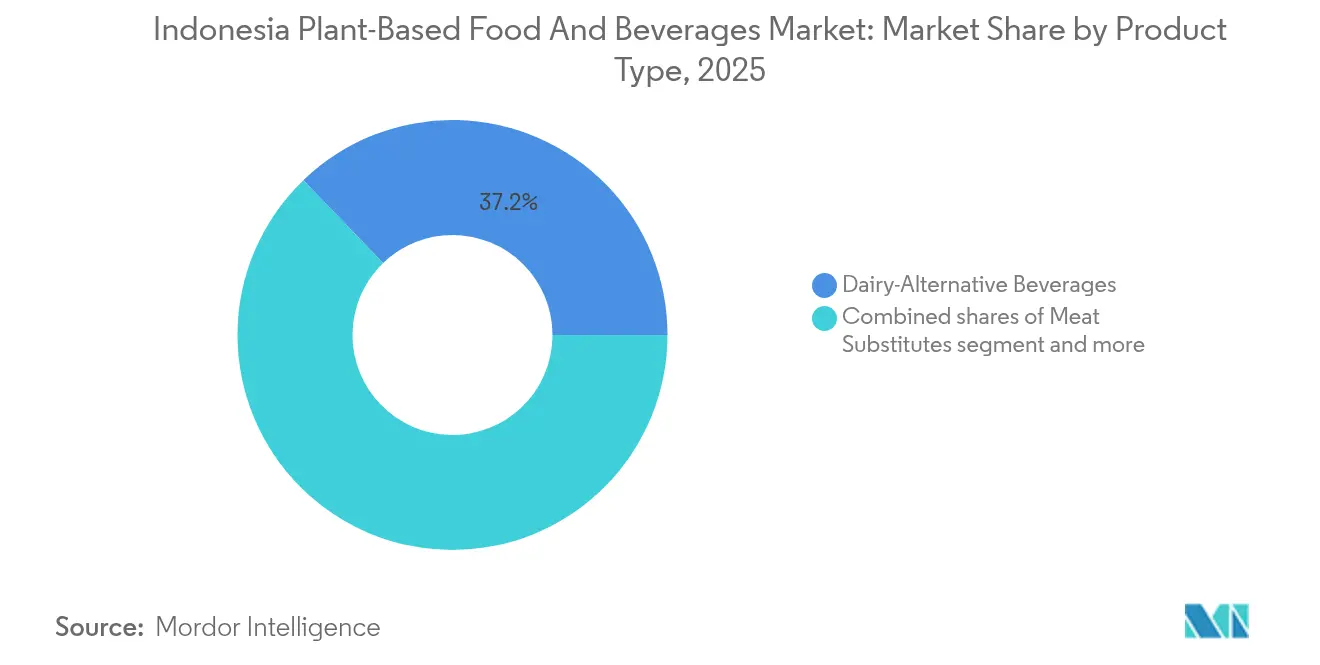
- By product type, dairy-alternative beverages led with a 37.20% revenue share in 2025, whereas meat substitutes are projected to grow at a 7.02% CAGR through 2031.
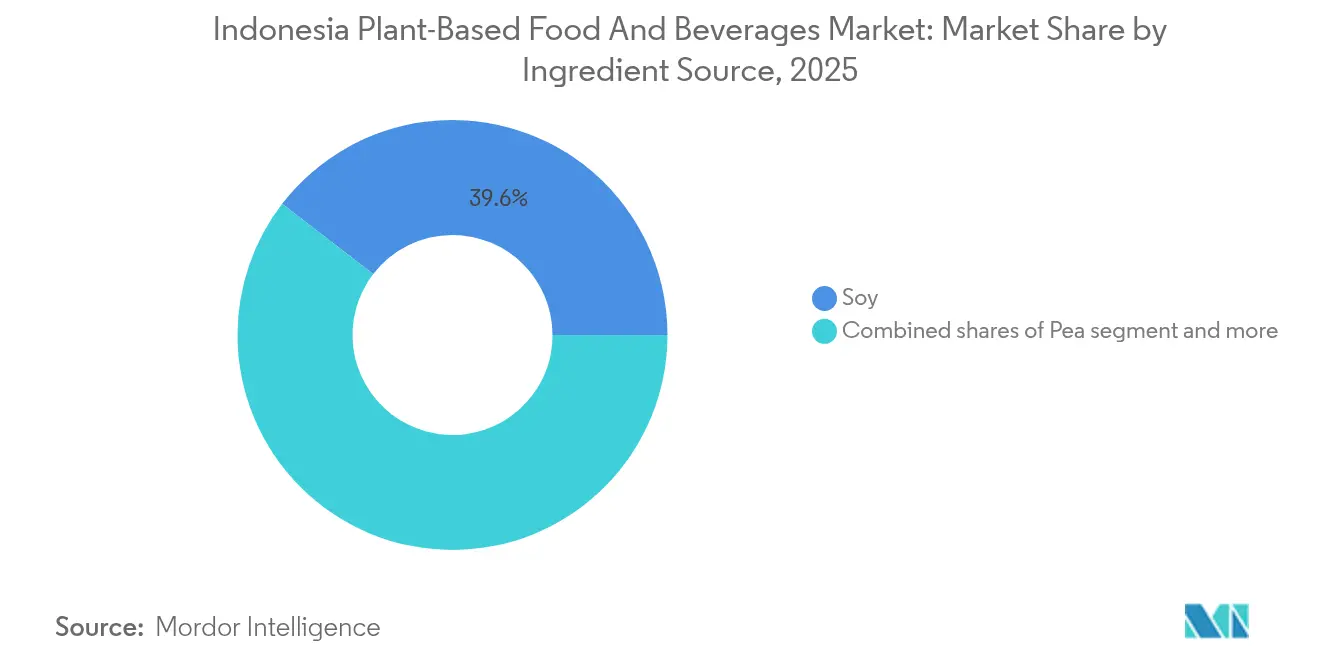
- By ingredient source, soy commanded 39.56% of the Indonesia plant-based food market share in 2025, while pea protein is forecast to expand at a 7.07% CAGR to 2031.
- By form, chilled / shelf-stable products accounted for 85.27% of the Indonesia plant-based food market size in 2025 and frozen offerings are set to progress at a 7.34% CAGR over the forecast period.
- By distribution channel, off-trade outlets captured 53.98% of sales in 2025 as on-trade venues register a 6.35% growth trajectory toward 2031.
- By geography, Western Indonesia held 64.57% of 2025 revenue, whereas Eastern Indonesia is poised for a 6.62% CAGR to 2031.
Note: Market size and forecast figures in this report are generated using Mordor Intelligence’s proprietary estimation framework, updated with the latest available data and insights as of 2026.
Market Trends and Insights
Drivers Impact Analysis of Indonesia Plant-Based Food And Beverages Market*
| Driver | (~) % Impact on CAGR Forecast | Geographic Relevance | Impact Timeline |
|---|---|---|---|
| Growing consumer health and wellness awareness | + 1.8% | National, concentrated in urban Java and Sumatra | Medium term (2-4 years) |
| Rising ethical concerns for animal welfare | + 1.2% | Urban centers in Western Indonesia, emerging in Eastern regions | Long term (≥ 4 years) |
| Advances in product innovation and quality | + 1.5% | National, with R&D centers in Java | Short term (≤ 2 years) |
| Supportive government policies and initiatives | + 1.0% | National, with pilot programs in rural areas | Long term (≥ 4 years) |
| Cultural acceptance of plant-based foods | + 0.8% | Regional variations, stronger in Javanese and Sundanese areas | Long term (≥ 4 years) |
| Rise of food technology startups | + 0.7% | Concentrated in Jakarta and Bandung tech hubs | Medium term (2-4 years) |
| Source: Mordor Intelligence | |||
Growing Consumer Health and Wellness Awareness
Indonesia's health consciousness surge directly correlates with rising non-communicable disease prevalence, particularly diabetes and cardiovascular conditions affecting urban populations. The government's promotion of plant-based diets through official health ministry communications positions plant-forward nutrition as a preventive healthcare strategy, creating institutional legitimacy for alternative proteins. This health-driven demand particularly benefits dairy alternatives, as lactose intolerance affects 90% of Indonesians, making plant-based milk a functional necessity rather than lifestyle choice. Urban millennials and Gen Z consumers increasingly view plant-based foods as premium wellness products, willing to pay higher prices for perceived health benefits. The trend accelerates in Java's metropolitan areas where healthcare access and nutritional education create informed consumer bases. However, rural populations remain price-sensitive, requiring affordable plant-based options to achieve mass market penetration.
Rising Ethical Concerns for Animal Welfare
Animal welfare consciousness emerges gradually within Indonesia's predominantly Muslim population, where halal dietary requirements already emphasize humane treatment principles. Urban educated consumers increasingly question industrial livestock practices, creating demand for ethically produced alternatives that align with Islamic values of compassion toward animals. This ethical shift particularly influences younger demographics exposed to global sustainability narratives through social media and international education. The trend gains momentum in cosmopolitan cities like Jakarta and Surabaya, where exposure to international food cultures normalizes plant-based choices. Local Islamic scholars' endorsements of plant-based foods as inherently halal eliminate religious barriers, potentially accelerating adoption among devout consumers. The movement remains nascent compared to Western markets but shows potential for significant growth as environmental and ethical awareness expands.
Advances in Product Innovation and Quality
Indonesian food technology companies achieve breakthrough improvements in taste and texture, addressing the primary consumer barrier to plant-based adoption. Local startups leverage traditional Indonesian ingredients like tempeh and tofu expertise to create familiar flavor profiles in novel formats, exemplified by Green Rebel's rendang-flavored plant-based products that resonate with local palates. The integration of traditional spice blends and cooking techniques into modern plant-based formulations creates competitive advantages over international brands lacking local culinary knowledge. Research institutions like IPB University collaborate with industry players to develop functional foods using indigenous plant sources, creating intellectual property advantages for domestic manufacturers. Manufacturing process improvements reduce production costs while maintaining quality, making plant-based products more accessible to price-conscious Indonesian consumers. Technology transfer from established food companies accelerates innovation cycles, enabling rapid product iteration and market responsiveness.
Supportive Government Policies and Initiatives
Indonesia's food self-sufficiency agenda indirectly supports plant-based food development through agricultural diversification initiatives and reduced import dependency goals. The Ministry of Agriculture's focus on increasing domestic soybean production creates favorable conditions for plant-protein industries, while environmental sustainability mandates encourage alternatives to resource-intensive animal agriculture. Government nutrition programs emphasizing dietary diversity create institutional demand for plant-based options in school feeding and public health initiatives. Regulatory clarity from BPOM regarding plant-based food labeling and safety standards reduces market entry barriers for manufacturers, while halal certification streamlines provide consumer confidence. The Coordinating Ministry for Food Affairs' promotion of environmentally friendly agricultural systems aligns with plant-based industry growth objectives [2]. However, implementation remains inconsistent across regions, requiring sustained policy commitment to achieve meaningful market impact.
Restraints Impact Analysis of Indonesia Plant-Based Food And Beverages Market*
| Restraint | (~) % Impact on CAGR Forecast | Geographic Relevance | Impact Timeline |
|---|---|---|---|
| Consumer hesitation over taste and texture | -1.5% | National, particularly in traditional food regions | Short term (≤ 2 years) |
| Challenges in raw material supply chains | -1.2% | National, acute in Eastern Indonesia | Medium term (2-4 years) |
| Regulatory and certification barriers | -0.8% | National, complex in multi-island geography | Long term (≥ 4 years) |
| Limited awareness among certain populations | -0.9% | Rural areas and Eastern Indonesia provinces | Medium term (2-4 years) |
| Source: Mordor Intelligence | |||
Consumer Hesitation over Taste and Texture
Indonesian consumers maintain strong preferences for traditional food textures and flavors, creating significant barriers for plant-based alternatives that fail to replicate familiar sensory experiences. Academic research reveals that taste and texture rank as primary factors determining plant-based food acceptance among Indonesian consumers, with products requiring extensive formulation work to match local palate expectations. The challenge intensifies in regions with distinct culinary traditions, where consumers expect specific mouthfeel characteristics in meat and dairy products developed over generations. Plant-based manufacturers must invest heavily in R&D to achieve acceptable organoleptic properties, increasing product development costs and time-to-market. Regional taste preferences vary significantly across Indonesia's diverse archipelago, requiring localized product formulations that complicate manufacturing and distribution strategies. Success depends on achieving sensory parity with conventional products while maintaining cost competitiveness, a technical challenge that continues to limit market penetration rates.
Challenges in Raw Material Supply Chains
Indonesia's heavy reliance on imported soybeans, comprising over 80% of domestic consumption, creates vulnerability to global price volatility and supply disruptions that directly impact plant-based food costs. Domestic agricultural capacity remains insufficient to meet growing plant-protein demand, while climate variability affects local crop yields and quality consistency required for food manufacturing. The archipelagic geography complicates ingredient distribution, particularly to Eastern Indonesia regions where transportation costs significantly increase raw material expenses. Limited cold chain infrastructure in remote areas restricts the use of perishable plant-based ingredients, forcing manufacturers to rely on processed alternatives that may compromise product quality. Supply chain inefficiencies become more pronounced during peak demand periods, creating inventory management challenges for plant-based food companies. Developing reliable domestic supply sources requires substantial agricultural investment and farmer education programs that extend beyond individual company capabilities.
*Our forecasts treat driver/restraint impacts as directional, not additive. The impact forecasts reflect baseline growth, mix effects, and variable interactions.
Indonesia Plant-Based Food And Beverages Market Segment Analysis
By Product Type:
Beverages Lead Innovation WaveDairy-alternative beverages command 37.20% market share in 2025, driven by Indonesia's high lactose intolerance prevalence and expanding coffee culture in urban centers. Oatside's successful market entry demonstrates how localized product development creates competitive advantages, with the company's chocolate malt variant specifically targeting Indonesian teenagers and achieving significant social media engagement through partnerships with local schools. Meat substitutes emerge as the fastest-growing segment at 7.02% CAGR through 2031, benefiting from Green Rebel's strategic partnerships with major food service chains and innovative products like rendang-flavored plant-based options that resonate with local tastes.
Non-dairy ice cream and frozen desserts gain traction in premium urban markets, while non-dairy cheese and yogurt segments remain nascent due to limited local consumption habits and higher price points. Plant-based spreads and butters show potential for growth, particularly in Bali's tourism-driven market where international dietary preferences influence local food trends. The packaged milk subcategory within dairy alternatives benefits from established distribution networks and consumer familiarity, while coffee and tea applications drive innovation in barista-grade formulations designed for Indonesia's thriving cafe culture.

By Ingredient Source:
Diversification Beyond Soy DominanceSoy maintains 39.56% market share in 2025, leveraging Indonesia's traditional tempeh and tofu expertise, though import dependency creates supply chain vulnerabilities that manufacturers increasingly address through diversification strategies. Pea protein emerges as the fastest-growing ingredient source at 7.07% CAGR through 2031, offering superior functional properties and reduced allergenicity compared to soy-based alternatives. Oat-based products gain momentum through brands like Oatside, which sources Australian oats to ensure consistent quality while building local production capabilities in Java.
Coconut-based ingredients benefit from Indonesia's position as a major global coconut producer, providing cost advantages and supply security for manufacturers developing tropical-flavored products. Rice and wheat ingredients serve niche applications, particularly in gluten-free formulations targeting health-conscious urban consumers. Almond-based products face challenges due to import requirements and higher costs, limiting market penetration to premium segments. The diversification trend reflects manufacturers' strategic efforts to reduce single-ingredient dependency while creating unique value propositions tailored to local taste preferences and supply chain realities.
By Form:
Shelf-Stable Dominance Reflects Infrastructure RealitiesChilled and shelf-stable products dominate with 85.27% market share in 2025, reflecting Indonesia's limited cold chain infrastructure and the practical requirements of multi-island distribution networks. This format preference enables broader geographic reach and reduces distribution costs, particularly crucial for serving Eastern Indonesia's remote markets where refrigerated transport remains challenging. Frozen products represent the fastest-growing form segment at 7.34% CAGR through 2031, driven by improving cold storage facilities in major urban centers and growing consumer acceptance of frozen convenience foods.
The shelf-stable dominance creates opportunities for innovative packaging solutions that extend product life while maintaining nutritional quality, particularly important for plant-based products prone to spoilage in tropical climates. Manufacturers invest in aseptic processing and barrier packaging technologies to achieve extended shelf life without compromising taste or texture. Frozen segment growth correlates with modern retail expansion and household freezer penetration in middle-class urban areas, where convenience increasingly drives purchase decisions. The form distribution reflects Indonesia's infrastructure development stage, with implications for product formulation strategies and market entry timing across different regions.
By Distribution Channel:
Off-Trade Channels Drive AccessibilityOff-trade channels command 53.98% market share in 2025, with supermarkets and hypermarkets serving as primary discovery points for plant-based products among Indonesian consumers. Online retail platforms experience rapid growth, particularly during the COVID-19 pandemic, creating direct-to-consumer opportunities for emerging brands lacking traditional retail relationships. Convenience and grocery stores provide crucial accessibility in dense urban areas where frequent shopping trips characterize consumer behavior patterns.
On-trade channels show promising 6.35% growth through 2031, driven by Green Rebel's successful partnerships with major restaurant chains including Starbucks, ABUBA Steak, and Pepper Lunch, which introduce plant-based options to mainstream dining experiences. Food service partnerships create trial opportunities that often translate to retail purchases, making on-trade channels valuable for brand building despite lower volume contributions. The distribution strategy reflects Indonesia's retail landscape evolution, where traditional wet markets coexist with modern formats, requiring multi-channel approaches to achieve comprehensive market coverage. E-commerce growth accelerates during 2024-2025, supported by improved logistics networks and digital payment adoption among urban millennials.
Geography Analysis
Western Indonesia's market leadership stems from concentrated urban populations in Java and Sumatra, where 64.57% market share in 2025 reflects superior purchasing power, retail infrastructure, and cultural openness to food innovation. Jakarta's cosmopolitan environment creates ideal conditions for plant-based product launches, with international food chains and modern retail formats providing distribution channels that reach affluent early adopters. The region benefits from established cold chain logistics and frequent product replenishment cycles that maintain freshness and variety, crucial factors for plant-based products with shorter shelf lives than conventional alternatives. Java's dense population centers enable efficient marketing campaigns and sampling programs that build brand awareness cost-effectively. Sundanese culinary traditions in West Java already emphasize fresh vegetables and tofu-tempeh preparations, creating cultural familiarity that reduces adoption barriers for plant-based innovations.
Eastern Indonesia represents the market's highest growth potential at 6.62% CAGR through 2031, driven by improving infrastructure and government nutrition programs targeting dietary diversification in remote areas. The region's traditional reliance on sago, tubers, and local plant proteins creates natural affinity for plant-based alternatives, though limited purchasing power requires affordable product formulations and smaller package sizes. Papua and Maluku provinces show promise as mining and palm oil industries increase local incomes while environmental awareness grows among educated populations. Distribution challenges remain significant, with inter-island shipping costs and limited cold storage requiring innovative packaging solutions and shelf-stable formulations. Government initiatives promoting food security and nutrition education create institutional demand for plant-based products in school feeding programs and healthcare facilities, providing market entry opportunities for manufacturers willing to invest in remote distribution networks. The geographic growth differential reflects Indonesia's uneven development patterns, where Western regions benefit from decades of industrial investment while Eastern territories experience rapid catch-up growth. Regional dietary studies reveal protein consumption patterns favoring plant sources in Eastern Indonesia, potentially creating faster adoption rates once distribution barriers diminish. Climate change impacts on traditional food systems in Eastern regions may accelerate demand for resilient plant-based alternatives that provide consistent nutrition despite environmental variability. The geographic expansion strategy requires understanding local food cultures, with successful brands likely to emerge from partnerships with regional distributors and community leaders who understand local preferences and consumption patterns.
Regulatory Landscape
Indonesia plant-based food and beverage products fall under the national processed food regime, which requires BPOM Marketing Authorization (Izin Edar). For domestically produced items, this is issued as BPOM RI MD, while imports use BPOM RI ML. BPOM Decree No. 70 of 2025 updated food category definitions, including classifications relevant to raw materials derived from plants or animals. This influences how plant-based SKUs are registered and labeled across categories.
Labeling conventions also shape go-to-market for plant-based dairy alternatives. Based on BPOM guidance on dairy terminology, plant-based beverages cannot be registered within dairy categories, and the term "milk" is reserved for liquid derived from mammary glands of dairy animals. As a result, brands typically rely on alternative naming, front-of-pack descriptors, and category placement decisions across modern trade and e-commerce.
Value Chain Analysis
The value chain begins with plant-protein and base-ingredient sourcing. Soy remains central, but it also exposes manufacturers to cost and availability swings because Indonesia relies heavily on imported soybeans. Brands and manufacturers respond with ingredient diversification (for example, oats and other plant sources) and by targeting locally available inputs such as mushrooms for specific product lines, alongside shelf-stable formats that fit multi-island distribution constraints.
Processing and product development focus on formulation, texturization, and packaging, followed by route-to-market execution across off-trade and on-trade channels. Foodservice platforms can accelerate trial and repeat demand for meat alternatives, with Green Rebel using major chains (for example, Starbucks, Ikea, and Domino's) to expand menu visibility. Local-focused producers such as Meatless Kingdom also emphasize local sourcing of mushrooms and soybeans to improve supply continuity and unit economics.
Competitive Landscape
The Indonesia plant-based food market exhibits moderate concentration, characterized by intense competition between established multinational corporations and agile local startups that leverage cultural insights and supply chain advantages. International giants like Nestlé, Danone, and Unilever compete through premium positioning and global R&D capabilities, while emerging Indonesian companies such as Green Rebel Foods and Meatless Kingdom gain market share through localized product development and strategic food service partnerships.
The competitive dynamics favor companies that successfully navigate Indonesia's complex regulatory environment, particularly halal certification requirements from MUI (Indonesian Ulema Council) that create entry barriers for manufacturers lacking Islamic compliance expertise. Technology adoption patterns reveal strategic differentiation opportunities, with successful players investing in local ingredient sourcing and traditional flavor integration to create products that resonate with Indonesian palates. Green Rebel's partnership expansion with major food service chains including Starbucks's 460 Indonesian locations demonstrates how distribution strategy trumps product innovation alone in achieving market penetration.
Opportunities exist in affordable plant-based options for mass market consumers, frozen product categories, and Eastern Indonesia distribution networks where infrastructure limitations create competitive moats for early entrants. The fragmented landscape enables niche players to establish regional strongholds before scaling nationally, particularly companies that understand Indonesia's diverse culinary traditions and can adapt products accordingly. Regulatory compliance factors significantly influence competitive positioning, with BPOM food safety standards and halal certification creating operational complexity that favors established players with regulatory expertise.
Indonesia Plant-Based Food And Beverages Industry Leaders
-
Amy’s Kitchen, Inc.
-
Green Rebel Foods
-
Meatless Kingdom
-
Nestlé S.A.
-
Danone S.A.
- *Disclaimer: Major Players sorted in no particular order
Indonesia Plant-Based Food And Beverages Market Companies Covered in this Report
- Amy’s Kitchen, Inc.
- Green Rebel Foods
- Meatless Kingdom
- Nestlé S.A.
- Danone S.A.
- Beyond Meat Inc.
- Impossible Foods Inc.
- Vitasoy Int’l Holdings
- Upfield (Violife)
- Unilever plc
- The Kraft Heinz Company
- PepsiCo Inc.
- Quorn Foods
- KARANA Foods
- So Good Food (JAPFA)
- Nutrifood Indonesia
- ABC Kogen Dairy
- Oatly Group
- OmniFoods
- Mayora Indah Tbk
Read Analysis of Indonesia Plant-Based Food And Beverages Companies
Market Opportunities and Future Outlook
Mass-market expansion in dairy-alternative beverages is progressing through minimarket-led distribution and smaller pack formats, which lower trial barriers for price-sensitive consumers. Arummi Foods provides a concrete example, taking cashew milk into more than 20,000 minimarkets in 2026 and introducing a 200 ml grab-and-go format, showing how alternative bases beyond soy and oats can gain national reach when paired with high-frequency retail.
On-trade and institutional channels also remain a key channel for accelerating adoption of meat alternatives, particularly through partnerships that place plant-based proteins into familiar menus. Green Rebel Foods raised USD 12.5 million in February 2026 (taking total capital raised to about USD 15 million) and has used large foodservice partnerships as a distribution engine across Southeast Asia. This supports scaling Indonesian-origin plant-based brands as manufacturers manage domestic supply-chain constraints and labeling compliance alongside growth.
Recent Industry Developments in Indonesia Plant-Based Food And Beverages Market
- July 2026: Arummi Foods launched a 200ml grab-and-go cashew milk format in three variants: Classic, Chocolate, and Barista. The launch expands mass-market dairy alternative options for Indonesian consumers while on-the-go access improves and unit economics for the cashew milk category are enhanced.
- June 2026: Arummi Foods expanded distribution of cashew milk to over 20,000 minimarkets across Indonesia. The expansion broadens retail penetration in mass-market channels and strengthens the national footprint, increasing consumer familiarity with cashew-based dairy.
- February 2026: Green Rebel Foods secured US$12.5 million in new investment to accelerate plant-based meat growth and scaling in Southeast Asia. The funding accelerates production capacity and market reach in the region, supporting faster expansion across SE Asia.
Indonesia Plant-Based Food And Beverages Market Report Scope and Research Methodology
Market Definition and Coverage
For this study, the market covers the value of packaged and prepared plant-based foods and beverages sold in Indonesia as substitutes for animal-based products, across retail and foodservice, measured in USD.
Scope exclusions: We exclude conventional animal-based foods, fresh unbranded homemade items, and plant ingredients sold mainly as commodities rather than as branded consumer products.
Segments Covered in This Report
- By Product Type
- Meat Substitutes
- Tofu
- Tempeh
- Others
- Dairy-Alternative Beverages
- Packaged Milk
- Packaged Smoothies
- Coffee
- Tea
- Other Plant-based Beverages
- Non-Dairy Ice-Cream and Frozen Desserts
- Non-Dairy Cheese
- Non-Dairy Yogurt
- Others
- Meat Substitutes
- By Ingredient Source
- Soy
- Almond
- Pea
- Oat
- Wheat
- Rice
- Coconut
- Other Sources
- By Form
- Chilled/Shelf-Stable
- Frozen
- By Distribution Channel
- On-Trade
- Off-Trade
- Supermarkets / Hypermarkets
- Convenience/Grocery Stores
- Online Retail Stores
- Other Distribution Channels
- By Geography
- Western Indonesia
- Eastern Indonesia
Data Sources, Market Sizing, and Validation
Desk Research
Desk research helped us set the boundaries of what counts as plant-based substitutes in Indonesia and how products flow through on-trade and off-trade channels. We reviewed public references such as Statistics Indonesia (BPS) household expenditure and consumption tables, Indonesia Customs trade statistics for relevant processed food categories, and BPOM guidance on processed food registration and labeling.
To keep assumptions realistic, we also leaned on sources such as the Ministry of Agriculture and Ministry of Industry releases on food processing activity, halal ecosystem references from MUI and BPJPH, and selected peer-reviewed nutrition and food-science journals discussing plant protein adoption in Indonesia. Company filings, investor decks, and credible press were used to sanity check product launches and distribution reach, and a paid company financials and news subscription was used to track corporate actions and reported revenue cues. These are illustrative sources only, and many other references were used to collect data, validate it, and clarify gaps.
Primary Interviews and Surveys
Primary work was used to confirm category splits, pricing ladders, and channel dynamics that are not visible in public datasets. We spoke with a mix of manufacturers, ingredient suppliers, distributors, retailers, and foodservice operators across Western and Eastern Indonesia, and then cross-checked themes with independent experts to tighten assumptions and reduce over-counting.
Distribution of primary research fieldwork respondents
| Company type | Respondent position |
|---|---|
| Top tier: 30% | CXOs: 16% |
| Mid tier: 52% | Functional/Unit leaders: 30% |
| Smaller Players: 18% | Managers: 54% |
Market-Sizing & Forecasting
Sizing starts with a top-down build that reconstructs the addressable demand pool from Indonesia food and beverage spend, and then applies category-level penetration for plant-based substitutes by channel and product group. The resulting totals are then stress-tested using selective bottom-up approximations, such as sampled brand price points multiplied by observed volumes from distributor and retailer checks, which helps adjust for gaps in reporting.
A few inputs that materially shape the model include: the share of dairy-alternative beverages within total plant-based value, on-trade versus off-trade mix, chilled versus frozen handling needs, ingredient-source shifts (such as soy and coconut versus newer bases), and typical price premiums versus conventional analogs. Where direct volume signals are thin, we fill gaps with proxy indicators like import patterns for key processed sub-categories and reported retail shelf expansion, and then re-check them with interview feedback.
Forecasts are built using scenario analysis supported by trend lines on product availability, channel expansion, and price normalization expectations, and then reconciled with the implied 2026 to 2031 growth path. Assumptions are kept repeatable so that the model can be refreshed as new public releases and channel signals emerge.
Data Validation & Update Cycle
Outputs are validated through triangulation across independent signals, followed by variance checks at the category, channel, and regional levels to catch discontinuities. If an outlier appears, the underlying inputs are reviewed, and targeted re-contacts are triggered to confirm whether the change is real or a data artifact.
Before sign-off, the model goes through multi-step analyst reviews, where totals are reconciled back to observable market behavior like pricing ranges and distribution reach. Reports are refreshed annually, with interim updates when material events occur, and a fresh final pass is completed close to delivery so clients receive the latest updated view.
Mordor Intelligence's Indonesia Plant Based Food and Beverages Market Sizing Compared With Other Published Estimates
Published market numbers often differ because each estimate draws the boundary in a slightly different way, and then uses different pricing and channel assumptions. The biggest swings usually come from what is counted as a substitute product, how foodservice is treated, and whether the model is refreshed after fast-moving launch and delisting cycles.
Retail price checks across modern trade and leading e-commerce listings, combined with channel interviews that confirm on-trade sell-through for dairy alternatives and meat substitutes, are the evidence anchors that keep Mordor Intelligence tied to only finished plant-based substitute foods and beverages sold in Indonesia, rather than broader alternative protein or ingredient markets.
Benchmark comparison
| Source | Market Size | Gaps in Research Methodology |
|---|---|---|
| Mordor Intelligence | USD 1.04 B (2025) | |
| Industry Publisher A | USD 0.68 B (2026) | Uses a narrower product basket that appears to focus on select packaged plant-based items and under-represents on-trade contribution, which can compress the total even if growth rates look healthy. |
| Sector Tracker B | USD 0.20 B (2024) | Likely reports a broader alternative protein subset with limited price normalization and a different base year, which can create a lower starting point when only a small part of plant-based foods and beverages is captured. |
The table shows that most of the spread can be traced back to category boundaries and to how channels and base years are treated. By keeping inclusions limited to consumer-facing substitute products and by rechecking prices and channel mix during updates, the model stays transparent and easier to replicate when assumptions need to be revisited.
Key Questions Answered in the Report
How large is the Indonesia plant-based food market in 2026?
The market is valued at USD 1.11 billion in 2026 with a projected 6.94% CAGR to 2031.
Which product category currently leads sales?
Dairy-alternative beverages command the highest share at 37.20% of 2025 revenue.
What segment is growing the fastest?
Meat substitutes exhibit the quickest expansion with a 7.02% CAGR through 2031.
Which region offers the best growth runway?
Eastern Indonesia is forecast to advance at a 6.62% CAGR due to infrastructure upgrades and nutrition programs.