
Indonesia Payments Infrastructure Market Size and Share
Market Overview
| Study Period | 2020 - 2031 |
|---|---|
| Forecast Data Period | 2026 - 2031 |
| Base Year Market Size (2025) | USD 112.69 Billion |
| Market Size (2026) | USD 127.32 Billion |
| Market Size (2031) | USD 203.47 Billion |
| Growth Rate (2026 - 2031) | 9.83 % |
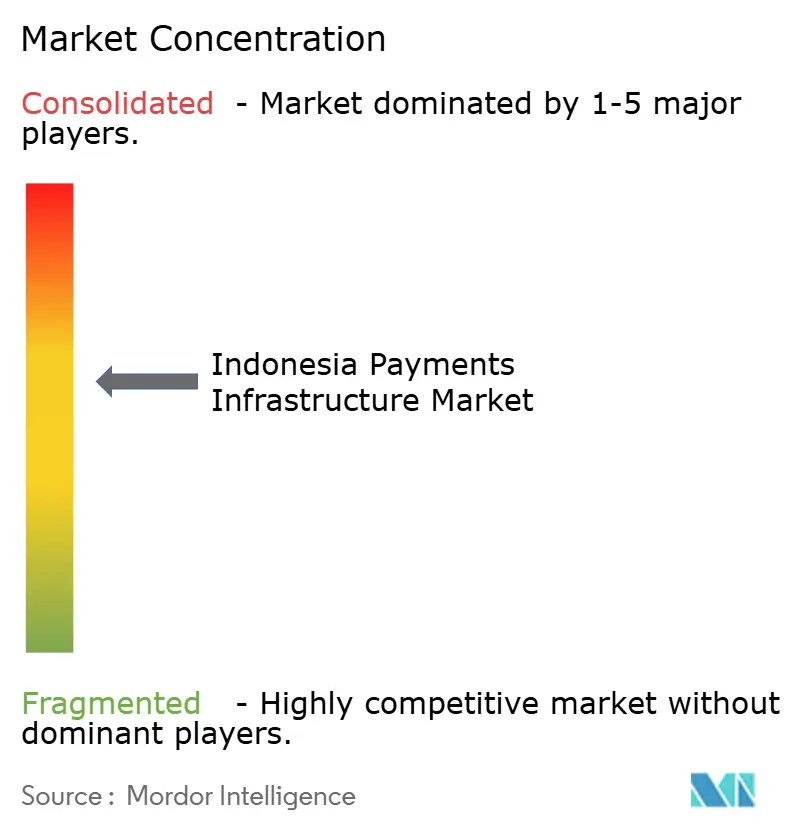
| Market Concentration | Medium |
Major Players *Disclaimer: Major Players sorted in no particular order Image © Mordor Intelligence. Reuse requires attribution under CC BY 4.0. | |
Indonesia Payments Infrastructure Market Analysis by Mordor Intelligence
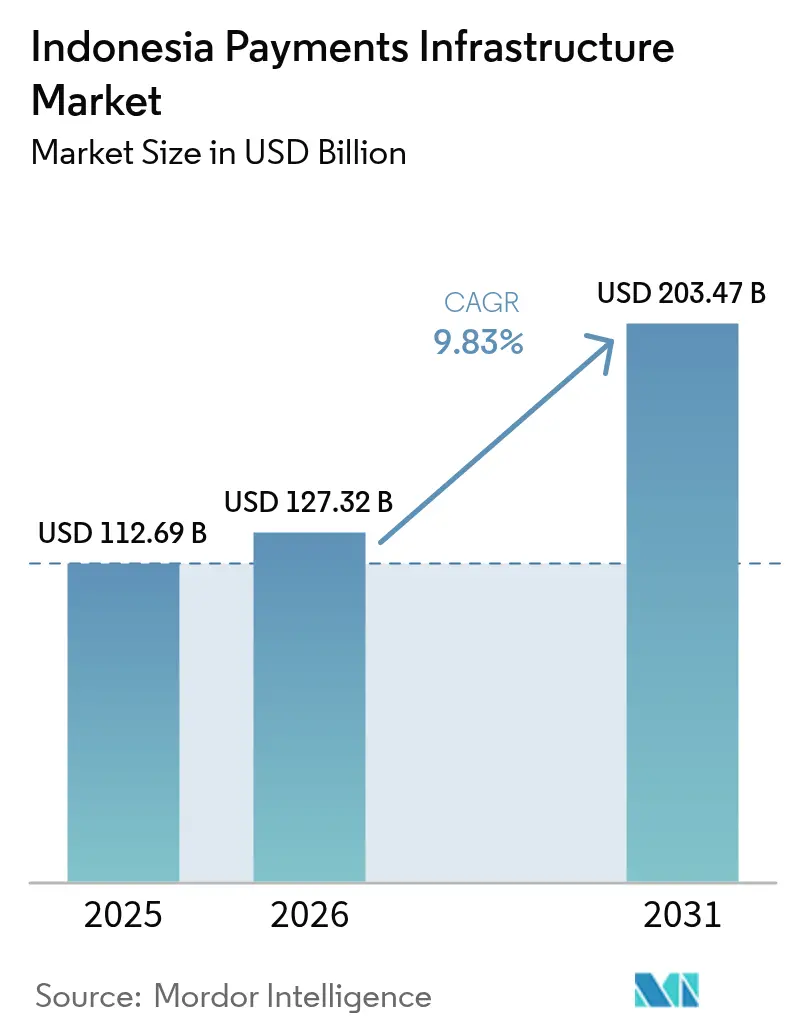
The Indonesia payments infrastructure market size is expected to increase from USD 112.69 billion in 2025 to USD 127.32 billion in 2026 and reach USD 203.47 billion by 2031, growing at a CAGR of 9.83% over 2026-2031. The steep growth curve mirrors accelerating QRIS merchant adoption, rapid uptake of the BI-FAST real-time rail, and a structural pivot from hardware to cloud-native orchestration. Super-app ecosystems keep embedding wallets into ride-hailing, e-commerce, and food-delivery flows, reinforcing e-money as the preferred consumer instrument. Foreign acquirers armed with Android-based POS devices continue to compress merchant discount rates and intensify platform consolidation. Telecom investments under the Palapa Ring program, together with cross-border QR operability, are expanding the Indonesia payments infrastructure market’s geographic reach into outer-island economies while supporting inbound tourism spend.
Key Report Takeaways
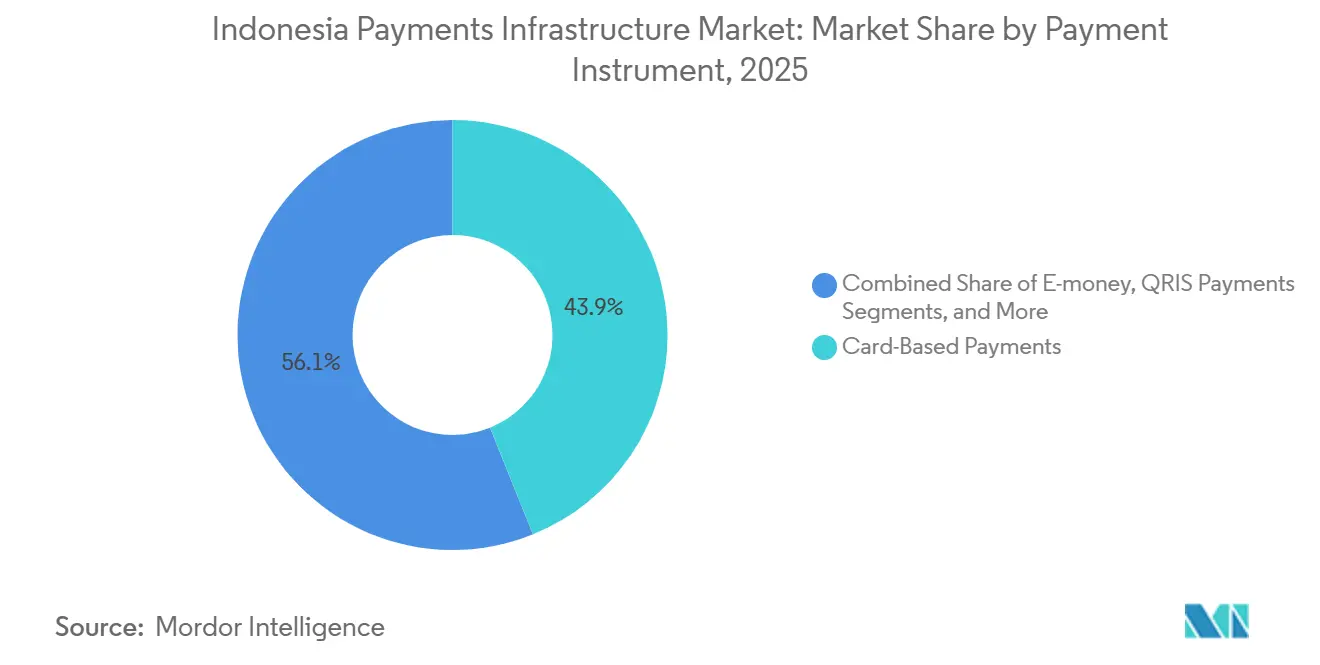
- By payment instrument, Card-based payments led with 43.89% of the Indonesia payments infrastructure market share in 2025, whereas e-money is advancing at an 11.21% CAGR through 2031.
- By component, Software and platform solutions commanded 58.67% of the Indonesia payments infrastructure market size in 2025 and remain the fastest-growing component at a 9.92% CAGR to 2031.
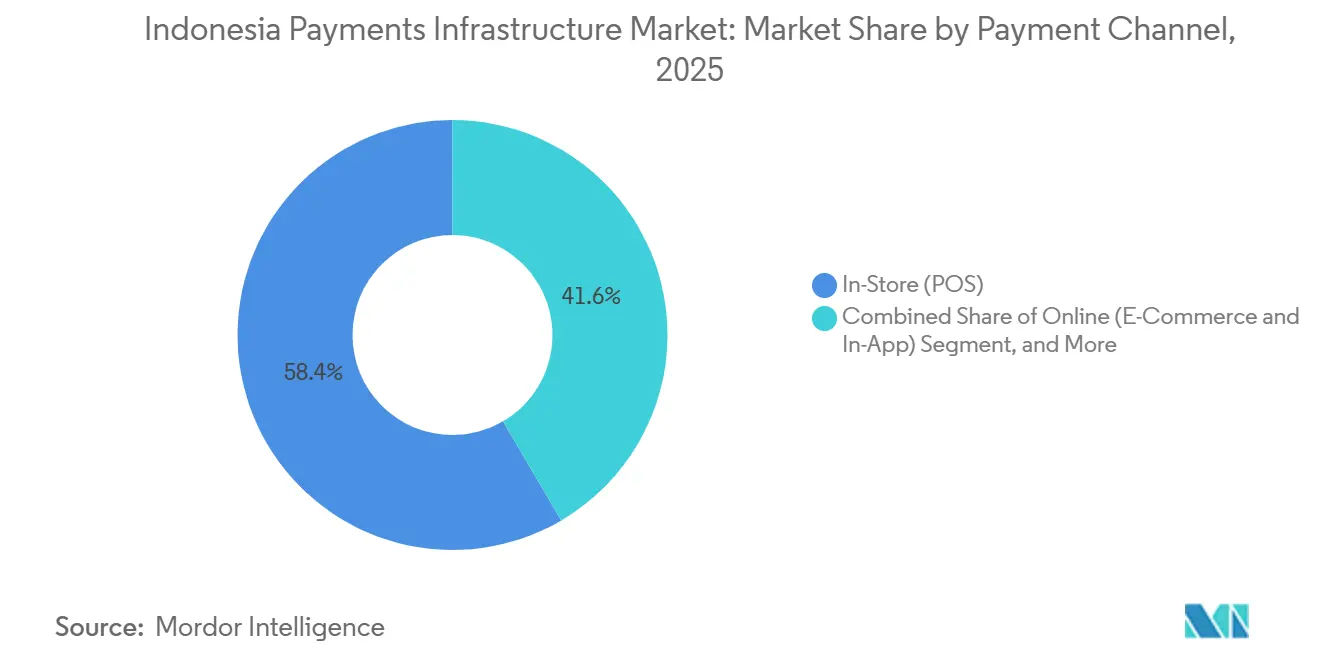
- By channel, In-store point-of-sale channels accounted for 58.43% of the Indonesia payments infrastructure market size in 2025; online and in-app channels are expanding at a 10.43% CAGR through 2031.
- By merchant vertical, Retail and grocery captured 32.92% of end-user spending in 2025, while transportation and mobility is forecast to grow at an 11.02% CAGR, the quickest among verticals.
Note: Market size and forecast figures in this report are generated using Mordor Intelligence’s proprietary estimation framework, updated with the latest available data and insights as of 2026.
Market Trends and Insights
Drivers Impact Analysis of Indonesia Payments Infrastructure Market*
| Driver | (~) % Impact on CAGR Forecast | Geographic Relevance | Impact Timeline |
|---|---|---|---|
| Government Push for QRIS Unified QR Code Accelerating Merchant Acceptance | +2.8% | National, with highest density in Java, Bali, and Sumatra; expanding to Kalimantan and Sulawesi | Short term (≤ 2 years) |
| Rapid Expansion of Domestic Real-Time Payment Rail BI-FAST Boosting Bank-Fintech Integrations | +2.3% | National, concentrated in urban centers; spillover to outer islands via mobile-banking apps | Medium term (2-4 years) |
| Increasing Mobile Wallet Adoption Among Unbanked Population in Outer Islands | +1.9% | Outer islands (Papua, Maluku, Nusa Tenggara), Eastern Indonesia provinces | Medium term (2-4 years) |
| Rising Foreign Investment in Indonesia's O2O Payments Acquiring Market | +1.4% | Java and Bali (Jakarta, Surabaya, Bandung, Denpasar); selective expansion to Medan and Makassar | Short term (≤ 2 years) |
| Migration of Government Social Disbursements to Digital Channels in Eastern Indonesia | +0.9% | Eastern Indonesia (Papua, Maluku, Nusa Tenggara Timur); pilot programs in Banyuwangi, East Java | Long term (≥ 4 years) |
| Growth of Embedded Finance Use-Cases in Agritech Cooperatives | +0.5% | Rural Java, Sumatra, and Sulawesi; agricultural cooperatives in Central Java and South Sulawesi | Long term (≥ 4 years) |
| Source: Mordor Intelligence | |||
Government Push for QRIS Unified QR Code Accelerating Merchant Acceptance
Bank Indonesia’s mandate requiring universal QRIS adoption collapsed fragmented proprietary codes into a single rail, cutting merchant friction and turning quick-response payments into the default tender across traditional markets and micro-enterprises.[1] Enrollment exceeded 40 million merchants by August 2025, and cross-border operability with Malaysia, Thailand, Singapore, and Japan deepened acceptance for inbound tourism spend. Static and dynamic QR codes now clear within 24 hours, easing working-capital strain for small traders. Merchant discount rates below 0.7% undercut card interchange, hastening cash displacement in food-and-beverage and convenience formats. The uniform code means providers must now compete on loyalty, lending, and embedded services rather than acceptance footprint.
Rapid Expansion of Domestic Real-Time Payment Rail BI-FAST Boosting Bank-Fintech Integrations
BI-FAST processed 1.22 billion transfers worth IDR 3,024 trillion in 3Q-2025, a 32.34% year-over-year lift, evidencing swift migration away from batch-clearing SKNBI. The flat IDR 2,500 fee structure incentivizes corporates to shift payroll and supplier payouts from costlier RTGS channels. Fintech gateways such as Xendit and OY! Indonesia integrated the rail to offer merchants sub-second settlement, shrinking fraud exposure windows and strengthening cash-flow predictability.[2] Always-on availability aligns with the mobile-first consumer base, 70% of whose digital spending occurs outside branch hours. As mid-tier banks onboard through 2026, real-time ubiquity will further cement the Indonesia payments infrastructure market’s transition to instant value movement.
Increasing Mobile Wallet Adoption Among Unbanked Population in Outer Islands
Indonesia reported 439.4 million e-money accounts in September 2024, yet branch penetration in Papua and Maluku remains under five per 100,000 adults. Wallets circumvent physical infrastructure, leveraging agent networks from Payfazz and BRI Agen to furnish cash-in and cash-out points in remote villages. Government transfer programs now top-up wallets directly, advancing financial inclusion while cutting leakages. The Palapa Ring expansion lowered mobile-data costs, enabling wallet functionality even in previously offline areas. Super-apps GoPay and ShopeePay are racing to seed these territories, using loyalty incentives to lock in first-mover advantage.
Rising Foreign Investment in Indonesia’s O2O Payments Acquiring Market
Xendit’s USD 300 million Series D led by Coatue and Tiger Global validated Indonesia as a regional hub for API-based acquiring. Pine Labs, Fiserv, and Worldline’s Ingenico unit have rolled out Android POS terminals that natively accept QRIS, tokenized cards, and BI-FAST, trimming merchant costs to as low as 0.5%.[3] As foreign capital chases urban scale, local acquirers respond by bundling inventory and analytics modules, but thinner discount rates are already triggering consolidation. The capital influx also accelerates geographic reach, with new entrants targeting Medan and Makassar after saturating Java-Bali corridors.
Restraints Impact Analysis of Indonesia Payments Infrastructure Market*
| Restraint | (~) % Impact on CAGR Forecast | Geographic Relevance | Impact Timeline |
|---|---|---|---|
| Inter-Island Telecom Infrastructure Gaps Limiting Latency-Sensitive Transactions | -1.2% | Outer islands (Papua, Maluku, Nusa Tenggara), remote areas in Kalimantan and Sulawesi | Medium term (2-4 years) |
| Fragmented Regulatory Oversight Between BI and OJK Complicates Licensing Timelines | -0.9% | National, affecting cross-border entrants and new fintech licensees | Short term (≤ 2 years) |
| High Merchant Attrition Due to Price Wars Among Acquirers | -0.6% | Java and Bali urban centers, competitive metro markets | Short term (≤ 2 years) |
| Limited Consumer Trust Outside Java in Card-Not-Present Transactions | -0.4% | Outer islands, rural Sumatra, Kalimantan, Sulawesi | Long term (≥ 4 years) |
| Source: Mordor Intelligence | |||
Inter-Island Telecom Infrastructure Gaps Limiting Latency-Sensitive Transactions
Despite 4G coverage reaching 90% of the archipelago, satellite backhaul still introduces 300-500 ms delays in Papua and Maluku, clashing with BI-FAST’s sub-100 ms requirement.[4] Timeout rates of up to 12% force merchants to revert to cash, stalling digital uptake where it is needed most. The government allocated IDR 15 trillion in 2025 for undersea cables, but completion is slated for 2027, leaving a near-term gap that tempers the Indonesia payments infrastructure market’s outer-island growth trajectory. Wallet providers must therefore maintain hybrid offline modes and agent cash-points to retain user trust until fiber reaches critical mass.
Fragmented Regulatory Oversight Between BI and OJK Complicates Licensing Timelines
BI for rail connectivity and OJK for e-money or BNPL licensing. Capital reserve duplication IDR 100 billion per license extends market entry to 18 months, deterring smaller cross-border players. POJK 32/2025 further demands 5% loan-loss buffers and caps BNPL rates at 0.5% per month, tightening the compliance vise. Absent a unified sandbox, innovators shoulder duplicated audit and security-testing costs, slowing the Indonesia payments infrastructure market’s ability to absorb novel propositions quickly.
*Our forecasts treat driver/restraint impacts as directional, not additive. The impact forecasts reflect baseline growth, mix effects, and variable interactions.
Indonesia Payments Infrastructure Market Segment Analysis
By Payment Instrument:
E-Money Strengthens Its LeadCard-based payments still generated 43.89% of 2025 volume, but e-money outpaced every other instrument, expanding at an 11.21% CAGR that will reshape the Indonesia payments infrastructure market size at the instrument level. QRIS standardization lowers acceptance costs for merchants that once balked at interchange fees, while super-apps reinforce switching costs through cashback and loyalty currencies. Real-time BI-FAST transfers continue to cannibalize legacy batch channels, especially for corporate disbursements that value flat fees over tiered RTGS pricing. Tokenized cards, mandated for card-not-present safety, are gaining share but remain a secondary option behind wallets for small-ticket purchases.
Mobile wallets already hold an outsized mindshare in urban Gen-Z cohorts, yet the unbanked population in Papua and Maluku is where incremental upside lies. Agent networks transform kiosks into cash-in points, enabling the Indonesia payments infrastructure market to bridge the last-mile gap. Wallet-to-wallet remittances routed through QRIS cut corridor fees, appealing to migrant workers in Malaysia and Singapore who remit home via Dana. With network effects compounding, e-money’s share of the Indonesia payments infrastructure market size could surpass cards well before 2031.

By Component:
Software Platforms Command Investment MomentumSoftware solutions captured 58.67% of component revenue in 2025 and are growing at 9.92% through 2031, as merchants demand single-API gateways that reconcile QRIS, BI-FAST, tokenized cards, and BNPL. Xendit’s multicurrency orchestration layer can on-board a merchant in three days, displacing hardware-centric integrators. The Indonesia payments infrastructure industry consequently channels capex from POS terminals toward cloud orchestration that pushes updates in real time.
Hardware retains a resilient niche among grocers and petrol stations that require tactile inputs and compliance-tested devices. Ingenico and PAX Technology have transformed Android terminals into multi-service hubs hosting loyalty, inventory, and tax modules. Managed services, including security audits and mandatory annual penetration testing under Regulation 4/2025, underpin recurring revenue streams for switching networks Artajasa and Finnet. This hybrid model highlights how the Indonesia payments infrastructure market share of software could rise further as merchants prioritize fast deployment and breadth of payment options.
By Payment Channel:
Online and In-App Transactions SurgeBrick-and-mortar registers still processed 58.43% of payments in 2025, but omnichannel experiences are pushing merchants to fuse their physical and digital checkout infrastructure. E-commerce platforms Tokopedia and Shopee now auto-embed BNPL, propelling average-order values and sustaining a 10.43% CAGR in online spend. High-value online bookings also benefit from tokenized card security, soothing consumer worries about fraud.
POS lanes are not relinquishing relevance; QRIS has trimmed checkout times for fast-food chains by 50%, while Android POS terminals now support offline mode for regions with patchy connectivity. Cloud registers from Moka POS synchronize inventory and rewards across channels, ensuring that the Indonesia payments infrastructure market can address consumers wherever they choose to transact. The convergence underscores a future where channel distinctions blur, but data unification becomes a competitive moat.
By End-User Vertical:
Transportation and Mobility AccelerateRetail and grocery led spending with 32.92% of 2025 value, thanks to nationwide mini-market chains accepting every digital tender. Still, transportation and mobility is advancing at an 11.02% CAGR as Gojek, Grab, and Blue Bird digitize ride, food, and parcel payments. Closed-loop wallets inside these super-apps lock riders into frictionless payment loops and stimulate adjacent spending such as ticketing and tolls.
Hospitality and travel have leaned into tokenized card mandates, boosting confidence for inbound tourists who increasingly scan QRIS to settle bills. Agriculture cooperatives using BI-FAST for harvest payouts evidence embedded finance momentum in rural economies. By collapsing multi-week cash cycles into same-day transfers, the Indonesia payments infrastructure market enables new vertical use-cases that broaden overall addressable volume.
Geography Analysis
Java anchors the Indonesia payments infrastructure market, housing 60% of QRIS-enabled merchants and the bulk of venture-funded fintech headquarters. Jakarta’s deep consumer wallet penetration catalyzes innovation that later permeates Bandung and Surabaya. Bali’s tourist-centric merchants adopted cross-border QR early, facilitating frictionless payments for Japanese, Malaysian, and Thai visitors, and now expect India’s UPI link to swell volumes further. Sumatra’s Medan and Palembang show quick wallet uplifts as agent networks bridge banking gaps. Mobile broadband costs continue to fall post-Palapa Ring, expanding digital bandwidth for small merchants.
Kalimantan and Sulawesi capitalize on embedded finance for commodity supply chains. Smallholder farmers receive input financing via fintech apps that disburse through BI-FAST, expediting working-capital loops. Nusa Tenggara’s Bali-adjacent economies benefit from QRIS spillovers, while Lombok’s hotel clusters implement tokenized card acceptance to mitigate chargeback risks. Banyuwangi’s GovTech pilot shows how municipal tax payments can migrate to real-time rails, offering a replicable template for resource-strained districts.
Papua and Maluku remain latency-constrained. Merchants still report frequent timeouts, limiting the Indonesia payments infrastructure market’s penetration despite high smartphone ownership. The IDR 15 trillion undersea-cable plan aims to cut network round-trip times below 50 ms by 2027. Once fiber arrives, wallet providers forecast a quick inflection as social-assistance transfers and migrant remittances pivot from cash to QRIS and BI-FAST rails.
Regulatory Landscape
Bank Indonesia (BI) and the Financial Services Authority (OJK) anchor payment regulation. BI oversees payment system rails and payment service providers, while OJK governs adjacent consumer-credit constructs such as BNPL. BI reinforced consolidation and risk-based supervision via Peraturan Bank Indonesia (PBI) No. 10/2025 on the Payment System Industry, applying the "same activities, same risk, same regulation" approach and mandating the TIKMI framework (transactions, interconnection, competence, risk management, and IT infrastructure) for licensing and ongoing compliance, with the framework set to take effect on March 31, 2026.
For retail standards, BI continues to expand QRIS rules through Peraturan Anggota Dewan Gubernur (PADG) No. 3/2025, including the formal enablement of NFC-based QRIS Tap (TAP) and message-based data communications. BI kept a per-transaction cap of Rp 10,000,000 and allows providers to apply cumulative limits under their risk policies. OJK also tightened BNPL operating requirements under POJK 32/2025, including a 0.5% per month rate cap and a 5% loan-loss buffer, raising the compliance bar for providers that embed credit into checkout flows.
Value Chain Analysis
Indonesia's payments infrastructure value chain starts with public rails and standards set by BI, including QRIS for merchant acceptance and BI-FAST for real-time account-to-account transfers, supported by interoperability norms that push private participants to build on standardized interfaces such as API-based integration. Switching and routing for domestic payments are anchored by National Payment Gateway switching institutions, including PT Artajasa Pembayaran Elektronis, PT Rintis Sejahtera, PT Alto Network, and PT Jalin Pembayaran Nusantara, which connect banks, e-money issuers, and merchant acquirers into a unified clearing and settlement fabric.
On the private layer, payment gateways and processors (including Xendit and Midtrans) connect merchants to multiple instruments (QRIS, transfers, cards, and BNPL), while e-wallets (GoPay, OVO, DANA, ShopeePay) and BNPL players (Kredivo, Akulaku) drive front-end consumer adoption and use-case expansion across super-app and e-commerce journeys. Merchant enablement flows through acquirers and POS platforms, with Android POS and software-led orchestration increasingly bundling payments with loyalty and operational tools. Bottlenecks concentrate in compliance and resilience requirements under BI's TIKMI framework, and in connectivity gaps outside Java that elevate timeout risk for latency-sensitive transactions.
Competitive Landscape
Competition is moderate, with the top five wallets holding roughly 60% of 2025 e-money volume but a long tail of specialist acquirers, switch networks, and gateways holding discrete value-chain niches. Xendit’s Series D boosted its firepower to extend multicountry orchestration, intensifying pressure on legacy acquirers reliant on proprietary switch fees. Foreign entrants Pine Labs and Fiserv compress discount rates to 0.5-1.0%, obliging domestic players GHL and Cashlez to layer analytics and inventory modules into their offers.
Infrastructure operators Jalin, Artajasa, and Finnet face BI-FAST fee disruption and therefore pivot to managed compliance services, supporting mid-tier banks lacking cyber talent. Super-apps leverage closed-loop ecosystems to extend beyond payments into credit, insurance, and wealth management, widening user stickiness and data moats. Smaller contenders Payfazz and MC Payment fill last-mile gaps in Papua and Maluku through agent kiosks that convert cash to wallet top-ups, securing flows overlooked by urbancentric rivals.
Fraud prevention has emerged as a key battleground. Midtrans deploys sub-200 ms machine-learning checks, a regulatory requirement for processors exceeding 10 million monthly transactions. BNPL players Kredivo and Akulaku, newly regulated under POJK 32/2025, must hold 5% loan-loss reserves, crystallizing a high-capital moat that freezes out underfunded challengers. By 2027, analysts expect 10-15 scaled platforms to control the lion’s share of the Indonesia payments infrastructure market as price wars and regulatory burdens force smaller firms to exit or merge.
Indonesia Payments Infrastructure Industry Leaders
-
Xendit
-
Olsera.com
-
Edgeworks Solutions Pte Ltd
-
PT Cashlez Worldwide Indonesia
-
PT Finnet Indonesia
- *Disclaimer: Major Players sorted in no particular order
Indonesia Payments Infrastructure Market Companies Covered in this Report
- GHL Indonesia (GHL Systems Bhd)
- PT Cashlez Worldwide Indonesia
- Xendit
- Moka POS (GoTo Financial)
- PT Jalin Pembayaran Nusantara
- Pawoon Indonesia
- OY! Indonesia
- PT Finnet Indonesia
- iPaymu (Inti Prima Mandiri Utama)
- PT Artajasa Pembayaran Elektronis
- Ant Group (Dana - PT Espay Debit Indonesia Koe)
- ShopeePay (SeaMoney)
- Centerm
- Ingenico (Worldline Group)
- Pax Technology
- Fiserv, Inc.
- Pine Labs
- Payfazz
- MC Payment Indonesia
- Edgeworks Solutions Pte Ltd
- Olsera.com
- Kredivo (PT FinAccel Teknologi Indonesia)
- Midtrans
Read Analysis of Indonesia Payments Infrastructure Companies
Market Opportunities and Future Outlook
Cross-border QR acceptance is expanding addressable flows for acquirers, gateways, and merchant POS platforms as BI advances QRIS interoperability beyond domestic use. In April 2026, BI launched the Indonesia-South Korea QR cross-border payment linkage, and in June 2026 BI and UnionPay announced full operational status for two-way QR interoperability between Indonesia and China. Together, these rollouts shift QRIS from primarily inbound-tourism enablement toward broader retail trade and travel corridors, creating demand for multi-currency reconciliation, dispute handling, and merchant onboarding at scale.
On domestic rails, rising BI-FAST throughput and BI's "New BI-FAST" program open whitespace for fraud controls, resiliency tooling, and bank-fintech integration services that shorten settlement cycles for SMEs and platform merchants. BI reported BI-FAST retail volume at 1.89 billion transactions as of April 2026, representing 35% year-on-year growth, supporting commercial use-cases such as supplier payouts and marketplace settlements. BI's April 2026 initiatives, including the Indonesia Digital Innovation Centre (PIDI) and continued KATALIS P2DD capacity building for regional government electronification, also reinforce adoption beyond major metros. For providers, the near-term opportunity lies in building compliant, cloud-native orchestration spanning QRIS (including QRIS Tap), BI-FAST, tokenized cards, and regulated BNPL under tighter OJK rules, with a particular emphasis on outer-island distribution models that combine agent networks with offline-capable POS and wallet functionality.
Recent Industry Developments in Indonesia Payments Infrastructure Market
- July 2026: Xendit announced the integration of Dragonpay, an alternative payments provider in the Philippines, bringing Dragonpay into Xendit following a longstanding partnership and prior investment relationship. The move expands Xendit’s regional alternative-payments coverage and strengthens multi-market orchestration capabilities that merchants use to manage different rails and consumer payment methods.
- December 2025: OJK issued POJK 32/2025 to formalize BNPL licensing, cap monthly interest at 0.5%, and require a 5% loan-loss buffer. The tighter framework raises capital and compliance requirements for BNPL providers and for platforms embedding pay-later at checkout, influencing underwriting, pricing, and partner selection across gateways and merchants.
- April 2024: Xendit formally announced its expansion into Thailand, extending its footprint beyond Indonesia, the Philippines, and Malaysia. This geographic expansion supports merchants with cross-border operations and increases competitive pressure on gateways and processors serving Indonesian businesses that sell or source across Southeast Asia.
Indonesia Payments Infrastructure Market Report Scope and Research Methodology
Market Definition and Coverage
This market covers the value generated in Indonesia from the infrastructure that enables electronic payments to be initiated, authorized, routed, cleared, and settled across channels like POS, e-commerce, and in-app transfers.
Scope exclusions: Cash-only transactions and purely manual, offline settlement flows are excluded from this market sizing.
Segments Covered in This Report
- By Payment Instrument
- Card-Based Payments
- Real-Time Bank Transfers (BI-FAST, SKNBI, RTGS)
- E-Money
- QRIS Payments
- Other Emerging Instruments (BNPL, Tokenized Cards)
- By Component
- Hardware
- Software and Platform
- Services
- By Payment Channel
- In-Store (POS)
- Online (E-Commerce and In-App)
- In-App P2P Transfers
- By End-User Vertical
- Retail and Grocery
- Food, Beverages, and Quick-Service Restaurants
- Transportation and Mobility
- Travel and Hospitality
- Other End-User Verticals
Data Sources, Market Sizing, and Validation
Desk Research
Desk research was used to set the guardrails of the model and to build the starting dataset for Indonesia payments infrastructure. We relied on official statistics and rulebooks to understand the rails and their adoption, and then mapped those signals to where revenues typically sit across processing, switching, acceptance, and related service layers.
Public sources were referenced for baseline indicators and market context, such as Bank Indonesia publications (including payment system updates and QRIS-related developments), Statistics Indonesia (BPS) for macro and household spend context, IMF and World Bank datasets for economic and digital access indicators, and BIS materials on payment systems and retail payment trends. We also reviewed company filings and investor decks, association websites, and trusted press coverage, and then used paid subscriptions for company financial intelligence, patent lookups, shipment-level import-export checks where relevant for terminals, and news and financials screening. These examples are not exhaustive, and many other public and paid sources were used during data collection, validation, and clarification.
Primary Interviews and Surveys
Primary work was used to stress-test how quickly different payment instruments and channels are scaling in Indonesia, and to confirm what is monetized as a fee versus what is bundled into broader service contracts. We spoke with a mix of payment ecosystem participants (issuers, acquirers, processors, gateways, merchants, and enabling service providers) so assumptions like take rates, terminal deployment pace, and QR acceptance behavior could be corrected before finalizing the model.
Distribution of primary research fieldwork respondents
| Company type | Respondent position |
|---|---|
| Top tier: 30% | CXOs: 17% |
| Mid tier: 53% | Functional/Unit leaders: 38% |
| Smaller Players: 17% | Managers: 45% |
Market-Sizing & Forecasting
The sizing starts with a top-down build that reconstructs the addressable payments infrastructure pool from payment-instrument activity and channel mix, and then translates those activity levels into infrastructure revenue pools through validated monetization levers. To keep the totals realistic, we then corroborate them with selective bottom-up approximations, such as sampled ASP times installed base for acceptance hardware, and a roll-up of representative supplier and merchant-service revenue ranges gathered in interviews.
Key inputs (illustrative) include the growth in QRIS acceptance, the scaling of real-time transfers through BI-FAST, the expansion of POS terminal density, the share shift between in-store and online payments, and the typical fee structures seen across switching, gateway processing, and value-added services like fraud screening. Where a data gap appears, we use conservative ranges and apply cross-checks against adjacent indicators, and then narrow the range after follow-up calls with practitioners.
Forecasting is done using scenario analysis, where the base case is anchored to confirmed adoption curves and expected pricing progression. Alternative cases are added for faster merchant onboarding or slower fee compression. The final forecast path is adjusted only after the assumed drivers are consistent with what operators say they can deliver and what public system metrics signal.
Data Validation & Update Cycle
Outputs are checked against independent signals, including payment rail adoption updates, observable acceptance expansion, and macro consumption trends, so that growth does not outrun plausible usage behavior. When results look unusual, we re-check conversion steps, units, and currency timing, and then re-contact sources if a single assumption is driving most of the swing.
Before sign-off, the model is reviewed in multiple steps, with peer checks on formulas, scope alignment, and whether inputs match the market narrative. Reports are refreshed annually, and interim updates are made when a material event changes adoption, regulation, or pricing. Right before delivery, a fresh review pass is completed so clients receive the latest updated view.
Mordor Intelligence's Indonesia Payments Infrastructure Market Size Compared Against Other Published Estimates
Published market sizes for Indonesia payments infrastructure often vary because each publisher counts a different set of activities as infrastructure revenue and then applies different growth and pricing assumptions. The spread usually comes from what is included around payment instruments, what is counted as hardware versus services, and how quickly fee rates are assumed to change over the forecast.
Card purchase value and wallet transaction value are sometimes treated as the market itself, which can inflate totals if the full payment volume is mistaken for infrastructure revenue. Non-core adjacencies also create gaps, such as adding broad fintech revenue or consumer financial services that do not directly enable payment routing, clearing, and settlement. Wallet-led QR activity, BI-FAST adoption, and terminal deployment pace also matter because they change the channel mix, and then the implied revenue pools, especially when currency conversion timing and refresh cadence differ.
Benchmark comparison
| Source | Market Size | Gaps in Research Methodology |
|---|---|---|
| Mordor Intelligence | USD 112.69 B (2025) | |
| Trade Journal A | USD 71.80 B (2024) | Uses card payments transaction value as the main proxy, which narrows coverage to card-based activity and does not fully capture QR, real-time transfers, platform fees, and supporting service revenues. |
| Industry Report B | USD 441.24 B (2025) | Appears to measure the broader cards and payments value pool, where total payment instrument value is included, which overstates infrastructure revenues like processing, switching, and acceptance services. |
The table shows that the biggest differences come from mixing up payment value with infrastructure revenue and from bundling adjacent financial services into the total. Card payment value sits outside Mordor Intelligence's scope because the model counts only infrastructure-linked revenues tied to enabling, routing, and settling payments, which keeps the estimate traceable to adoption and monetization drivers.
Key Questions Answered in the Report
How fast is digital payment value growing in Indonesia?
The Indonesia payments infrastructure market is projected to expand at a 9.83% CAGR from 2026 to 2031, rising from USD 127.32 billion in 2026 to USD 203.47 billion by 2031.
Which payment instrument is gaining share quickest?
E-money, propelled by super-app wallets and QRIS acceptance, is increasing at an 11.21% CAGR, outpacing card-based options.
Why do merchants prefer QRIS to traditional cards?
QRIS carries merchant discount rates below 0.7% and settles within 24 hours, whereas card interchange often exceeds 1.5% and clears on a T+2 cycle.
What role does BI-FAST play in corporate disbursements?
The real-time rail’s flat IDR 2,500 fee and sub-second settlement are pushing payroll and supplier payments away from expensive RTGS channels.
Which vertical shows the fastest digital-payment growth?
Transportation and mobility leads with an 11.02% CAGR, driven by ride-hailing and delivery apps embedding closed-loop wallets.
How fragmented is the competitive landscape today?
Five super-app or API-gateway leaders process about 60% of wallet volume, giving the market a moderate concentration score of 6.